Fatigue Behaviors of Ultra Fine Wires of
-Type and
-Type Titanium Alloys
Satoshi Yonezawa
1;*1, Takayuki Narushima
1, Kyosuke Ueda
1,
Hisamichi Kimura
2, Chiaki Ouchi
1and Yasutaka Iguchi
1;*21
Department of Materials Processing, Tohoku University, Sendai 980-8579, Japan 2Institute for Materials Research, Tohoku University, Sendai 980-8577, Japan
Fatigue behaviors of ultra fine wires of-type Ti-14Mo-3Nb-1.5Zr alloy and-type Ti-10Zr alloy and-type CP (commercially pure) titanium with diameters in the range of 35–100mmwere investigated by rotating-bending fatigue testing in 1 mass% lactic acid solution maintained at 310 K. The maximum number of cycles during fatigue testing was107. The-type Ti-14Mo-3Nb-1.5Zr alloy wires showed a clear
fatigue limit. On the other hand, the-type Ti-10Zr alloy wire and-type CP titanium wire did not show a clear fatigue limit, and their fatigue strengths gradually decreased with decreasing maximum bending stress. The fatigue limit of a-type Ti-14Mo-3Nb-1.5Zr alloy wire with a polished surface was greater than 50% of its tensile strength, while the fatigue limits of titanium wires with as-drawn surfaces were less than 50% of their tensile strengths. Surface defects that were introduced during the cold drawing process of the wires might act as crack origins of the fatigue fracture. Therefore, surface polishing is an effective technique for improving fatigue properties of titanium wires. The elution of metallic ions from the wires into the 1 mass% lactic acid solution was suppressed at a very low level during fatigue testing of all the investigated titanium
wires. [doi:10.2320/matertrans.MF200920]
(Received January 26, 2009; Accepted February 23, 2009; Published April 8, 2009)
Keywords: titanium wire, lactic acid solution, elution, fatigue limit, rotating-bending fatigue testing
1. Introduction
Functional electrical stimulation (FES) is the controlled application of an electric field near a motor nerve to achieve external control over a motor unit.1)The electrode of an FES system is the interface that transmits programmed electrical signals to the neuromuscular systems of the extremities.2) The present authors have developed a percutaneous intra-muscular electrode for the FES system.2,3) The electrode is
made from a helically coiled rope wound from 19 strands of hard drawn wires of austenitic stainless steel. The diameter of each wire is 25mm. However, in the percutaneous FES system, daily maintenance of the region around the lead exit sites is required in order to avoid infection; this is burdensome to patients and their families. Therefore, it is desirable for an FES system to be totally implantable.4)The
functional requirements of an electrode of a totally implant-able FES system are that it should be more biocompatible and reliable than an electrode of a percutaneous FES system, because its replacement is not easy and it is expected to function for at least ten years after implantation.
Titanium and its alloys have been widely employed in dental and medical implants because of their excellent properties such as low density, high corrosion resistance, excellent strength-ductility balance and biocompatibility.5)
Therefore, titanium can potentially be used as a source material for the electrode of a totally implantable FES system. Fatigue properties of fine-diameter wires made of titanium materials under biological conditions should be elucidated in order to use them in an FES electrode. Although the fatigue properties of fine-diameter titanium wires are essential data for clinical applications, they have not yet been investigated. Recently, our group developed a new -type
titanium alloy, Ti-14 mass%Mo-3 mass%Nb-1.5 mass%Zr (hereafter referred to as Ti-14Mo-3Nb-1.5Zr), which has excellent cold workability and biocompatibility6)for manu-facturing cold-drawn titanium wires with diameters of less than 50mm.
In this study, fatigue behaviors of cold-drawn titanium wires made of the-type Ti-14Mo-3Nb-1.5Zr alloy,-type Ti-10 mass%Zr (hereafter referred to as Ti-10Zr) alloy and -type commercially pure titanium (hereafter referred to as CP titanium) with diameters in the range of 35–100mmwere investigated by rotating-bending fatigue testing in 1 mass% lactic acid solution maintained at 310 K. In a previous study, experimental techniques for investigating the fatigue proper-ties of stainless steel wires were established.3)In the present
study, fatigue strength and elution of ions into the solution during fatigue testing were measured, and fracture surfaces of the wires were observed.
2. Experimental
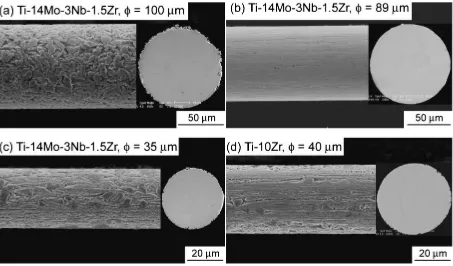
-type Ti-14Mo-3Nb-1.5Zr titanium wires (Hiyama Rare-Metal Industry, Koga, Japan), -type Ti-10Zr alloy wire (Hiyama Rare-Metal Industry, Koga, Japan) and-type CP titanium wire (Nilaco, Tokyo, Japan) were used as specimens for fatigue testing. These wires were fabricated by a cold drawing process. The diameters and tensile strengths of the specimen wires are summarized in Table 1. Side views and cross sections of the specimen wires are shown in Fig. 1. The Ti-14Mo-3Nb-1.5Zr alloy wire with a diameter of 89mmhas a polished surface, while the other two Ti-14Mo-3Nb-1.5Zr alloy wires with diameters of 35 and 100mmhave as-drawn surfaces. The tensile strengths listed in Table 1 were measured using a mechanical strength testing machine (Instron4301).
The fatigue strength of the wires was measured using a dual-axle-driven rotating-bending fatigue machine.3)A pair of axles was rotated in opposite directions, which led to
*1Graduate Student, Tohoku University
*2Present address: Hachinohe National College of Technology, Hachinohe 039-1192, Japan
Materials Transactions, Vol. 50, No. 7 (2009) pp. 1713 to 1719
repeated bending of the specimen wire. The rotation rate of the axles was fixed to 1000 rpm. The bending stress was varied by changing the distance between the two axles from 4 mm to 30 mm. The maximum bending stress () was roughly estimated using the following equation:7)
¼E=D ð1Þ
whereEis the Young’s modulus of titanium materials,is the diameter of the specimen wire andDis the diameter of the curved part of the specimen wire. Values of 110 GPa8)
and 90 GPa6)were used as the Young’s moduli of the- and
-type titanium materials, respectively. Fatigue testing was stopped when the specimen wire failed or the number of cycles reached107. During fatigue testing, the curved part of each specimen wire was immersed in 1 mass% lactic acid solution maintained at 310 K with an initial pH of 2.2.3)The
solution volume was 35 cm3. After fatigue testing, the fracture surfaces and side surfaces of the wires were observed using a scanning electron microscope (SEM, XL30-FEG, Philips). The solution after fatigue testing was filtered using a membrane filter made of polycarbonate; the pore size of the filter was 0.2mm. The metallic ion concentration of the filtrate was quantitatively determined by inductively coupled plasma-atomic emission spectroscopy (ICP-AES, ICPS8100,
Shimadzu). The concentration of metallic ions eluted from the titanium wires was compared with that obtained by a static immersion test. In the static immersion test, a titanium wire with a length of 30 mm was statically immersed in 1 mass% lactic acid solution (35 cm3) maintained at 310 K for 600 ks, which corresponded to a fatigue testing time of107cycles.
Hardness distributions of cross sections of the titanium wires were measured using a micro-Vickers hardness tester (HM-102, Akashi) with a load of 10 gf.
3. Results and Discussion
3.1 Fatigue limit
Fatigue curves of Ti-14Mo-3Nb-1.5Zr alloy wires with diameters of 100mm, 89mm and 35mm obtained during rotating-bending fatigue testing in 1 mass% lactic acid solution are shown in Fig. 2. The arrowheads in the figure indicate that the specimen wire did not fail up to107 cycles. For the Ti-14Mo-3Nb-1.5Zr alloy wires with diameters of 100mm, 89mmand 35mmat maximum bending stresses of 303 MPa, 668 MPa and 525 MPa, respectively, failure was not observed up to107cycles. Therefore, the fatigue limits of these wires can be evaluated to be in the ranges of 303– 364 MPa, 668–801 MPa and 525–630 MPa, respectively.
Figures 3(a)–(i) show fracture surfaces of the Ti-14Mo-3Nb-1.5Zr alloy wires after fatigue testing. Each fracture surface consists of two regions, the fatigue crack propagation region and the final overload region.9)However, in the wire
with the diameter of 35mm, these two regions cannot be observed as clearly as those in the other two wires with larger diameters. Crack origins are observed at edges of the fracture surfaces. Generally, the alternating load forms a slip band on the metallic surface, which develops with increasing number of cycles and acts as the fatigue crack. As shown in Fig. 1,
[image:2.595.72.525.71.337.2]Fig. 1 SEM images of side views and cross sections of titanium alloy wires before fatigue testing in 1 mass% lactic acid solution.
Table 1 Titanium wires used in this study.
Type Materials Diameter,
(mm)
Tensile Strength,
U(MPa)
Surface
Ti-14Mo-3Nb-1.5Zr 100 1224 as-drawn
Ti-14Mo-3Nb-1.5Zr 89 1176 polished
Ti-14Mo-3Nb-1.5Zr 35 1309 as-drawn
Ti-10Zr 40 1296 as-drawn
[image:2.595.45.291.397.484.2]before fatigue testing, surface defects are observed on the titanium wires with as-drawn surfaces. The cracks probably originate from the surface defects formed during the cold drawing process of the wire and then propagated through the wire.10)The decrease in the cross-sectional area of the wire leads to the final overload failure. The fatigue properties of the surface-polished titanium wires might have improved because surface polishing could cause a decrease in the number and size of surface defects.
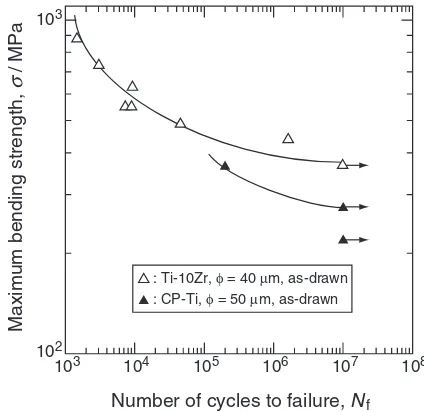
Figure 4 shows fatigue curves of the-type Ti-10Zr alloy wire and -type CP titanium wire in 1 mass% lactic acid solution. No clear fatigue limit is observed for the -type titanium wires, and their fatigue strength gradually decreases with decreasing maximum bending stress. In this study, the fatigue limit of the -type titanium wires is defined as the fatigue strength at which no failure is observed up to 107 cycles. The Ti-10Zr alloy wire and CP titanium wire did not fail up to 107 cycles at maximum bending stresses of
103
Number of cycles to failure, Nf
Maximum bending strength, / MPa
σ
102
103
104 105 106 107 108
: Ti-14Mo-3Nb-1.5Zr, φ = 100 µm, as-drawn : Ti-14Mo-3Nb-1.5Zr, φ = 89 µm, polished : Ti-14Mo-3Nb-1.5Zr, φ = 35 µm, as-drawn
Fig. 2 Fatigue curves of-type alloy wires in rotating-bending fatigue testing in 1 mass% lactic acid solution.
Fig. 3 SEM images of fracture surfaces of-type alloy wires after fatigue testing in 1 mass% lactic acid solution. (a), (b) and (c):
Ti-14Mo-3Nb-1.5Zr¼100mm(d), (e) and (f): Ti-14Mo-3Nb-1.5Zr¼89mm(g), (h) and (i): Ti-14Mo-3Nb-1.5Zr¼35mm
103
Number of cycles to failure, Nf
Maximum bending strength, / MPa
σ
102
103
104 105 106 107 108
: Ti-10Zr, φ = 40 µm, as-drawn : CP-Ti, φ = 50 µm, as-drawn
Fig. 4 Fatigue curves of-type titanium wires in rotating-bending fatigue testing in 1 mass% lactic acid solution.
[image:3.595.319.531.71.277.2] [image:3.595.64.276.71.277.2] [image:3.595.68.526.325.633.2]368 MPa and 275 MPa, respectively, which implies that their fatigue limits are in the ranges of 368–440 MPa and 275– 367 MPa, respectively. As shown in Fig. 2, the -type titanium alloy wires show a clear fatigue limit independent of surface roughness and wire diameter. The difference between crystal structures of the - and -type titanium alloys might be the cause of the difference in shapes of the fatigue curves of these wires in rotating-bending fatigue testing. The crystal structures of - and -type titanium materials are hcp (hexagonal close-packed) and bcc (body-centered cubic), respectively. Other research groups have been also obtained fatigue curves with clear and unclear fatigue limits for -type Ti-29Nb-13Ta-4.6Zr alloy11) and -type Ti-5Al-2.5Sn alloy,12) respectively. The þ type titanium alloys such as Ti-6Al-4V and Ti-4.5Al-3V-2Fe-2Mo showed clear fatigue limits.13) These studies suggest that thephase in titanium with higher Peierls potential than phase causes the clear fatigue limit.
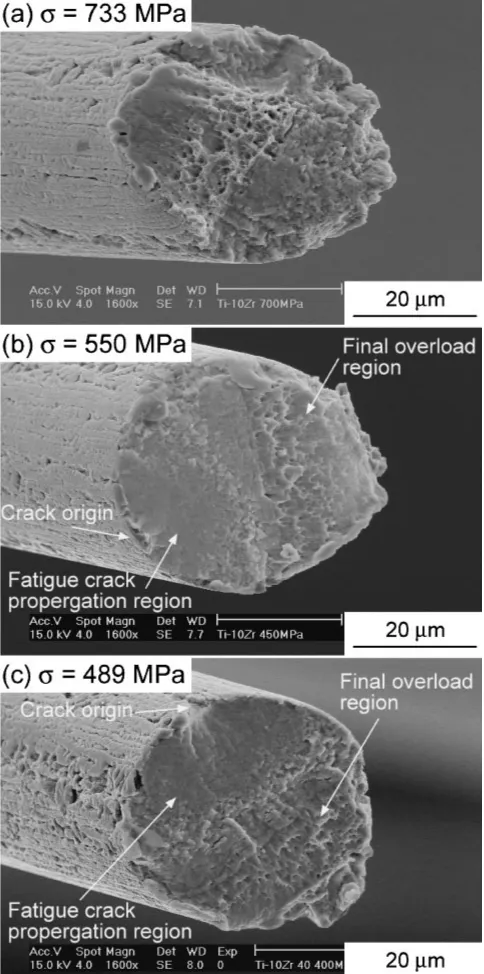
Figures 5(a)–(c) show the fracture surfaces of the Ti-10Zr alloy wire after fatigue testing at maximum bending stresses of 733 MPa, 550 MPa and 489 MPa, respectively. The crack origin, the fatigue crack propagation region and the final overload region are detected on the fracture surfaces shown in Figs. 5(b) and (c) as well as on the fracture surface of -type titanium alloy wires shown in Fig. 3. The fracture surface of the -type Ti-10Zr alloy wire is considerably rougher than those of the -type Ti-14Mo-3Nb-1.5Zr alloy wires. The reason for this difference in the surface roughness could not be revealed in this study.
3.2 Hardness of wires
Hardness distributions of the cross sections of titanium wires before fatigue testing are shown in Fig. 6. The hardness values of fine wires such as the Ti-14Mo-3Nb-1.5Zr alloy wire with the diameter of 35mm, the Ti-10Zr alloy wire and the CP titanium wire are higher around the center than in the outer region. On the other hand, the hardness distributions of the Ti-14Mo-3Nb-1.5Zr alloy wires with diameters of 89mm and 100mmare uniform; further, the hardness values around the centers of these wires are lower than that around the center of the Ti-14Mo-3Nb-1.5Zr alloy wire with the diameter of 35mm. The higher hardness of the fine wires may be attributed to work hardening during the cold drawing process. Another possible reason for the high hardness is the solution hardening of oxygen from titanium oxide film used for lubrication during the cold drawing process of the fine wires. However, the higher hardness around the center than in the outer region suggests that the effect of the solution hardening of oxygen on wire hardness is small. The oxide film used for lubrication in the drawing process of the -type titanium alloy wires was formed by anodic oxidation. It is well known that low process temperature of anodic oxidation as compared to that of air oxidation can cause suppression of incorporation of oxygen in the wire. It was reported that severe drawing of an austenitic stainless steel wire resulted in a higher hardness around the center than in the outer region of the wire;14)this result is in good agreement with the results of the hardness distribution of the fine titanium wires in this study, shown in Fig. 6(a).
3.3 Ratio of fatigue limit to tensile strength
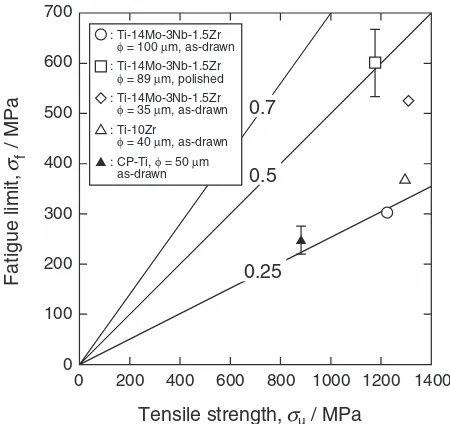
Figure 7 summarizes the relationship between the tensile strength (U) and the fatigue limit (f) of the titanium wires.
It is empirically known that the fatigue strength of the titanium materials in rotating-bending fatigue testing is approximately 40% to 60% of their tensile strength.15)In this
study, the values of f=U for the titanium wires with
as-drawn surfaces were less than 0.5, while that for the polished titanium wire was greater than 0.5. As shown in Figs. 3 and 5, the crack origin was observed at the edges of the fracture surfaces. The surface defects that were introduced during the cold drawing process might act as crack origins of the fatigue fracture, and they appear to cause a decrease in the value of f=U. Therefore, in order to improve the fatigue properties
[image:4.595.306.548.75.562.2]of as-drawn titanium wires under biological conditions, it is important to optimize the cold drawing process.
The f=U value of the Ti-14Mo-3Nb-1.5Zr alloy wire
with the diameter of 35mm was higher than that with the diameter of 100mm; that is, thef=Uvalue increased with a
decrease in the diameter of the wire. This tendency of the f=Uvalue might be attributed to the possibility of presence
of the severe defects on the surface of the wire.
3.4 Metallic ion elution
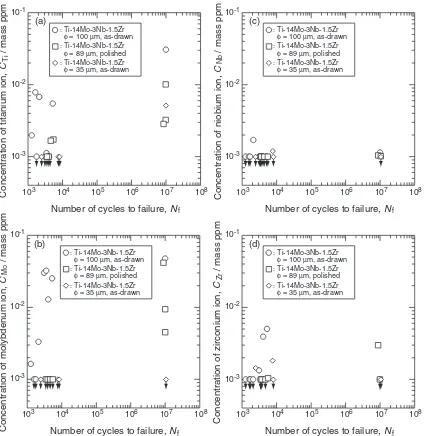
Figures 8 and 9 show concentrations of metallic ions eluted from the Ti-14Mo-3Nb-1.5Zr and Ti-10Zr alloy wires, respectively, into the 1 mass% lactic acid solution as functions of the cycle numbers. The arrowheads in these figures indicate that the ion concentration was below the ICP-AES detection limit considered in this study. The concen-trations of Nb and Zr ions eluted from the Ti-14Mo-3Nb-1.5Zr alloy wires and Ti and Zr ions eluted from the Ti-10Zr alloy wire were less than 102mass ppm. Although the concentration of Ti and Mo ions eluted from the
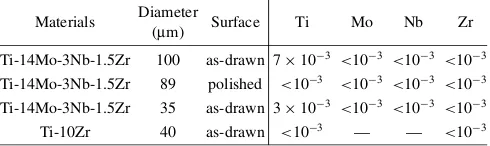
Ti-14Mo-3Nb-1.5Zr alloy wires increased with an increase in the duration of fatigue testing, the total elution of metallic ions was suppressed to less than 101mass ppm. It appears that surface polishing causes a decrease in the elution of Ti and Mo ions for short cycles of fatigue testing of Ti-14Mo-3Nb-1.5Zr alloy wires. Table 2 summarizes the concentrations of metallic ions eluted from the 14Mo-3Nb-1.5Zr and Ti-10Zr alloy wires during the static immersion test in 1 mass% lactic acid solution for 600 ks. The elution of metallic ions in the static immersion test was less than that in fatigue testing. These results suggest that the new surface formed by crack propagation causes the elution of Ti and Mo ions from the titanium wires, though the extent of elution is small.
4. Conclusions
Fatigue behaviors of ultra fine wires of-type Ti-14Mo-3Nb-1.5Zr alloy and -type Ti-10Zr alloy and -type CP titanium with diameters in the range of 35–100mm were investigated by rotating-bending fatigue testing in 1 mass% lactic acid solution maintained at 310 K. The following are the findings of the investigation.
(1) The-type Ti-14Mo-3Nb-1.5Zr alloy wires showed a clear fatigue limit independent of the surface roughness and wire diameter. On the other hand, the -type Ti-10Zr alloy wire and -type CP titanium wire did not show a clear fatigue limit, and their fatigue strengths gradually decreased with decreasing maximum bending stress. The difference in crystal structures of- and -type titanium alloys might be the cause of the difference in shapes of the fatigue curves of these wires in rotating-bending fatigue testing.
(2) The fracture surface consisted of a fatigue crack propagation region and a final overload region. The crack origin was observed at the edges of the fracture surfaces. Surface defects that were introduced during the cold drawing process might act as crack origins of the fatigue fracture.
(3) The ratio of the fatigue limit to the tensile strength of the titanium wires with as-drawn surfaces was less than 0.5, while that of the titanium wire with a polished surface was greater than 0.5. Surface polishing could cause a decrease in the number and size of surface 0
150 200 250 300
Vickers Hardness / Hv
350
0.2 0.4
Measurement position, d 0.6 0.8 1.0
R r (a) 0 150 200 250 300
Vickers Hardness / Hv
350
0.2 0.4
Measurement position, d 0.6 0.8 1.0 (b) 0 150 200 250 300
Vickers Hardness / Hv
350
0.2 0.4
Measurement position, d 0.6 0.8 1.0 (c)
: Ti-14Mo-3Nb-1.5Zr, φ = 100 µm, as-drawn
: Ti-14Mo-3Nb-1.5Zr, φ = 89 µm, polished
: Ti-14Mo-3Nb-1.5Zr, φ = 35 µm, as-drawn : Ti-10Zr, φ = 40 µm, as-drawn
: CP-Ti, φ = 50 µm, as-drawn
Fig. 6 Hardness distributions of cross sections of (a)-type titanium wires, (b)-type Ti-10Zr alloy wire and (c)-type CP titanium wire before fatigue testing. Here, d is defined as r/R, where r and R are the distances of the measurement position from the outer surface and radius of the wire, respectively.
0 0 100 200 300 400 500 600 700 200
Tensile strength,σu / MPa
Fatigue limit,
σf
/ MPa
400 600 800 1000 1200 1400
0.25 0.5 0.7 : Ti-10Zr
φ = 40 µm, as-drawn : CP-Ti, φ = 50 µm as-drawn : Ti-14Mo-3Nb-1.5Zr
φ = 100 µm, as-drawn : Ti-14Mo-3Nb-1.5Zr
φ = 89 µm, polished : Ti-14Mo-3Nb-1.5Zr
φ = 35 µm, as-drawn
Fig. 7 Relationship between tensile strength and fatigue limit of titanium wires.
[image:5.595.86.512.72.216.2] [image:5.595.56.281.278.490.2]103
Number of cycles to failure, Nf
Concentration of titanium ion,
CTi
/ mass ppm
10-3
10-2
10-1
104 105 106 107 108
(a)
103
Number of cycles to failure, Nf
Concentration of molybdenum ion,
C
Mo
/ mass ppm
10-3
10-2
10-1
104 105 106 107 108
(b)
103
Number of cycles to failure, Nf
Concentration of niobium ion,
CNb
/ mass ppm
10-3
10-2
10-1
104 105 106 107 108
(c)
103
Number of cycles to failure, Nf
Concentration of zirconium ion,
CZr
/ mass ppm
10-3
10-2
10-1
104 105 106 107 108
(d) : Ti-14Mo-3Nb-1.5Zr
φ = 100 µm, as-drawn : Ti-14Mo-3Nb-1.5Zr
φ = 89 µm, polished : Ti-14Mo-3Nb-1.5Zr
φ = 35 µm, as-drawn
: Ti-14Mo-3Nb-1.5Zr φ = 100 µm, as-drawn : Ti-14Mo-3Nb-1.5Zr
φ = 89 µm, polished : Ti-14Mo-3Nb-1.5Zr φ = 35 µm, as-drawn
: Ti-14Mo-3Nb-1.5Zr φ = 100 µm, as-drawn : Ti-14Mo-3Nb-1.5Zr
φ = 89 µm, polished : Ti-14Mo-3Nb-1.5Zr φ = 35 µm, as-drawn
: Ti-14Mo-3Nb-1.5Zr φ = 100 µm, as-drawn : Ti-14Mo-3Nb-1.5Zr
φ = 89 µm, polished : Ti-14Mo-3Nb-1.5Zr φ = 35 µm, as-drawn
Fig. 8 Changes in concentrations of (a) titanium, (b) molybdenum, (c) niobium and (d) zirconium ions eluted from-type Ti-14Mo-3Nb-1.5Zr alloy wires during fatigue testing.
103
Number of cycles to failure, Nf
Concentration of titanium ion,
C
Ti
/ mass ppm
10-3
10-2
10-1
104 105 106 107 108 (a)
103
Number of cycles to failure, Nf
Concentration of zirconium ion,
CZr
/ mass ppm
10-3
10-2
10-1
104 105 106 107 108 (b)
: Ti-10Zr, φ = 40 µm, as-drawn : Ti-10Zr, φ = 40 µm, as-drawn
[image:6.595.88.512.70.506.2] [image:6.595.115.481.588.769.2]defects and might bring about an improvement in the fatigue properties of the titanium wires.
(4) The metallic ions were suggested to have been eluted from the new surface formed by crack propagation during fatigue testing. However, due to the high corrosion resistance of the titanium wires, their elution into 1 mass% lactic acid solution was suppressed at a very low level.
Acknowledgements
The authors would like to express their thanks to Hiyama Rare-Metal Industry for supplying the Ti-10Zr alloy wire used in fatigue testing. This work was financially supported by The Light Metal Educational Foundation, Inc., the Special Education and Research Program ‘‘Highly-functional Inter-face Science: Innovation of Biomaterials with Highly Func-tional Interface to Host and Parasite’’ by the JSPS and a Grant-in-Aid for Scientific Research from the Ministry of
Education, Culture, Sports, Science and Technology, Japan, under Contract No. 19360324.
REFERENCES
1) A. Scheiner, G. Polando and E. B. Marsolais: IEEE Trans. Biomed. Eng.41(1994) 425–431.
2) Y. Handa, N. Hoshimiya, Y. Iguchi and T. Oda: IEEE Trans. Biomed. Eng.36(1989) 705–710.
3) T. Narushima, K. Suzuki, T. Murakami, C. Ouchi and Y. Iguchi: Mater. Trans.46(2005) 2083–2088.
4) N. Hoshimiya, H. Higa, T. Watanabe, H. Murakami, R. Futami, H. Matsuki, Y. Iguchi, Y. Handa, K. Takahashi, T. Furukawa, Y.
Ogasawara and T. Shimotomai: Med. Biolo. Eng. Comp.34Supp. 1
Pt.2 (1996) 281–282.
5) M. Niinomi, T. Hanawa and T. Narushima: JOM J. Miner. Met. Mater. Soc.57[4] (2005) 18–24.
6) K. Taneichi, M. Taira, E. Sukedai, T. Narushima, Y. Iguchi and C. Ouchi: ISIJ International46(2006) 292–301.
7) M. Kato, H. Abe, M. Saka, M. Kurashige, K. Ito and Y. Shindo:
Mechanics of Materials, (Asakura Publishing, Tokyo, 1988) pp. 69–70.
8) T. Nishimura: Process Technology in Titanium, (Nikkan Kogyo
Shinbun, Tokyo, 1992) p. 9.
9) C. R. Brooks and A. Choudhury: Metallurgical Failure Analysis,
(McGraw-Hill, NY, 1993) p. 232.
10) S. Nishijima and K. Kanazawa: Fatigue Fract. Engng. Mater. Struct.22
(1999) 601–607.
11) S. J. Li, M. Niinomi, T. Akahori, T. Kasuga and Y. L. Hao: Biomaterials25(2004) 3369–3378.
12) Y. Ono, T. Yuri, H. Sumiyoshi, S. Matsuoka and T. Ogata: Cryogenics
44(2003) 483–489.
13) K. Nakajima, K. Terao and T. Miyata: Mat. Sci. Eng. A243(1998)
176–181.
14) Drawing: from fundamentals to up-to-date techniques, (Corona Pub-lishing, Tokyo, 1990) p. 82.
[image:7.595.47.292.106.179.2]15) Fatigue Design Handbook, (Yokendo, Tokyo, 1995) p. 10. Table 2 Concentration of metallic ions (mass ppm) eluted from
Ti-14Mo-3Nb-1.5Zr and Ti-10Zr wires during static immersion test in 1 mass% lactic acid solution for 600 ks.
Materials Diameter
(mm) Surface Ti Mo Nb Zr
Ti-14Mo-3Nb-1.5Zr 100 as-drawn 7103 <103 <103 <103
Ti-14Mo-3Nb-1.5Zr 89 polished <103 <103 <103 <103
Ti-14Mo-3Nb-1.5Zr 35 as-drawn 3103 <103 <103 <103
Ti-10Zr 40 as-drawn <103 — — <103