A Cognitive Cost Model of Annotations Based on Eye-Tracking Data
Katrin Tomanek Language & Information
Engineering (JULIE) Lab
Universit¨at Jena
Jena, Germany
Udo Hahn Language & Information
Engineering (JULIE) Lab
Universit¨at Jena
Jena, Germany
Steffen Lohmann Dept. of Computer Science &
Applied Cognitive Science
Universit¨at Duisburg-Essen
Duisburg, Germany
J ¨urgen Ziegler Dept. of Computer Science &
Applied Cognitive Science
Universit¨at Duisburg-Essen
Duisburg, Germany
Abstract
We report on an experiment to track com-plex decision points in linguistic meta-data annotation where the decision behav-ior of annotators is observed with an eye-tracking device. As experimental con-ditions we investigate different forms of textual context and linguistic complexity classes relative to syntax and semantics. Our data renders evidence that annotation performance depends on the semantic and syntactic complexity of the decision points and, more interestingly, indicates that full-scale context is mostly negligible – with the exception of semantic high-complexity cases. We then induce from this obser-vational data a cognitively grounded cost model of linguistic meta-data annotations and compare it with existing non-cognitive models. Our data reveals that the cogni-tively founded model explains annotation costs (expressed in annotation time) more adequately than non-cognitive ones.
1 Introduction
Today’s NLP systems, in particular those rely-ing on supervised ML approaches, are meta-data greedy. Accordingly, in the past years, we have witnessed a massive quantitative growth of anno-tated corpora. They differ in terms of the nat-ural languages and domains being covered, the types of linguistic meta-data being solicited, and the text genres being served. We have seen large-scale efforts in syntactic and semantic annotations in the past related to POS tagging and parsing, on the one hand, and named entities and rela-tions (proposirela-tions), on the other hand. More re-cently, we are dealing with even more challeng-ing issues such as subjective language, a large variety of co-reference and (e.g., RST-style) text
structure phenomena, Since the NLP community is further extending their work into these more and more sophisticated semantic and pragmatic analyt-ics, there seems to be no end in sight for increas-ingly complex and diverse annotation tasks.
Yet, producing annotations is pretty expensive. So the question comes up, how we can rationally manage these investments so that annotation cam-paigns are economically doable without loss in an-notation quality. The economics of anan-notations are at the core of Active Learning (AL) where those linguistic samples are focused on in the entire doc-ument collection, which are estimated as being most informative to learn an effective classifica-tion model (Cohn et al., 1996). This intenclassifica-tional selection bias stands in stark contrast to prevailing sampling approaches where annotation examples are randomly chosen.
When different approaches to AL are compared with each other, or with standard random sam-pling, in terms of annotation efficiency, up until now, the AL community assumed uniform annota-tion costs for each linguistic unit, e.g. words. This claim, however, has been shown to be invalid in several studies (Hachey et al., 2005; Settles et al., 2008; Tomanek and Hahn, 2010). If uniformity does not hold and, hence, the number of annotated units does not indicate the true annotation efforts required for a specific sample, empirically more adequate cost models are needed.
Building predictive models for annotation costs has only been addressed in few studies for now (Ringger et al., 2008; Settles et al., 2008; Arora et al., 2009). The proposed models are based on easy-to-determine, yet not so explanatory vari-ables (such as the number of words to be tated), indicating that accurate models of anno-tation costs remain a desideratum. We here, al-ternatively, consider different classes of syntac-tic and semansyntac-tic complexity that might affect the cognitive load during the annotation process, with
the overall goal to find additional and empirically more adequate variables for cost modeling.
The complexity of linguistic utterances can be judged either by structural or by behavioral crite-ria. Structural complexity emerges, e.g., from the static topology of phrase structure trees and pro-cedural graph traversals exploiting the topology of parse trees (see Szmrecs´anyi (2004) or Cheung and Kemper (1992) for a survey of metrics of this type). However, structural complexity criteria do not translate directly into empirically justified cost measures and thus have to be taken with care.
The behavioral approach accounts for this prob-lem as it renders observational data of the an-notators’ eye movements. The technical vehicle to gather such data are eye-trackers which have already been used in psycholinguistics (Rayner, 1998). Eye-trackers were able to reveal, e.g., how subjects deal with ambiguities (Frazier and Rayner, 1987; Rayner et al., 2006; Traxler and Frazier, 2008) or with sentences which require re-analysis, so-called garden path sentences (Alt-mann et al., 2007; Sturt, 2007).
The rationale behind the use of eye-tracking de-vices for the observation of annotation behavior is that the length of gaze durations and behavioral patterns underlying gaze movements are consid-ered to be indicative of the hardness of the lin-guistic analysis and the expenditures for the search of clarifying linguistic evidence (anchor words) to resolve hard decision tasks such as phrase attach-ments or word sense disambiguation. Gaze dura-tion and search time are then taken as empirical correlates of linguistic complexity and, hence, un-cover the real costs. We therefore consider eye-tracking as a promising means to get a better un-derstanding of the nature of the linguistic annota-tion processes with the ultimate goal of identifying predictive factors for annotation cost models.
In this paper, we first describe an empirical study where we observed the annotators’ reading behavior while annotating a corpus. Section 2 deals with the design of the study, Section 3 dis-cusses its results. In Section 4 we then focus on the implications this study has on building cost models and compare a simple cost model mainly relying on word and character counts and addi-tional simple descriptive characteristics with one that can be derived from experimental data as pro-vided from eye-tracking. We conclude with ex-periments which reveal that cognitively grounded
models outperform simpler ones relative to cost prediction using annotation time as a cost mea-sure. Based on this finding, we suggest that cog-nitive criteria are helpful for uncovering the real costs of corpus annotation.
2 Experimental Design
In our study, we applied, for the first time ever to the best of our knowledge, eye-tracking to study the cognitive processes underlying the annotation of linguistic meta-data, named entities in particu-lar. In this task, a human annotator has to decide for each word whether or not it belongs to one of the entity types of interest.
We used the English part of the MUC7 corpus (Linguistic Data Consortium, 2001) for our study. It contains New York Times articles from 1996 re-porting on plane crashes. These articles come al-ready annotated with three types of named entities considered important in the newspaper domain,
viz. “persons”, “locations”, and “organizations”.
Annotation of these entity types in newspaper articles is admittedly fairly easy. We chose this rather simple setting because the participants in the experiment had no previous experience with document annotation and no serious linguistic background. Moreover, the limited number of entity types reduced the amount of participants’ training prior to the actual experiment, and posi-tively affected the design and handling of the ex-perimental apparatus (see below).
We triggered the annotation processes by giving our participants specific annotation examples. An example consists of a text document having one single annotation phrase highlighted which then had to be semantically annotated with respect to named entity mentions. The annotation task was defined such that the correct entity type had to be assigned to each word in the annotation phrase. If a word belongs to none of the three entity types a fourth class called “no entity” had to be assigned.
The phrases highlighted for annotation were
complex noun phrases (CNPs), each a sequence of
their syntactic host structure and the intervening linguistic material containing these structures was deleted to simplify overly long sentences. We also discarded all CNPs that did not contain at least one entity-critical word, i.e., one which might be a named entity according to its orthographic appear-ance (e.g., starting with an upper-case letter). It should be noted that such orthographic signals are by no means a sufficient condition for the presence of a named entity mention within a CNP.
The choice of CNPs as stimulus phrases is mo-tivated by the fact that named entities are usually fully encoded by this kind of linguistic structure. The chosen stimulus – an annotation example with one phrase highlighted for annotation – allows for an exact localization of the cognitive processes and annotation actions performed relative to that specific phrase.
2.1 Independent Variables
We defined two measures for the complexity of the annotation examples: The syntactic complex-ity was given by the number of nodes in the con-stituent parse tree which are dominated by the an-notation phrase (Szmrecs´anyi, 2004).1 According to a threshold on the number of nodes in such a parse tree, we classified CNPs as having either high or low syntactic complexity.
The semantic complexity of an annotation ex-ample is based on the inverse document frequency
df of the words in the annotation phrase according to a reference corpus.2 We calculated the seman-tic complexity score of an annotation phrase as
maxidf(1w
i), wherewiis thei-th word of the anno-tation phrase. Again, we empirically determined a threshold classifying annotation phrases as having either high or low semantic complexity. Addition-ally, this automatically generated classification was manually checked and, if necessary, revised by two annotation experts. For instance, if an an-notation phrase contained a strong trigger (e.g., a social role or job title, as with “spokeswoman” in the annotation phrase “spokeswoman Arlene”), it was classified as a low-semantic-complexity item even though it might have been assigned a high inverse document frequency (due to the infrequent word “Arlene”).
1
Constituency parse structure was obtained from the OPENNLP parser (http://opennlp.sourceforge. net/) trained on PennTreeBank data.
2We chose the English part of the Reuters RCV2 corpus
as the reference corpus for our experiments.
Two experimental groups were formed to study different contexts. In the document context con-dition the whole newspaper article was shown as annotation example, while in the sentence context condition only the sentence containing the annota-tion phrase was presented. The participants3were randomly assigned to one of these groups. We de-cided for this between-subjects design to avoid any irritation of the participants caused by constantly changing contexts. Accordingly, the participants were assigned to one of the experimental groups and corresponding context condition already in the second training phase that took place shortly be-fore the experiment started (see below).
2.2 Hypotheses and Dependent Variables
We tested the following two hypotheses:
Hypothesis H1: Annotators perform differently in the two context conditions.
H1 is based on the linguistically plausible assumption that annotators are expected to make heavy use of the surrounding context because such context could be helpful for the correct disambiguation of entity classes. Ac-cordingly, lacking context, an annotator is ex-pected to annotate worse than under the con-dition of full context. However, the availabil-ity of (too much) context might overload and distract annotators, with a presumably nega-tive effect on annotation performance.
Hypothesis H2: The complexity of the annota-tion phrases determines the annotaannota-tion per-formance.
The assumption is that high syntactic or se-mantic complexity significantly lowers the annotation performance.
In order to test these hypotheses we collected data for the following dependent variables: (a) the an-notation accuracy – we identified erroneous enti-ties by comparison with the original gold annota-tions in the MUC7 corpus, (b) the time needed per annotation example, and (c) the distribution and duration of the participants’ eye gazes.
3
2.3 Stimulus Material
According to the above definition of complity, we automatically preselected annotation ex-amples characterized by either a low or a high de-gree of semantic and syntactic complexity. After manual fine-tuning of the example set assuring an even distribution of entity types and syntactic cor-rectness of the automatically derived annotation phrases, we finally selected 80 annotation exam-ples for the experiment. These were divided into four subsets of 20 examples each falling into one of the following complexity classes:
sem-syn: low semantic/low syntactic complexity SEM-syn: high semantic/low syntactic complexity sem-SYN: low semantic/high syntactic complexity SEM-SYN: high semantic/high syntactic complexity
2.4 Experimental Apparatus and Procedure
The annotation examples were presented in a custom-built tool and its user interface was kept as simple as possible not to distract the eye move-ments of the participants. It merely contained one frame showing the text of the annotation example, with the annotation phrase being highlighted. A blank screen was shown after each annotation ex-ample to reset the eyes and to allow a break, if needed. The time the blank screen was shown was not counted as annotation time. The 80 annotation examples were presented to all participants in the same randomized order, with a balanced distribu-tion of the complexity classes. A variadistribu-tion of the order was hardly possible for technical and ana-lytical reasons but is not considered critical due to extensive, pre-experimental training (see below). The limitation on 80 annotation examples reduces the chances of errors due to fatigue or lack of at-tention that can be observed in long-lasting anno-tation activities.
Five introductory examples (not considered in the final evaluation) were given to get the subjects used to the experimental environment. All anno-tation examples were chosen in a way that they completely fitted on the screen (i.e., text length was limited) to avoid the need for scrolling (and eye distraction). The position of the CNP within the respective context was randomly distributed, excluding the first and last sentence.
The participants used a standard keyboard to as-sign the entity types for each word of the annota-tion example. All but 5 keys were removed from the keyboard to avoid extra eye movements for
fin-ger coordination (three keys for the positive en-tity classes, one for the negative “no enen-tity” class, and one to confirm the annotation). Pre-tests had shown that the participants could easily issue the annotations without looking down at the keyboard. We recorded the participant’s eye movements on a Tobii T60 eye-tracking device which is in-visibly embedded in a 17” TFT monitor and com-paratively tolerant to head movements. The partic-ipants were seated in a comfortable position with their head in a distance of 60-70 cm from the mon-itor. Screen resolution was set to 1280 x 1024 px and the annotation examples were presented in the middle of the screen in a font size of 16 px and a line spacing of 5 px. The presentation area had no fixed height and varied depending on the context condition and length of the newspaper article. The text was always vertically centered on the screen.
All participants were familiarized with the annotation task and the guidelines in a pre-experimental workshop where they practiced an-notations on various exercise examples (about 60 minutes). During the next two days, one after the other participated in the actual experiment which took between 15 and 30 minutes, including cali-bration of the eye-tracking device. Another 20-30 minutes of training time directly preceded the ex-periment. After the experiment, participants were interviewed and asked to fill out a questionnaire. Overall, the experiment took about two hours for each participant for which they were financially compensated. Participants were instructed to fo-cus more on annotation accuracy than on annota-tion time as we wanted to avoid random guess-ing. Accordingly, as an extra incentive, we re-warded the three participants with the highest an-notation accuracy with cinema vouchers. None of the participants reported serious difficulties with the newspaper articles or annotation tool and all understood the annotation task very well.
3 Results
We used a mixed-design analysis of variance (ANOVA) model to test the hypotheses, with the context condition as between-subjects factor and the two complexity classes as within-subject fac-tors.
3.1 Testing Context Conditions
above before anno phrase after below
percentage of participants looking at a sub-area 35% 32% 100% 34% 16%
average number of fixations per sub-area 2.2 14.1 1.3
Table 1: Distribution of annotators’ attention among sub-areas per annotation example.
by the annotators in the two contextual conditions (complete document vs. sentence). Surprisingly, on the total of 174 entity-critical words within the 80 annotation examples, we found exactly the same mean value of 30.8 errors per participant in both conditions. There were also no significant differences in the average time needed to annotate an example in both conditions (means of 9.2 and 8.6 seconds, respectively, withF(1,18) = 0.116, p = 0.74).4 These results seem to suggest that it makes no difference (neither for annotation accu-racy nor for time) whether or not annotators are shown textual context beyond the sentence that contains the annotation phrase.
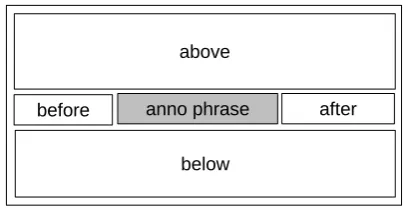
[image:5.595.79.284.525.629.2]To further investigate this finding we analyzed eye-tracking data of the participants gathered for the document context condition. We divided the whole text area into five sub-areas as schemat-ically shown in Figure 1. We then determined the average proportion of participants that directed their gaze at least once at these sub-areas. We con-sidered all fixations with a minimum duration of 100 ms, using a fixation radius (i.e., the smallest distance that separates fixations) of 30 px and ex-cluded the first second (mainly used for orientation and identification of the annotation phrase).
Figure 1: Schematic visualization of the sub-areas of an annotation example.
Table 1 reveals that on average only 35% of the
4In general, we observed a high variance in the number of
errors and time values between the subjects. While, e.g., the fastest participant handled an example in 3.6 seconds on the average, the slowest one needed 18.9 seconds; concerning the annotation errors on the 174 entity-critical words, these ranged between 21 and 46 errors.
participants looked in the textual context above the annotation phrase embedding sentence, and even less perceived the context below (16%). The sen-tence parts before and after the annotation phrase were, on the average, visited by one third (32% and 34%, respectively) of the participants. The uneven distribution of the annotators’ attention be-comes even more apparent in a comparison of the total number of fixations on the different text parts: 14 out of an average of 18 fixations per example were directed at the annotation phrase and the sur-rounding sentence, the text context above the an-notation chunk received only 2.2 fixations on the average and the text context below only 1.3.
Thus, the eye-tracking data indicates that the textual context is not as important as might have been expected for quick and accurate annotation. This result can be explained by the fact that par-ticipants of the document-context condition used the context whenever they thought it might help, whereas participants of the sentence-context con-dition spent more time thinking about a correct an-swer, overall with the same result.
3.2 Testing Complexity Classes
To test hypothesis H2 we also compared the av-erage annotation time and the number of errors on entity-critical words for the complexity subsets (see Table 2). The ANOVA results show highly significant differences for both annotation time and errors.5 A pairwise comparison of all sub-sets in both conditions with at-test showed non-significant results only between the SEM-syn and syn-SEM subsets.6
Thus, the empirical data generally supports hy-pothesis H2 in that the annotation performance seems to correlate with the complexity of the an-notation phrase, on the average.
5Annotation time results: F(1,18) = 25,p < 0.01for
the semantic complexity andF(1,18) = 76.5, p < 0.01 for the syntactic complexity; Annotation complexity results:
F(1,18) = 48.7,p <0.01for the semantic complexity and
F(1,18) = 184,p <0.01for the syntactic complexity.
6t(9) = 0.27, p = 0.79for the annotation time in the
experimental complexity e.-c. time errors condition class words mean SD mean SD rate
[image:6.595.137.462.47.189.2]sem-syn 36 4.0s 2.0 2.7 2.1 .075 document SEM-syn 25 9.2s 6.7 5.1 1.4 .204 condition sem-SYN 51 9.6s 4.0 9.1 2.9 .178 SEM-SYN 62 14.2s 9.5 13.9 4.5 .224 sem-syn 36 3.9s 1.3 1.1 1.4 .031 sentence SEM-syn 25 7.5s 2.8 6.2 1.9 .248 condition sem-SYN 51 9.6s 2.8 9.0 3.9 .176 SEM-SYN 62 13.5s 5.0 14.5 3.4 .234
Table 2: Average performance values for the 10 subjects of each experimental condition and 20 anno-tation examples of each complexity class: number of entity-critical words, mean annoanno-tation time and standard deviations (SD), mean annotation errors, standard deviations, and error rates (number of errors divided by number of entity-critical words).
3.3 Context and Complexity
We also examined whether the need for inspect-ing the context increases with the complexity of the annotation phrase. Therefore, we analyzed the eye-tracking data in terms of the average num-ber of fixations on the annotation phrase and on its embedding contexts for each complexity class (see Table 3). The values illustrate that while the number of fixations on the annotation phrase rises generally with both the semantic and the syntactic complexity, the number of fixations on the context rises only with semantic complexity. The num-ber of fixations on the context is nearly the same for the two subsets with low semantic complexity (sem-syn and sem-SYN, with 1.0 and 1.5), while it is significantly higher for the two subsets with high semantic complexity (5.6 and 5.0), indepen-dent of the syntactic complexity.7
complexity fix. on phrase fix. on context class mean SD mean SD
sem-syn 4.9 4.0 1.0 2.9 SEM-syn 8.1 5.4 5.6 5.6 sem-SYN 18.1 7.7 1.5 2.0 SEM-SYN 25.4 9.3 5.0 4.1
Table 3: Average number of fixations on the anno-tation phrase and context for the document condi-tion and 20 annotacondi-tion examples of each complex-ity class.
These results suggest that the need for context mainly depends on the semantic complexity of the annotation phrase, while it is less influenced by its syntactic complexity.
7ANOVA result ofF(1,19) = 19.7,p < 0.01and
sig-nificant differences also in all pairwise comparisons.
[image:6.595.312.527.254.411.2]phrase antecedent
Figure 2: Annotation example with annotation phrase and the antecedent for “Roselawn” in the text (left), and gaze plot of one participant show-ing a scannshow-ing-for-coreference behavior (right).
[image:6.595.75.287.526.612.2]4 Cognitively Grounded Cost Modeling
We now discuss whether the findings on dependent variables from our eye-tracking study are fruitful for actually modeling annotation costs. There-fore, we learn a linear regression model with time (an operationalization of annotation costs) as the dependent variable. We compare our ‘cognitive’ model against a baseline model which relies on some simple formal text features only, and test whether the newly introduced features help predict annotation costs more accurately.
4.1 Features
The features for the baseline model, character- and word-based, are similar to the ones used by Ring-ger et al. (2008) and Settles et al. (2008).8 Our
cognitive model, however, makes additional use of features based on linguistic complexity, and in-cludes syntactic and semantic criteria related to the annotation phrases. These features were inspired by the insights provided by our eye-tracking ex-periments. All features are designed such that they can automatically be derived from unlabeled data, a necessary condition for such features to be prac-tically applicable.
To account for our findings that syntactic and semantic complexity correlates with annotation performance, we added three features based on syntactic, and two based on semantic complex-ity measures. We decided for the use of multiple measures because there is no single agreed-upon metric for either syntactic or semantic complex-ity. This decision is further motivated by find-ings which reveal that different measures are often complementary to each other so that their combi-nation better approximates the inherent degrees of complexity (Roark et al., 2007).
As for syntactic complexity, we use two mea-sures based on structural complexity including (a) the number of nodes of a constituency parse tree which are dominated by the annotation phrase (cf. Section 2.1), and (b) given the dependency graph of the sentence embedding the annotation phrase, we consider the distance between words for each dependency link within the annotation phrase and consider the maximum over such
dis-8In preliminary experiments our set of basic features
com-prised additional features providing information on the usage of stop words in the annotation phrase and on the number of paragraphs, sentences, and words in the respective annota-tion example. However, since we found these features did not have any significant impact on the model, we removed them.
tance values as another metric for syntactic com-plexity. Lin (1996) has already shown that human performance on sentence processing tasks can be predicted using such a measure. Our third syn-tactic complexity measure is based on the prob-ability of part-of-speech (POS) 2-grams. Given a POS 2-gram model, which we learned from the automatically POS-tagged MUC7 corpus, the complexity of an annotation phrase is defined by
Pn
i=2P(POSi|POSi−1) where POSi refers to the
POS-tag of thei-th word of the annotation phrase. A similar measure has been used by Roark et al. (2007) who claim that complex syntactic struc-tures correlate with infrequent or surprising com-binations of POS tags.
As far as the quantification of semantic com-plexity is concerned, we use (a) the inverse docu-ment frequencydf(wi)of each wordwi (cf.
Sec-tion 2.1), and a measure based on the semantic ambiguity of each word, i.e., the number of mean-ings contained in WORDNET,9 within an annota-tion phrase. We consider the maximum ambigu-ity of the words within the annotation phrase as the overall ambiguity of the respective annotation phrase. This measure is based on the assumption that annotation phrases with higher semantic am-biguity are harder to annotate than low-amam-biguity ones. Finally, we add the Flesch-Kincaid Read-ability Score (Klare, 1963), a well-known metric for estimating the comprehensibility and reading complexity of texts.
As already indicated, some of the hardness of annotations is due to tracking co-references and abbreviations. Both often cannot be resolved lo-cally so that annotators need to consult the con-text of an annotation chunk (cf. Section 3.3). Thus, we also added features providing informa-tion whether the annotainforma-tion phrases contain entity-critical words which may denote the referent of an antecedent of an anaphoric relation. In the same vein, we checked whether an annotation phrase contains expressions which can function as an ab-breviation by virtue of their orthographical appear-ance, e.g., consist of at least two upper-case letters. Since our participants were sometimes scanning for entity-critical words, we also added features providing information on the number of entity-critical words within the annotation phrase. Ta-ble 4 enumerates all feature classes and single fea-tures used for determining our cost model.
Feature Group # Features Feature Description
characters (basic) 6 number of characters and words per annotation phrase; test whether words in a phrase start with capital letters, consist of capital letters only, have alphanumeric characters, or are punctuation symbols
words 2 number of entity-critical words and percentage of entity-critical words in the annotation phrase
complexity 6 syntactic complexity: number of dominated nodes, POS n-gram proba-bility, maximum dependency distance;
semantic complexity: inverse document frequency, max. ambiguity; general linguistic complexity: Flesch-Kincaid Readability Score
[image:8.595.60.526.68.268.2]semantics 3 test whether entity-critical word in annotation phrase is used in docu-ment (preceding or following current phrase); test whether phrase con-tains an abbreviation
Table 4: Features for cost modeling.
4.2 Evaluation
To test how well annotation costs can be mod-eled by the features described above, we used the MUC7T corpus, a re-annotation of the MUC7
cor-pus (Tomanek and Hahn, 2010). MUC7T has time
tags attached to the sentences and CNPs. These time tags indicate the time it took to annotate the respective phrase for named entity mentions of the types person, location, and organization. We here made use of the time tags of the 15,203 CNPs in MUC7T. MUC7T has been annotated by two
an-notators (henceforth called A and B) and so we evaluated the cost models for both annotators. We learned a simple linear regression model with the annotation time as dependent variable and the fea-tures described above as independent variables. The baseline model only includes the basic feature set, whereas the ‘cognitive’ model incorporates all features described above.
Table 5 depicts the performance of both mod-els induced from the data of annotator A and B. The coefficient of determination (R2) describes the proportion of the variance of the dependent variable that can be described by the given model. We report adjustedR2to account for the different numbers of features used in both models.
model R2on A’s data R2on B’s data
baseline 0.4695 0.4640 cognitive 0.6263 0.6185
Table 5: AdjustedR2 values on both models and for annotators A and B.
For both annotators, the baseline model is sig-nificantly outperformed in terms of R2 by our ‘cognitive’ model (p < 0.05). Considering the features that were inspired from the eye-tracking study, R2 is increased from0.4695to0.6263on the timing data of annotator A, and from0.464to
0.6185on the data of annotator B. These numbers clearly demonstrate that annotation costs are more adequately modelled by the additional features we identified through our eye-tracking study.
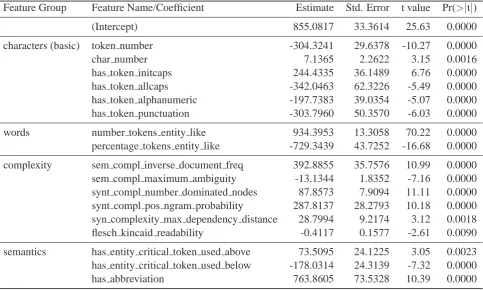
Our ‘cognitive’ model now consists of 21 co-efficients. We tested for the significance of this model’s regression terms. For annotator A we found all coefficients to be significant with respect to the model (p <0.05), for annotator B all coeffi-cients except one were significant. Figure 6 shows the coefficients of annotator A’s ‘cognitive’ model along with the standard errors and t-values.
5 Summary and Conclusions
Feature Group Feature Name/Coefficient Estimate Std. Error t value Pr(>|t|)
(Intercept) 855.0817 33.3614 25.63 0.0000
characters (basic) token number -304.3241 29.6378 -10.27 0.0000
char number 7.1365 2.2622 3.15 0.0016
has token initcaps 244.4335 36.1489 6.76 0.0000 has token allcaps -342.0463 62.3226 -5.49 0.0000 has token alphanumeric -197.7383 39.0354 -5.07 0.0000 has token punctuation -303.7960 50.3570 -6.03 0.0000
words number tokens entity like 934.3953 13.3058 70.22 0.0000 percentage tokens entity like -729.3439 43.7252 -16.68 0.0000
complexity sem compl inverse document freq 392.8855 35.7576 10.99 0.0000 sem compl maximum ambiguity -13.1344 1.8352 -7.16 0.0000 synt compl number dominated nodes 87.8573 7.9094 11.11 0.0000 synt compl pos ngram probability 287.8137 28.2793 10.18 0.0000 syn complexity max dependency distance 28.7994 9.2174 3.12 0.0018 flesch kincaid readability -0.4117 0.1577 -2.61 0.0090
[image:9.595.57.541.65.355.2]semantics has entity critical token used above 73.5095 24.1225 3.05 0.0023 has entity critical token used below -178.0314 24.3139 -7.32 0.0000 has abbreviation 763.8605 73.5328 10.39 0.0000
Table 6: ‘Cognitive’ model of annotator A.
the exception of tackling high-complexity semtic cases and resolving co-references) and that an-notation performance correlates with semantic and syntactic complexity.
The results of these experiments were taken as a heuristic clue to focus on cognitively plausi-ble features of learning empirically rooted cost models for annotation. We compared a simple cost model (basically taking the number of words and characters into account) with a cognitively grounded model and got a much higher fit for the cognitive model when we compared cost predic-tions of both model classes on the recently re-leased time-stamped version of the MUC7 corpus.
We here want to stress the role of cognitive evi-dence from eye-tracking to determine empirically
relevant features for the cost model. The
alterna-tive, more or less mechanical feature engineering, suffers from the shortcoming that is has to deal with large amounts of (mostly irrelevant) features – a procedure which not only requires increased amounts of training data but also is often compu-tationally very expensive.
Instead, our approach introduces empirical, theory-driven relevance criteria into the feature selection process. Trying to relate observables
of complex cognitive tasks (such as gaze dura-tion and gaze movements for named entity anno-tation) to explanatory models (in our case, a time-based cost model for annotation) follows a much warranted avenue in research in NLP where fea-ture farming becomes a theory-driven, explanatory process rather than a much deplored theory-blind engineering activity (cf. ACL-WS-2005 (2005)).
In this spirit, our focus has not been on fine-tuning this cognitive cost model to achieve even higher fits with the time data. Instead, we aimed at testing whether the findings from our eye-tracking study can be exploited to model annotation costs more accurately.
References
ACL-WS-2005. 2005. Proceedings of the ACL
Work-shop on Feature Engineering for Machine
Learn-ing in Natural Language ProcessLearn-ing. accessible
via http://www.aclweb.org/anthology/
W/W05/W05-0400.pdf.
Gerry Altmann, Alan Garnham, and Yvette Dennis. 2007. Avoiding the garden path: Eye movements in context. Journal of Memory and Language,
31(2):685–712.
Shilpa Arora, Eric Nyberg, and Carolyn Ros´e. 2009. Estimating annotation cost for active learning in a multi-annotator environment. In Proceedings of the
NAACL HLT 2009 Workshop on Active Learning for Natural Language Processing, pages 18–26.
Hintat Cheung and Susan Kemper. 1992. Competing complexity metrics and adults’ production of com-plex sentences. Applied Psycholinguistics, 13:53– 76.
David Cohn, Zoubin Ghahramani, and Michael Jordan. 1996. Active learning with statistical models.
Jour-nal of Artificial Intelligence Research, 4:129–145.
Lyn Frazier and Keith Rayner. 1987. Resolution of syntactic category ambiguities: Eye movements in parsing lexically ambiguous sentences. Journal of
Memory and Language, 26:505–526.
Ben Hachey, Beatrice Alex, and Markus Becker. 2005. Investigating the effects of selective sampling on the annotation task. In CoNLL 2005 – Proceedings of
the 9th Conference on Computational Natural Lan-guage Learning, pages 144–151.
George Klare. 1963. The Measurement of Readability. Ames: Iowa State University Press.
Dekang Lin. 1996. On the structural complexity of natural language sentences. In COLING 1996 –
Pro-ceedings of the 16th International Conference on Computational Linguistics, pages 729–733.
Linguistic Data Consortium. 2001. Message Under-standing Conference (MUC) 7. Philadelphia: Lin-guistic Data Consortium.
Keith Rayner, Anne Cook, Barbara Juhasz, and Lyn Frazier. 2006. Immediate disambiguation of lex-ically ambiguous words during reading: Evidence from eye movements. British Journal of
Psychol-ogy, 97:467–482.
Keith Rayner. 1998. Eye movements in reading and information processing: 20 years of research.
Psy-chological Bulletin, 126:372–422.
Eric Ringger, Marc Carmen, Robbie Haertel, Kevin Seppi, Deryle Lonsdale, Peter McClanahan, James Carroll, and Noel Ellison. 2008. Assessing the costs of machine-assisted corpus annotation through a user study. In LREC 2008 – Proceedings of the 6th
International Conference on Language Resources and Evaluation, pages 3318–3324.
Brian Roark, Margaret Mitchell, and Kristy Holling-shead. 2007. Syntactic complexity measures for detecting mild cognitive impairment. In
Proceed-ings of the Workshop on BioNLP 2007: Biological, Translational, and Clinical Language Processing,
pages 1–8.
Burr Settles, Mark Craven, and Lewis Friedland. 2008. Active learning with real annotation costs. In
Proceedings of the NIPS 2008 Workshop on Cost-Sensitive Machine Learning, pages 1–10.
Patrick Sturt. 2007. Semantic re-interpretation and garden path recovery. Cognition, 105:477–488.
Benedikt M. Szmrecs´anyi. 2004. On operationalizing syntactic complexity. In Proceedings of the 7th
In-ternational Conference on Textual Data Statistical Analysis. Vol. II, pages 1032–1039.
Katrin Tomanek and Udo Hahn. 2009. Semi-supervised active learning for sequence labeling. In
ACL 2009 – Proceedings of the 47th Annual Meet-ing of the ACL and the 4th IJCNLP of the AFNLP,
pages 1039–1047.
Katrin Tomanek and Udo Hahn. 2010. Annotation time stamps: Temporal metadata from the linguistic annotation process. In LREC 2010 – Proceedings of
the 7th International Conference on Language Re-sources and Evaluation.
Matthew Traxler and Lyn Frazier. 2008. The role of pragmatic principles in resolving attachment ambi-guities: Evidence from eye movements. Memory &