Munich Personal RePEc Archive
Does it matter where you export and
does real productivity really rise with
exporting?
Dalgıç, Başak and Fazlıoğlu, Burcu and Gasiorek, Michael
Hacettepe University, TOBB University of Economics and
Technology, Sussex University
2015
Online at
https://mpra.ub.uni-muenchen.de/69956/
Does it matter where you export and does real
productivity really rise with exporting?
Ba¸sak Dalgı¸c
∗Burcu Fazlıo˘glu
†Michael Gasiorek
‡October 2015
Abstract
Utilizing a comprehensive dataset for Turkish manufacturing firms over 2003-2011, we analyse the differentials in the post-entry effects of export-ing to markets with different income levels. We employ propensity score matching techniques together with a differences in differences methodology. Controlling for the quality of exports, we explore whether the post-entry effects on productivity are driven by changes in real productivity, as op-posed to quality/price markup effects. Our results confirm the learning by exporting hypothesis and suggest real productivity gains in particular for exports to high income (HI) countries as opposed to middle low income (MLI) countries even after controlling for the composition of exports. This suggests that where a firm exports does matter.
Keywords: Exports, Geographical diversification, Post-entry effects, Quality, Export composition.
JEL Classification Codes: D24, F14.
∗Department of Public Finance, Hacettepe University, Turkey. e-mail:
†Department of International Entrepreneurship, TOBB University of Economics and Tech-nology, Turkey. e-mail: [email protected]
1
Introduction
There is an extensive literature on the relationship between exporting and produc-tivity, where much of the discussion is concerned with the issue of self-selection versus learning by exporting. The empirical literature largely draws on the theoret-ical work of (Melitz, 2003) on heterogeneous firms. A core feature of these models is that exporting involves higher fixed/sunk costs and possibly also higher variable costs. Consequently only more productive firms will be able to export, hence the self-selection hypothesis. It is also possible however, that exporting activity can lead to productivity growth, which is the learning-by-exporting hypothesis. Early work on this (Clerides et al. 1998; Bernard & Jensen, 1999) found that the higher productivity is driven by self-selection as opposed to learning-by-exporting. More recent evidence is mixed. This derives in part from the use of different data-sets for different types of countries and different time-periods, and in part from different methodologies employed.
There are several mechanisms through which learning by exporting may occur. These include: greater competition in foreign markets inducing firms to become more competitive (Damijan & Kostevc, 2006); interaction with foreign buyers who may offer technical assistance or demand higher quality (Blalock & Gertler, 2004); an improved understanding of foreign markets (Eaton, 2010); economies of scale or scope arising from access to a larger market or changes in the product mix; investment in product or process innovation (Damijan et.al. 2008), and quality upgrading (Verhoogen, 2008).
This paper integrates and extends the existing empirical literature on the rela-tionship between exports and productivity. To this end, we exploit an extremely rich and comprehensive firm level data set of Turkish manufacturing industry firms over the years 2003-2011, a period which Turkey has experienced an export boom as well as undergoing a structural transformation process along with sectoral and geographical diversification. We focus on three key issues.
First, we examine whether measured productivity really rises with exporting this is the issue of self-selection versus learning-by-exporting. We do this by em-ploying propensity score matching (PSM) together with a difference-in-differences (DiD) methodology. Whereas the existing literature has relied on matching and then on estimating the average treatment effects between non-exporters and ex-port starters, we also apply this method to exex-port starters and always-exex-porters. This allows us to control for selection in a much more satisfactory manner than heretofore.
Secondly, we explore whether the post-entry effects on productivity are driven by changes in real productivity, as opposed to quality/price markup effects. We do so in two way. The richness of our data set allows us to compute average unit values for firm level exports based on each firm’s 12-digit export flows. We use these unit values to control for quality in the propensity score matching. In addition, our data set allows us to categorize each firm’s exports by the type of product being exported — for example between differentiated and homogeneous goods. We use such categorization to explore whether the impact on productivity varies across categories.
Thirdly we identify the differentials in immediate and future productivity gains upon entry of firms into export markets with different income levels controlling for the composition of exports. For this we first group countries using World Bank’s classification according to gross national income per capita and distinguish between two mutually exclusive groups of markets: High-income (HI) countries and Medium-Low-income (MLI) countries. We then categorize firms on the basis of the destination of their exports. Once again, this is made possible by the richness of the data which gives us the destination for each 10-digit product produced by each firm.
prod-ucts. This is consistent both with a learning-by-export hypothesis, but also with changes in mark-ups and/or quality. Once we control for quality however we still find a positive impact which suggests that real productivity is positively associated with exporting. However, in terms of MLI starters we only find some evidence of a positive impact on productivity with regard to differentiated products. Our re-sults strongly suggests where you export matters. Finally, we find a larger positive impact on productivity associated either with exporting to more countries, or with exporting more products. This suggests there may be economics of scope either in the product or country dimension.
The remainder of this paper is organized as follows. Section 2 gives a brief overview of the literature. Section 3 discusses data and preliminary descriptive evidence. Section 4 presents the results of our empirical investigation. Section 5 concludes.
2
Related Literature
The heterogenous firms international trade literature largely builds on the work of Melitz (2003) and Bernard et al. (2003). Due to sunk costs and differential productivity levels within the same industry the most productive firms self-select into export markets. An alternative but not mutually exclusive explanation re-garding the superior performance of exporters is that firms become more efficient after they begin exporting through learning or economies of scale effects (Clerides et al., 1998).1
Evidence on self-selection versus learning-by-exporting (LBE) is mixed. Several authors find little or no evidence of LBE. This includes, for example, Clerides et al (1998) using data on Columbia, Mexico and Morocco; Arnold and Hussinger (2003) with regard to German firms; and Greenaway, Gullstrand et al (2005) for Swedish firms. Damijan & Kostevc (2006) with regard to Slovenian firms, and Eliasson et al (2009) using data on small and medium sized Swedish firms find an initial one-period impact on observed productivity but that the productivity gap then remains constant. A possible explanation for this is a short-run increase in capacity utilization with no longer run impacts on productivity.
Alvarez & Lopez (2005) used the term ”conscious self selection” to describe firms choosing to invest in order to increase productivity in preparation for ex-porting. Costantini & Melitz (2007) show analytically how trade liberalization can increase the rate of return on R&D or investment in new technology leading to future endogenous productivity gains (see also Atkeson & Burstein, 2010). In a dynamic model Burstein and Melitz (2011) show how innovation and the decision
1
to export endogenously interact, as a result amplifying the productivity differences between exporters and non-exporters. In these papers export market size affects the firm’s choice to export or invest in new technology.
Alvarez & Lopez find strong evidence supporting the notion of self-selection as a conscious process. Bustos (2011) working with Argentinian firm shows how exporting provides firms incentives to invest in new technologies leading to higher productivity. Aw, Roberts et al. (2011) based on Taiwanese data show how investments in R&D and technology adoption are correlated with exporting and therefore productivity. In related work Damijan & Kostevc (2006) find evidence that exporting has a positive impact on innovation; and Iacovone & Javorcik (2008) show that Mexican firms improve quality (unit values) prior to exporting to the United States in response to NAFTA. Eckel et al (2015) integrate the literature on multi-product firms with the literature on endogenous investment and show that firms may choose to compete in export markets either with respect to cost, or with respect to quality and that this depends on the nature of the markets they are exporting to and the nature of the products they produce. They test the model on Mexican data and show that firms producing differentiate products tend to compete on quality, while those producing non-differentiated goods compete more on price.
De Loecker (2010) argues that existing methods tend to bias against rejecting the LBE hypothesis. This is because firms often decide to export and invest to ex-port simultaneously, and hence that exex-port experience matters in shaping a firm’s future productivity. Based on Slovenian data he shows substantial productivity gain associated with export entry (up to 7.35%). Similarly Van Biesebroeck (2005) shows that exporters in nine sub-saharan African countries are more productive and increase their productivity on entry into the export market, where the key driver of the productivity differences is economies of scale through access to larger markets. Similarly positive LBE effects have been found by Hansson & Nan (2004) on Swedish firms, Serti & Tomasi (2008) for Italian firms, Cirera et al (2015) for Brazilian firms, and Manjon et al.(2013) for Spanish firms.
diversification.
Along with the number of foreign markets served there has been some work on the characteristics of these markets. This includes models with asymmetric countries and asymmetric sunk costs of entry. Helpman et al. (2007) and Chaney (2008) build on Melitz (2003) model and find that self-selection depends on the market that the firm operates in. Firms with lower productivity levels serve mar-kets with low productivity thresholds (less developed marmar-kets) whereas higher productivity firms export to markets with high productivity thresholds (more veloped markets). The empirical evidence indicates that exporters to more de-veloped economies show ex-ante superior performance compared to less dede-veloped country exporters (Pisu, 2008 on Belgian firms; Serti & Tomasi, 2009 and Conti, 2010 with respect to Italian firms; Silva et al., 2012 for Portuguese firms).
There is however comparatively little evidence on LBE by destination. Con-ceptually this could occur as a result of greater competition in developed country markets (Damijan & Kostevc, 2006); greater interaction with firms/suppliers op-erating close to the technology frontier (Blalock & Gertler, 2004; Albornoz & Ercolani, 2007), and with improved techniques of quality control; greater possibil-ities to exploit economies of scale or scope arising from access to a larger market or from changes in the product mix; or from an improved understanding of foreign markets (Eaton, 2010).
3
Data and Preliminary Evidence
In this paper, we utilize a recent firm-level panel merging two different data sets collected by Turkish State Institute of Statistics (TURKSTAT) and described as follows:
The Annual Industry and Service Statistics is a census of firms with more than
19 employees and a representative survey for firms with less than 20 employees. For this study, we select the whole population of private Turkish manufacturing firms with 20 employees or more.2
In the data set, firms are classified according to their main sector of activity, as identified by Eurostat’s NACE Rev.1.1 standard codes for sectoral classification.3
The database provides detailed information on a number of structural variables which are mainly seen on a firms’ balance sheet such as revenues, value added, labor cost, intermediate inputs cost, tangible and intangible investment costs4
together with information on industry and geograph-ical location, foreign ownership and the number of employees. We calculate the capital stock series of firms by applying the perpetual inventory methodology and using the data on investment cost series for machinery and equipment, building and structure, transportation equipment and computer and programming. The
Foreign Trade Statistics consists of the imports and exports at 12-digit GTIP
classification the first 8 digits of whom correspond to CN classification whereas the last 4 digits are national. The information on the origin/destination countries of trade flows is also available in the data set.
After a cleaning procedure mainly inspired by Hall and Mairesse (1995), our unbalanced panel covers longitudinal data of 18,286 firms on average over the period 2003-2011. We removed abnormal observations (zero/negative) for the main variables such as output, intermediate inputs, labor cost etc.; and excluded observations where the main variables and ratios (e.g. employee, value added per employee, capital per employee) display excessive variation. Finally, we excluded firms in NACE sectors 16 (Manufacture of tobacco products), 23 (Manufacture of coke, refined petroleum products and nuclear fuel), 30 (Manufacture of office, accounting and computing machinery), 37 (Recycling) since they include a small number of firms.
The empirical analysis is based on estimates of firm level productivity, based
2
Firms with 20 and more than 20 employees account for a large share of Turkish manufacturing industry. For example accounting for 87% of production in value and 75% of employment in 2009, with a similar pattern for other years.
3
The economic activities that are included in the survey are NACE sections C to K, and M to O
4
on total factor productivity (TFP) estimates calculated by utilizing Levinsohn & Petrin’s (2003) semi-parametric approach. Griliches & Mairesse (1995) criticize the ordinary least squares (OLS) estimation of production functions as firms’ in-put demands might be correlated with unobserved productivity shocks. Hence, treating inputs as exogenous variables might create simultaneity bias in the OLS estimation of production functions while the unobserved shocks will be captured in the error term. Another problem that may arise by OLS estimation is selection bias as the capital stock responds to productivity shocks in lagged periods. Firms with a larger capital stock would expect higher future returns for any given pro-ductivity level and, hence, will continue to operate even if they observe low levels of productivity for the next period (Olley and Pakes, 1996). Firms with smaller amounts of capital stock may have to exit the market in such conditions. Thus a negative correlation between the disturbance term and capital stock is expected in OLS estimations and the resulting capital coefficients are likely to be downward biased.
To overcome these biases, Olley & Pakes (1996) and Levinsohn & Petrin (2003) suggest semi-parametric production function estimators. In order to eliminate the relationship between productivity shocks and variable inputs, Olley & Pakes (1996) proxy productivity shocks with firms’ investment decision. Levinsohn & Petrin (2003) suggest that investment may not be monotonically increasing in productivity in data sets with a large number of zero observations on investment, and that deleting these zero observations might create loss in terms of efficiency. Hence Levinsohn & Petrin (2003) propose using material inputs as a proxy into the estimation as material inputs are generally reported in firm-level data sets. Since our data set shows a similar pattern (a large number of zero observations in the investment series) we to use the Levinsohn & Petrin’s(2003) methodology in estimating TFP. We do so at the 2-digit sectoral level where TFP is measured as the residual of labor and capital over value added under a Cobb-Douglas tech-nology, employing the firms’ usage of intermediate inputs as a proxy variable for unobserved productivity shocks.
Before proceeding with the empirical analysis we first group traders according to their destination market. We use the World Bank’s classification of countries ac-cording to gross national income per capita, and distinguish between two mutually exclusive groups of countries High-income countries (HI) and Medium-Low-income countries (MLI).5
We define a firm selling all of its exports to HI regions as an only-HI-exporter, a firm directing all of its total export value to MLI countries as an only-MLI-exporter and firms exporting both to the HI and MLI countries as
5
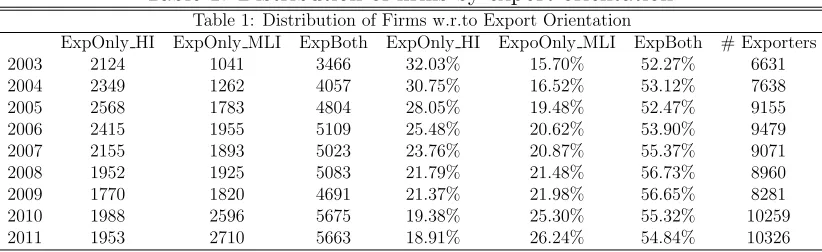
both high and medium-low income exporters. In Table 1, we present the distribu-tion of exporters in each group as well as total number of exporters in each year. We see that over the period between 50-55% of firms trade with more than one group of countries and that the share of firms exporting only to MLI countries rises 15.7% of firms to 26.2%, with a corresponding decline in the relative importance of firms exporting only to HI countries. This transition is driven by the decline of the EU and EFTA countries as export destinations and the development of new markets in the Middle East and North Africa (MENA) as well as in Europe and Central Asia.
Table 1: Distribution of firms by export orientation
Table 1: Distribution of Firms w.r.to Export Orientation
ExpOnly HI ExpOnly MLI ExpBoth ExpOnly HI ExpoOnly MLI ExpBoth # Exporters 2003 2124 1041 3466 32.03% 15.70% 52.27% 6631 2004 2349 1262 4057 30.75% 16.52% 53.12% 7638 2005 2568 1783 4804 28.05% 19.48% 52.47% 9155 2006 2415 1955 5109 25.48% 20.62% 53.90% 9479 2007 2155 1893 5023 23.76% 20.87% 55.37% 9071 2008 1952 1925 5083 21.79% 21.48% 56.73% 8960 2009 1770 1820 4691 21.37% 21.98% 56.65% 8281 2010 1988 2596 5675 19.38% 25.30% 55.32% 10259 2011 1953 2710 5663 18.91% 26.24% 54.84% 10326
[image:10.595.116.481.627.689.2]Motivated by the stylized facts in the literature that exporters to more oped economies show superior performance with respect to exporters to less devel-oped countries, Table 2 provides some descriptive comparisons where we compare TFP, labour productivity (LP) defined as value added (gross output net of in-termediate inputs) per employee, capital intensity (ratio of the capital stock to the number of employees), wage per employee (WAGE L), total manufacturing sales (SALES) and number of employees (EMP). The table gives the means of these variables for firms exporting to destination markets according to destination country income levels. Our findings suggest that firms exporting to both kind of regions outperform others. That is both HI and MLI exporters are the most productive, most capital intensive and largest in terms of number of employees and sales, pay the highest wages. One can also see that only-HI-exporter show superior performance with respect to only-MLI-exporters.
Table 2: Firm Performance according to export orientation
TFP LP CAPINT EMP WAGE L
ExporterOnly HI 7,830 10,078 8.08 101,070 6.835
ExporterOnly MLI 7,480 9,961 8.064 75,271 6.812
We also present the results of ’standard’ premia regressions. These follow the oft-used methodology in the literature (eg. Pisu, 2008; Serti & Tomasi, 2009) where we estimate a dynamic panel model with fixed effects and using dummies for export market participation.
The dependent variable measures the logarithm of total factor productivity (TFP) where subscriptidenotes individual firms andtindexes year. Dummies for the export market orientation are denoted by ExporterOnly−HI
it ; Exporter
Only−HI
it
and β3ExporteritBoth, respectively, dummy variables for a HI-exporters,
only-HI-exporters and both HI and MLI exporters. The beta coefficients in front of the export orientation dummies represents the average trading premia for firms export-ing to different countries, with respect to the baseline category of non-exporters. We utilize a series of control variables denoted by the vector of controls including the logarithm of the number of employees in each firm, a foreign ownership dummy, an import status dummy indicating whether a firm is an importer or not, two-digit sector dummies, region and year dummies. We also incorporate firm specific time invariant fixed effects.
T F Pit =β0+αi+T F Pit−1+β1Exporter
Only−HI
it +β2Exporter
Only−M LI
it
+β3ExporteritBoth+δControls+εit
(1)
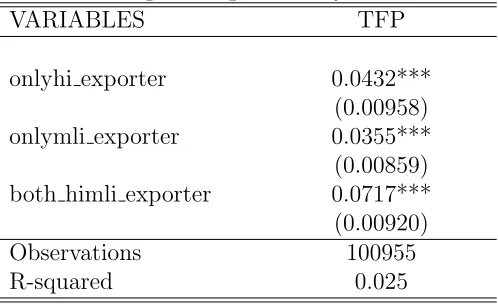
The results obtained from the fixed effects panel specification are shown in Table 3, where we report only on the export destination dummies. We find that firms exporting only to HI countries perform better than firms exporting only to MLI countries whereas non-exporters perform the worst. Firms exporting to both HI and MLI countries have the highest premia and this may reflect the fact that firm performance is increasing with firms’ geographical scope. Note such a specification provides a correlation between firm productivity and exporters’ status but does not satisfactorily deal with the issue of self-selection and the post-entry effects of exporting. It is to this that we now turn.
4
Empirical Analysis
4.1
Post-entry di
ff
erentials: baseline specification
Table 3: Exporter premia by destination
VARIABLES TFP
onlyhi exporter 0.0432***
(0.00958)
onlymli exporter 0.0355***
(0.00859)
both himli exporter 0.0717***
(0.00920)
Observations 100955
R-squared 0.025
Robust standard errors in parentheses *** p<0.01, ** p<0.05, * p<0.1
we use a difference-in-differences (DiD) approach which further removes the effects of common shocks and provide clear estimates of the treatment effect on the change in productivity differentials.
Our aim is to estimate the productivity gains associated with export entry separately for HI and MLI countries. In a baseline specification, to estimate the productivity gains associated with export entry separately for HI and MLI coun-tries we establish two treatment models. Our treatment group consists of firms that do not export at timet-1, start exporting only to the HI countries (MLI coun-tries) at time t and continue exporting only to the HI countries (MLI countries) at least until time t+1. Accordingly, we have seven cohorts each corresponding to a year between 2004 and 2010. Note that here we restrict our treated sample to firms that start exporting to only HI or only MLI countries. Although these firms constitute a smaller share of the sample, this restriction is necessary to accurately identify the differentials in productivity gains. In the third and fourth models, our treatment group consists of firms that were exporting only to the MLI countries (HI countries) at time t-1 and start to export to HI countries (MLI countries) at time t and continue to export both types of markets at least until time t+1. Our control group covers the firms that continue exporting only to the MLI countries (HI countries) over the analysis period. We calculate the average treatment effects on the treated (ATT) as follows:
AT T =E(Yit(1)−Yit(0)|Di = 1) =E(Yit(1)|Di = 1)−E(Yit(0)|Di = 1) (2)
Equation (2) shows the difference between the productivity level after the firm, which is formerly non-exporter (Di = 1), starts exporting only to the HI countries
would have never exported to HI countries (MLI countries) (Yit(0)|Di = 1). The
potential outcomes of both models are unknown. Nevertheless, we can calculate the outcome for control groups, which can be defined as E(Yit(0)|Di = 0). However,
as is well known, there can be selection bias in the calculation of the ATT. The bias is defined as:6
B(AT T) =E(Yit(0)|Di = 1)−E(Yit(0)|Di = 0)
To overcome the possible selection bias we apply PSM techniques jointly with difference-in-differences (DiD)7
. Pioneered by Wagner (2002) in this context, the PSM methodology has been subsequently used by others (Arnold and Hussinger (2005) on German firms; Greenaway et al (2005) on Swedish firms; Damijan (2006) and Damijan & Kostevc (2008) on Slovenian data; Manjon et al (2013), on Spanish data, Hansson & Lundin (2009)). But as detailed below, in this paper we use improved control and treatment groups, as well as controlling for quality. The DiD approach removes the effect of common shocks and provides a clearer estimate of the treatment effect on the productivity differentials. We define the PSM-DID estimator as follows, where the resulting ATT gives the difference between average treatment effects of treated and non-treated groups in which time-invariant unobservables are eliminated:
∆P SM−DIDAT T =E(Y
it(1)−Yit(0)|Di = 1)−E(Yit(1)−Yit(0)|Di = 0)
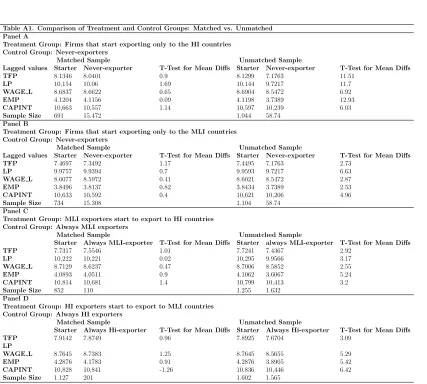
In order to find the control units to be matched with the treated units we first estimate probit models from which we recover the propensity scores. The dependent variable in the probit specifications is the probability to start to export HI countries (MLI countries) at timet and the vector of covariates consists of the logarithms of TFP, wage per employee, number of employees, capital intensity, foreign ownership as well as year, sector, import status and region dummies. All of the independent variables are in their one period lagged value. We include the lagged values of the covariates since current values of these variables can also be affected by the exporting behavior of the firms. Making use of the propensity scores resulting from the probit estimates, we apply kernel matching.8
For the
6
Dehajia & Wahba (2002) suggest that comparing a treatment group with a non-experimental control group can give biased results because of problems such as self-selection or some form of systematic judgment by the researcher in selecting treatment units.
7
See Blundel & Costa Dias (2000) for a discussion of the use of matching techniques with DiD in order to improve the quality of non-experimental evaluations.
8
quality of the matching we check whether the means of covariates are significantly different in the matched and unmatched samples. Our results (see Appendix, Table A1) show that the matching procedure eliminates the inequality for means of covariates and significant differences disappear in the matched sample.
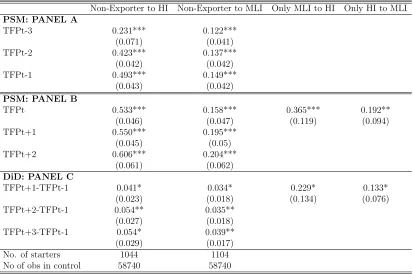
The resulting average treatment effects (ATTs) in Panel A of Table 4 provides us with a productivity comparison between export starters and never-exporters some years before entry. The first column of the table give the ATTs for non-exporters who start to export only to HI, and the second column for non-non-exporters who start to export only to MLI; and the subsequent two columns then give those that were exporting to HI (MLI) and then also start exporting to MLI (HI). The top panel of the table gives the ATTs prior to exporting; the middle panel gives the ATTs once firms start to export; and the bottom panel gives the results for the difference-in-difference estimations.
From Table 4, Panel A we we see that prior to exporting there is an increase in the productivity difference between export starters and non-exporters. This suggests that before starting to export, export starters are becoming increasingly more productive than non-exporters signalling some preparation for exporting. This effect is more pronounced for non-exporter firms that start to export to HI countries (HI-starters) in comparsion to firms that start to export to MLI countries (MLI-starters). For example, the difference in productivity between non-exporters and export-starters in periodt-2 is considerably higher with regard to HI exporters (42 percentage points) as opposed to MLI exporters (13 percentage points).
In Panels B and C we identify the impact of starting to export only to the HI countries (MLI countries) on the productivity of formerly non-exporting firms. Hence the first column gives the ATTs and the DiD coefficient for firms that were previously non-exporters and now export only to high income countries. What is clear from the table is that the productivity of export starters is higher than those that remain non-exporters, and that exporting to HI or MLI countries improves the productivity of the previously non-exporter firms. This can be seen from the increase in the PSM coefficients over time, and from the DiD coefficient. When the unobserved time-invariant effects are eliminated with the DiD methodology, the increase in productivity between t-1 and t+1 for exporters to HI is 4.1% and for
MLI it is 3.4%. Note also that the difference in productivity between non-exporters and export-starters in period t is considerably higher with regard to HI exporters (53 percentage points) as opposed to MLI exporters (16 percentage points).
Table 4: Average treatment effects from PSM-DiD
Non-Exporter to HI Non-Exporter to MLI Only MLI to HI Only HI to MLI
PSM: PANEL A
TFPt-3 0.231*** 0.122*** (0.071) (0.041) TFPt-2 0.423*** 0.137***
(0.042) (0.042) TFPt-1 0.493*** 0.149***
(0.043) (0.042)
PSM: PANEL B
TFPt 0.533*** 0.158*** 0.365*** 0.192** (0.046) (0.047) (0.119) (0.094) TFPt+1 0.550*** 0.195***
(0.045) (0.05) TFPt+2 0.606*** 0.204***
(0.061) (0.062)
DiD: PANEL C
TFPt+1-TFPt-1 0.041* 0.034* 0.229* 0.133* (0.023) (0.018) (0.134) (0.076) TFPt+2-TFPt-1 0.054** 0.035**
(0.027) (0.018) TFPt+3-TFPt-1 0.054* 0.039** (0.029) (0.017) No. of starters 1044 1104 No of obs in control 58740 58740
Note: asterisks denote significance levels (***p<1%; **p<5%; p<10%)
MLI exporter to also being an HI exporter increases productivity by nearly 23 percent, and conversely switching from being an HI exporter to also being a MLI exporter increases productivity by just over 13 percent9
.
Note that while the preceding table and discussion identifies the positive im-pact of exporting on productivity the results are potentially problematic in two dimensions. First, and as discussed earlier our productivity estimates are revenue based measures and it is possible that the observed change in productivity does not reflect changes in real productivity, but instead is a result of changes in quality or markups. There is also a second concern, to do with the quality of the match-ing procedure. Although our procedure suggests that the matchmatch-ing eliminates the inequality for means of covariates and significant differences disappear in the matched sample, it is still possible that in some other unobserved dimension the export starters are different to the non-exporters and that selection issues remain. We deal with each of these in the following manner. Our rich trade data set gives us the exports of each firm up to the 12-digit level. For each exporting firm we therefore calculate the weighted average unit-value based on the value of exports.10
We then re-run the PSM matching routine where our treatment group is as before - non-exporting firms that start to only export to HI(MLI); but this time our control group are those firms that always only export to HI(MLI) throughout our sample period. This procedure, therefore neatly handles both the issue of quality (and to a large extent therefore mark ups as these are typically highly correlated with quality) and the issue of selection, as we are now comparing export starters with always exporters. To our knowledge applying the PSM by comparing export starters with always exporters has not been previously done, neither has the literature controlled for quality in this way.
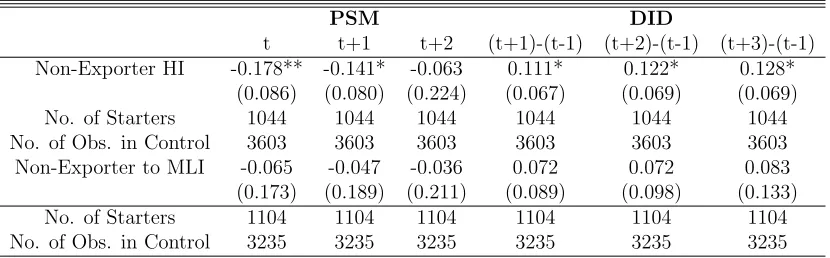
The results for this are given in Table 5, where the first three columns give the PSM results and the last three columns the DiD results. If, ceteris paribus, exporting leads to higher productivity then, over time, for exporting firms produc-tivity should rise. Therefore if we compare the producproduc-tivity of firms previously
9
We also conducted sensitivity analysis on our definition of being a HI (MLI) exporter firm, we redefine an HI (MLI) exporter as a firm selling more than 50 percent of its exports to HI (MLI) countries. We alternatively define two different cut-offs of 75 percent and 90 percent. By doing so, we aim to see the effect of starting to export to HI (MLI) countries with a share of more than 50/75/90 percent while being a non-exporter formerly. Results from the new sets of specifications corroborate our previous findings. First of all, post entry productivity gains of starting to export to HI countries are always greater than that of MLI countries. Further, the more countries are HI (i.e. the higher the share of HI-countries within a firm’s total exports/ the higher the cut-offs) as opposed to MLI, the bigger are the coefficients (i.e. treatment effects). Consistently, as the share of exports to MLI countries within a firm rises, ATTs decrease. The results are available upon request.
10
exporting with the productivity of export starters we would expect the ATT to be negative - which is what we find. The PSM results in the first three columns are negative, declining over time, but only statistically significant for exporters to HI for the first two periods. This indicates that firms exporting to HI destinations see the productivity gap between themselves and the always exporters diminish over time. In turn this is confirmed by the DiD results, which suggest a real productiv-ity increase for the HI export starters of 11.1%. Note that this suggests that once we control for quality, the impact of exporting on productivity is larger than in the preceding table. The DiD results further suggest that productivity improvement takes place mainly in the first year although we do find on-going productivity gains as much as three years after from export entry. Finally, what is interesting from this table is that once we control for quality/markups and for the possible remain-ing selection problems associated with our first set of control groups, there is no evidence of an increase in real productivity for exporters to MLI destinations. In other words, with respect to MLI exports the observed productivity increase seen previously in Table 4 might arise from either a quality or mark-up effect.
Table 5: ATTs from PSM-DiD with alternative control group
PSM DID
t t+1 t+2 (t+1)-(t-1) (t+2)-(t-1) (t+3)-(t-1) Non-Exporter HI -0.178** -0.141* -0.063 0.111* 0.122* 0.128*
(0.086) (0.080) (0.224) (0.067) (0.069) (0.069) No. of Starters 1044 1044 1044 1044 1044 1044 No. of Obs. in Control 3603 3603 3603 3603 3603 3603 Non-Exporter to MLI -0.065 -0.047 -0.036 0.072 0.072 0.083 (0.173) (0.189) (0.211) (0.089) (0.098) (0.133) No. of Starters 1104 1104 1104 1104 1104 1104 No. of Obs. in Control 3235 3235 3235 3235 3235 3235
Note: asterisks denote significance levels (***p<1%; **p<5%; p<10%)
4.2
Post-entry di
ff
erentials by factor intensity and product
sophistication
type of the product being exported. We perform PSM-DiD estimations over sub-samples where we classify firms according to their export composition in terms of their export products.
One way of looking at the different types of goods with different sophisti-cation levels is to classify them according to Hinloopen and Marrewijk (2008) classification. Hinloopen and Marrewijk (HM, 2008) decompose trade into six categories: primary products; natural resource intensive products; unskilled labor intensive products; technology intensive products; human capital intensive prod-ucts; and other. Using the HM classification, we distinguish between three types of exporters: primary/resource/unskilled labor-intensive (P/R/U) goods exporters, technology intensive goods exporters, and skilled-labour (human capital) intensive goods exporters. To define a firm’s export sophistication level in terms of HM clas-sification, we rank export products of different types based on their share within a firm’s total exports value. A firm is defined to be “skilled-labour intensive goods exporter” if the skilled-labour intensive goods exports has the largest share in a firm’s total value of exports. We define the other categories similarly. As an al-ternative to HM classification in defining firms’ export composition, we adopt the Rauch (1999) classification where differentiated products represent the products of the sector with greater degree of quality differentiation.
Here, we employ the PSM matching procedure over the sub-samples con-structed upon HM and Rauch classifications where our treatment group is as before - non-exporting firms that start to only export to HI(MLI) and our control group consists of those firms that always only export to HI(MLI) throughout our sample period. For instance, for the technology intensive goods exporters sub-sample our treatment group comprises of non-exporting firms that start to export technology intensive goods11
only to HI(MLI) countries whereas the control group are those firms that always export technology intensive goods only to HI(MLI) throughout our sample period.
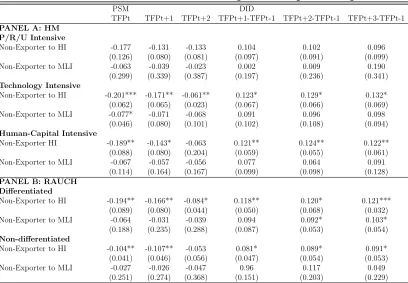
In Panel A and B of Table 6 we present the ATT estimates for the HM and Rauch classifications respectively. Once again we find a negative ATT for period
t, which corroborates the results found earlier. Secondly we find that starting to export to HI countries is found to improve the productivity of non-exporter firms even after controlling for the composition of exports as well as the quality proxied by unit values for high-tech/skill-intensive products. For instance, for HI export starters, ATTs from the DiD estimates for the period t+ 3 suggest a real productivity increase for the technology intensive good exporters of 13.2%, for skill-intensive goods exporters of 12.2%, while the coefficient is not significant for
11
Table 6: ATTs from PSM-DiD with respect to export composition
PSM DID
TFPt TFPt+1 TFPt+2 TFPt+1-TFPt-1 TFPt+2-TFPt-1 TFPt+3-TFPt-1 PANEL A: HM
P/R/U Intensive
Non-Exporter to HI -0.177 -0.131 -0.133 0.104 0.102 0.096 (0.126) (0.080) (0.081) (0.097) (0.091) (0.099) Non-Exporter to MLI -0.063 -0.039 -0.023 0.002 0.009 0.190
(0.299) (0.339) (0.387) (0.197) (0.236) (0.341) Technology Intensive
Non-Exporter to HI -0.201*** -0.171** -0.061** 0.123* 0.129* 0.132* (0.062) (0.065) (0.023) (0.067) (0.066) (0.069) Non-Exporter to MLI -0.077* -0.071 -0.068 0.091 0.096 0.098
(0.046) (0.080) (0.101) (0.102) (0.108) (0.094) Human-Capital Intensive
Non-Exporter HI -0.189** -0.143* -0.063 0.121** 0.124** 0.122** (0.088) (0.080) (0.204) (0.059) (0.055) (0.061) Non-Exporter to MLI -0.067 -0.057 -0.056 0.077 0.064 0.091
(0.114) (0.164) (0.167) (0.099) (0.098) (0.128) PANEL B: RAUCH
Differentiated
Non-Exporter to HI -0.194** -0.166** -0.084* 0.118** 0.120* 0.121*** (0.089) (0.080) (0.044) (0.050) (0.068) (0.032) Non-Exporter to MLI -0.064 -0.031 -0.039 0.094 0.092* 0.103* (0.188) (0.235) (0.288) (0.087) (0.053) (0.054) Non-differentiated
Non-Exporter to HI -0.104** -0.107** -0.053 0.081* 0.089* 0.091* (0.041) (0.046) (0.056) (0.047) (0.054) (0.053) Non-Exporter to MLI -0.027 -0.026 -0.047 0.96 0.117 0.049
(0.251) (0.274) (0.368) (0.151) (0.203) (0.229)
the unskilled labour-intensive/primary/resource intensive exporters. Given that we are controlling for quality/price markup effects, these results suggest strongly that the productivity gains we find are associated either with some form of technol-ogy/managerial spillovers from interactions with foreign buyers, or from economies of scale. We also find that the productivity gains appear to be primarily in the first year of exporting, with only a very modest subsequent increase in productiv-ity for technology intensive goods. Finally, it is also worth noting that there are no statistically significant productivity gains for MLI-starters for any of the HM categories.
In Panel B with the ATTs over sub-samples by Rauch classification, one can observe that there are again significant real productivity gains for HI-starters. However, differentiated products have greater productivity impact with respect to non-differentiated goods. For instance, the increase in productivity from the PSM-DiD estimates suggests that switching from being an non-exporter to being an HI exporter of differentiated goods increases productivity by just over 12%, and switching from being an exporter to being an HI exporter of mainly non-differentiated goods increases productivity by just over 9%. What we find is that when looking at MLI starters we only observe significant productivity growth for the differentiated products, and where the effect is slightly lower than that for the HI starters. There is no evidence for the MLI export starters of a positive productivity impact for any of the HM classification categories. Overall therefore, the findings from Table 6 indicate that there exist differential effects of exporting across HI and MLI countries even for the same types of products suggesting that where a firm exports does matter for productivity growth.
4.3
Post-entry di
ff
erentials by extensive margins
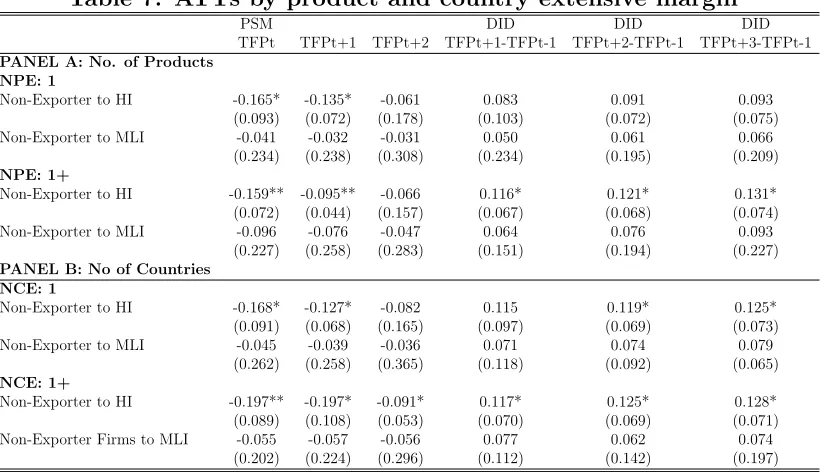
So far, we have shown that the real productivity effect is at work primarily for HI exporters while controlling for quality/mark-up effects and sophistication of the exporting. Now, we aim to investigate whether there may be economies of scope at work leading to ex-post productivity improvements across different markets. Hence, here we examine whether there are any changes in real productivity asso-ciated either with exporting to more countries, or with exporting more products, as well as investigating how these changes differ across markets.
can check whether the productivity effects outlined earlier derive from changes in the product mix. We employ our matching routine for each sub-sample where our treatment group is - non-exporting firms that start to only export to HI(MLI) and our control group consists of those firms that always only export to HI(MLI) throughout our sample period. E.g., for exporters of only one product, our treat-ment group comprises of non-exporting firms that start to export to HI(MLI) countries with only 1 product while the control group are those firms that always export to HI(MLI) only with one product throughout our sample period.
Table 7: ATTs by product and country extensive margin
PSM DID DID DID
TFPt TFPt+1 TFPt+2 TFPt+1-TFPt-1 TFPt+2-TFPt-1 TFPt+3-TFPt-1 PANEL A: No. of Products
NPE: 1
Non-Exporter to HI -0.165* -0.135* -0.061 0.083 0.091 0.093 (0.093) (0.072) (0.178) (0.103) (0.072) (0.075) Non-Exporter to MLI -0.041 -0.032 -0.031 0.050 0.061 0.066
(0.234) (0.238) (0.308) (0.234) (0.195) (0.209) NPE: 1+
Non-Exporter to HI -0.159** -0.095** -0.066 0.116* 0.121* 0.131* (0.072) (0.044) (0.157) (0.067) (0.068) (0.074) Non-Exporter to MLI -0.096 -0.076 -0.047 0.064 0.076 0.093
(0.227) (0.258) (0.283) (0.151) (0.194) (0.227) PANEL B: No of Countries
NCE: 1
Non-Exporter to HI -0.168* -0.127* -0.082 0.115 0.119* 0.125* (0.091) (0.068) (0.165) (0.097) (0.069) (0.073) Non-Exporter to MLI -0.045 -0.039 -0.036 0.071 0.074 0.079
(0.262) (0.258) (0.365) (0.118) (0.092) (0.065) NCE: 1+
Non-Exporter to HI -0.197** -0.197* -0.091* 0.117* 0.125* 0.128* (0.089) (0.108) (0.053) (0.070) (0.069) (0.071) Non-Exporter Firms to MLI -0.055 -0.057 -0.056 0.077 0.062 0.074
(0.202) (0.224) (0.296) (0.112) (0.142) (0.197)
Note: asterisks denote significance levels (***p<1%; **p<5%; p<10%)
gains associated with economies of scope, as opposed to changes in the product mix. We also find a positive impact on productivity associated with exporting to more countries - once again this maybe because of economies of scope associ-ated with multiple destinations - especially if those destinations may have similar characteristics and possibly standards, such as exporting to EU markets.
5
Concluding Remarks
Using a rich firm level data set for the Turkish manufacturing firms over 2003-2011, this paper integrates and extends the existing empirical literature on the relationship between exports and productivity and sheds light on differentials in post-entry effects arose by involvement in export markets with different income levels. We employ PSM methodology together with a DiD methodology. PSM allows us to control for the self-selection whereas DiD estimates further removes effects of common shocks to the productivity. We build upon the existing literature that relied on matching between non-exporters and export starters, but we rede-fine the control groups as always-exporters. In so doing we are able to incorporate information on export quality proxied by average weighted unit values into our analysis. Therefore, we explore whether the post-entry effects on productivity are driven by changes in real productivity, as opposed to quality/price mark up effects. Redefining such control groups also improves the quality of the matching proce-dure since it is still possible that in some other unobserved dimension the export starters are different to the non-exporters and that selection issues may remain. Secondly, we distinguish between several sub-samples of firms using classifications on types of products exported and, use this categorization to control firms’ export composition. Finally, we categorize firms upon their product and country exten-sive margins to investigate whether the differentials between productivity gains across different types of markets is impacted by firms’ export margins.
also some impact on productivity with regard to differentiated products. Overall, these findings indicate that there exist differential effects of exporting across HI and MLI countries even for the same types of products suggesting that where a firm exports does matter. In terms of HI-starters the positive impact of exporting gets larger the greater the number of products exported, and countries exported to, indicating economies of scope.
6
Acknowledgments
We are grateful to the Turkish State Institute of Statistics (TURKSTAT) for pro-viding access to firm-level data under a confidential agreement. In particular, we thank TURKSTAT staffDo˘gan B¨onc¨u, S¸ehmus S¸enol Bozda˘g, Nusret Kılı¸c, Nilg¨un Arıkan, Erdal Yıldırım, Kenan Orhan, B¨ulent Tungul, Akın Bodur, G¨uneri Yi˘git, Sabit Cengiz Ceylan and Ferhat Irmak.
7
Funding
8
Appendix
Table A1. Comparison of Treatment and Control Groups: Matched vs. Unmatched Panel A
Treatment Group: Firms that start exporting only to the HI countries Control Group: Never-exporters
Matched Sample Unmatched Sample
Lagged values Starter Never-exporter T-Test for Mean Diffs Starter Never-exporter T-Test for Mean Diffs
TFP 8.1346 8.0401 0.9 8.1299 7.1763 11.51
LP 10,154 10.06 1.69 10,144 9.7217 11.7
WAGE L 8.6837 8.6622 0.65 8.6904 8.5472 6.92
EMP 4.1204 4.1156 0.09 4.1198 3.7389 12.93
CAPINT 10,663 10,557 1.14 10,597 10,239 6.03
Sample Size 691 15.472 1.044 58.74
Panel B
Treatment Group: Firms that start exporting only to the MLI countries Control Group: Never-exporters
Matched Sample Unmatched Sample
Lagged values Starter Never-exporter T-Test for Mean Diffs Starter Never-exporter T-Test for Mean Diffs
TFP 7.4697 7.3492 1.17 7.4495 7.1763 2.73
LP 9.9757 9.9394 0.7 9.9593 9.7217 6.63
WAGE L 8.6077 8.5972 0.41 8.6021 8.5472 2.87
EMP 3.8496 3.8137 0.82 3.8434 3.7389 2.53
CAPINT 10,633 10,592 0.4 10,621 10,206 4.96
Sample Size 734 15.308 1.104 58.74
Panel C
Treatment Group: MLI exporters start to export to HI countries Control Group: Always MLI exporters
Matched Sample Unmatched Sample
Starter Always MLI-exporter T-Test for Mean Diffs Starter always MLI-exporter T-Test for Mean Diffs
TFP 7.7317 7.5546 1.01 7.7241 7.4367 2.92
LP 10,222 10,221 0.02 10,295 9.9566 3.17
WAGE L 8.7129 8.6237 0.47 8.7006 8.5852 2.55
EMP 4.0893 4.0511 0.9 4.1062 3.6067 5.24
CAPINT 10,814 10,681 1.4 10,799 10,413 3.2
Sample Size 852 110 1.255 1.632
Panel D
Treatment Group: HI exporters start to export to MLI countries Control Group: Always HI exporters
Matched Sample Unmatched Sample
Starter Always Hi-exporter T-Test for Mean Diffs Starter Always Hi-exporter T-Test for Mean Diffs
TFP 7.9142 7.8749 0.96 7.8925 7.6704 3.09
LP
WAGE L 8.7645 8.7383 1.25 8.7645 8.5655 5.29
EMP 4.2876 4.1783 0.91 4.2876 3.8905 5.42
CAPINT 10,828 10,841 -1.26 10,836 10,446 6.42
Bibliography
Arnold, J. M. and K. Hussinger (2003) “Export Behaviour Middle-Low Income Destinations and Firm Productivity in German Manufacturing: A Firm-level Analysis.” Centro Studi Luca d'Agliano.
Aw, B.Y., Roberts, M.J. and D.Y. Xu (2009) “R&D Investment, Exporting, and Productivity Dynamics. No. w14670. National Bureau of Economic Research.
Becker, S.O., and A. Ichino (2002) “Estimation of Average Treatment Effects Based on Propensity Scores.” The Stata Journal 2(4): 358–377.
Bernard A.B., and J.B. Jensen (2004) “Why Some Firms Export”, Review of Economics and Statistics 86: 561–69.
Bernard, A. and J.B. Jensen (1999) “Exceptional Exporter Performance: Cause, Effect, or Both?” Journal of International Economics 47(1): 1–25.
Bernard, AB., Eaton, J., Jensen JB. and S.S. Kortum (2003) “Plants and Productivity in International Trade.” American Economic Review 93: 1268–90.
Blalock, G. and P.J. Gertler (2004) “Learning from Exporting Revisited in a Less Developed Setting.” Journal of Development Economics 75(2): 397-416.
Blundell, R., and M.C. Dias (2000) “Evaluation Methods for Non-Experimental Data.” Fiscal Studies 21(4): 427–468.
Burstein, A. and M. J. Melitz (2011) “Trade Liberalization and Firm Dynamics.” National Bureau of Economic Research.
Bustos, P. (2011) “Trade Liberalization, Exports, and Technology Upgrading: Evidence on the Impact of MERCOSUR on Argentinian Firms.” The American Economic Review 101(1): 304-340.
Caliendo, M., Kopeinig, S., 2008. “Some Practical Guidance for the Implementation of Propensity Score Matching.” Journal of Economic Surveys 22: 31– 72.
Castellani, D., F. Serti, and C. Tomasi (2010) “Firms in International Trade: Importers’ and Exporters’ Heterogeneity in Italian Manufacturing Industry.” The World Economy 33(3): 424–457.
Chaney, T. (2008) “Distorted Gravity – The Intensive and Extensive Margins of International Trade.” American Economic Review 98(4): 1707–1721.
Cirera, X., Lederman, D., Máñez, J. A., Rochina, M. E., and J.A. Sanchis (2015) “The Export-Productivity Link for Brazilian Manufacturing Firms.” Economics Discussion Papers, No 2015-26, Kiel Institute for the World Economy.
Clerides, S., S. Lach, and J. Tybout (1998) “Is Learning by Exporting Important? Microdynamic Evidence from Colombia Mexico and Morocco.” Quarterly Journal of Economics 113(3): 903-948.
Costantini, J. and M. Melitz (2007) “The Dynamics of Firm-Level Adjustment to Trade Liberalization.” The Organization of Firms in A Global Economy 107: 141.
Damijan, J.P., C. Kostevc and S. Polanec (2010) “From Innovation to Exporting or Vice Versa?” World Economy 33: 374-398.
Damijan, J. P. and Č. Kostevc (2006). "Learning-by-exporting: Continuous productivity improvements or capacity utilization effects? Evidence from Slovenian firms." Review of World Economics 142(3): 599-614.
De Loecker, J. (2010) “A Note on Detecting Learning by Exporting.” National Bureau of Economic Research.
De Loecker, J. (2011) “Product differentiation, multiproduct firms, and estimating the impact of trade liberalization on productivity.” Econometrica: 1407-1451.
De Loecker, J. (2007) “Do Exports Generate Higher Productivity? Evidence from Slovenia.” Journal of International Economics 73(1): 69–98.
De Loecker, J. and F. Warzynski (2012) “Markups and Firm-Level Export Status.” The American Economic Review 102(6): 24-37.
Dehejia, H.R., and S. Wahba (2002) “Propensity Score Matching Methods for Non-Experimental Causal Studies.” Review of Economics and Statistics 84(1): 151–161.
Eckel, C., and J.P. Neary (2010) “Multi-Product Firms and Flexible Manufacturing in the Global Economy." The Review of Economic Studies 77(1): 188-217.
Eckel, C., Iacovone, L., Javorcik, B., and J.P. Neary (2015) “Multi-Product Firms at Home and Away: Cost-versus Quality-Based Competence.” Journal of International Economics 95(2): 216-232.
Eliasson, K., et al. (2009) “Do Firms Learn by Exporting or Learn to Export? Evidence from small and Medium-sized Enterprises (SMEs) in Swedish manufacturing (Working Paper No. 15). Swedish Business School, Orebro University.
Fernandes, A. M. (2007). “Trade Policy, Trade Volumes and Plant-Level Productivity in Colombian Manufacturing Industries.” Journal of International Economics 71(1): 52-71.
Greenaway, D. and R. Kneller (2007) “Firm Heterogeneity, Exporting and Foreign Direct Investment.” Economic Journal, 117: 134-161.
Greenaway, D., et al. (2005) “Exporting may not always boost firm productivity.” Review of World Economics 141(4): 561-582.
Ito, K. and S. Lechevalier (2010) “Why Some Firms Persistently Out-Perform Others: Investigating the Interactions Between Innovation and Exporting Strategies.” Industrial and Corporate Change 19: 1997-2039.
Levinsohn, J. and A. Petrin (2003) “Estimating Production Functions using Inputs to Control for Unobservables.” Review of Economic Studies 70: 17-42.
Manjón, M., et al. (2013) “Reconsidering learning by exporting.” Review of World Economics 149(1): 5-22.
Mayer, M. and G. Ottaviano (2007) “The Happy Few: The Internationalisation of European Firms. New Facts Based on Firm-level Evidence.” Working Paper Volume 3, Bruegel Blueprint Series.
Melitz, M.J. (2003), “The Impact of Trade on Intra-Industry Reallocations and Aggregate Industry Productivity”, Econometrica, 71(6): 1695–1725.
Muûls, M. and M. Pisu (2009) “Imports and Exports at the Level of the Firm: Evidence from Belgium.” The World Economy 32(5): 692-734.
Nocke, V., and S. Yeaple (2006) “Globalization and Endogenous Firm Scope.” No. w12322. National Bureau of Economic Research.
Pär, H. and L. N. Nan (2004) “Exports as an Indicator on or Promoter of Successful Swedish Manufacturing Firms in the 1990s” Review of World Economics 140(3): 415-445.
Pisu, M (2008) “Export Destinations and Learning-by-Exporting: Evidence from Belgium,” National Bank of Belgium, Working Paper, 140.
Serti, F. and C. Tomasi (2008) “Self-selection and Post-entry Effects of Exports. Evidence from Italian Manufacturing Firms,” Review of World Economics 144(4): 660-94.
Serti, F. and C. Tomasi (2008) “Self-selection and Post-entry Effects of Exports: Evidence from Italian Manufacturing Firms.” Review of World Economics 144(4): 660-694.
Serti, F., Tomasi, C., and Zanfei, A. (2010), “Who Trades with Whom? Exploring the Links between Firms’ International Activities, Skills, and Wages.” Review of International Economics 18(5): 951–971.
Silva, A., Afonso, O. and A.P. Africano (2013) “Economic Performance and International Trade Engagement: The Case of Portuguese Manufacturing Firms.” International Economics and Economic Policy 10: 521–547.
Silva, A., et al. (2012) “Learning-by-exporting: What We Know and What We Would Like to Know.” The International Trade Journal 26(3): 255-288.
Trofimenko, N. (2008) “Learning by Exporting: Does It Matter Where one Learns? Evidence from Colombian Manufacturing Firms.” Economic Development and Cultural Change 56(4): 871-894.
Van Biesebroeck, J. (2005). “Exporting raises productivity in sub-Saharan African manufacturing firms.” Journal of International Economics 67(2): 373-391.
Verhoogen, E. A. (2008) “Trade, Quality Upgrading, and Wage Inequality in the Mexican Manufacturing Sector.” The Quarterly Journal of Economics 123(2): 489-530.
Wagner, J. (2007) “Exports and Productivity: A Survey of the Evidence from Firm-Level Data.” The World Economy 30(1): 60–82.
Wilhelmsson F., and K. Kozlov, (2007) “Exports and productivity of Russian firms: In search of causality", Economic Change and Restructuring, 40(4): 361-385.
Yasar, M., and R.M. Rejesus (2005) “Exporting Status and Firm Performance: Evidence from a Matched Sample.” Economics Letters 88 (3): 397–402.