Effects of Injection Conditions in the Semi-Solid Injection Process
on the Fluidity of JIS AC4CH Aluminum Alloy
+Yuichiro Murakami
1, Kenji Miwa
2, Masayuki Kito
3, Takashi Honda
3,
Naoyuki Kanetake
4and Shuji Tada
11Solidification Processing Group, Materials Research Institute for Sustainable Development, National Institute of Advanced Industrial Science and Technology, Nagoya 463-8560, Japan 2Aichi Science and Technology Foundation, Kariya 448-0013, Japan
3Die Casting Engineering Section, Die Casting Department, Aisan Industry Co., Ltd., Obu 474-8588, Japan
4Materials, Physics and Energy Engineering, Graduate School of Engineering, Nagoya University, Nagoya 464-8603, Japan
The semi-solid process is viewed as a promising manufacturing method for producing nearly net-shaped metal products with low porosity and shrinkage. However, the semi-solid slurry is inferior to liquid state in terms offluidity; thus, the semi-solid process exhibits low formability. Therefore, improving thefluidity of the semi-solid slurry is an important issue. To address the issue, we attempted to improve thefluidity by applying shear stress on the slurry at the gate of the mold. In this study, the effect of shear rate on thefluidity of the semi-solid slurry of the AC4CH aluminum alloy was investigated. The shear rate at the gate was controlled by changing the thickness of the gate to 1.0, 2.2, 3.1 and 4.0 mm. Thefluidity was evaluated by injecting through a narrow gate into a spiral cavity in terms of the length that hasflowed into the cavity. The microstructures were observed by optical microscopy. The roundness and diameter of the solid particles in the specimens were measured by image analysis. According to the results, thefluidity increased with increasing gate velocity or increasing shear rate at identical injection velocities. However, both the mean roundness and diameter of the solid particles in the specimen decreased with increase in the shear rate obtained by decreasing the gate thickness. Therefore, the slurry composed offine spherical solid particles could be obtained with a high shear rate. Additionally, both the mean particle roundness and diameter correlated withfluidity. These results suggested that thefluidity of the slurry improved with increase in the gate velocity and the shear rate because the viscosity of slurry decreased. As mentioned previously, thefluidity of semi-solid slurry could be improved by controlling the gate velocity and shear rate. It is expected that this method can enable the production of semi-solid forming products with complex configurations. [doi:10.2320/matertrans.F-M2013812]
(Received February 27, 2013; Accepted June 6, 2013; Published July 19, 2013)
Keywords: aluminum alloy, semi-solid injection process,fluidity, microstructure, shear rate, forming condition
1. Introduction
Aluminum alloys are light weight and exhibit high specific strengths. Hence, the materials are widely used in automo-biles, electronic equipment, communication equipment and accurate instruments. In the automobile industry, specifically, an improvement of fuel efficiency by reducing the body weight of the vehicle is a key issue. The range of application of Al alloys in vehicle electronics and electroactuation is extending in recent years, although the amount of heat generated from them is also increasing with enhancement in the performance. Hence, increasing the use of aluminum alloys is expected to increase the radiation performance. To produce aluminum products with complex configurations, high pressure die casting (HPDC) is most frequently used. In HPDC, molten metal is injected into the die with high velocity and high pressure that enables mass production at low costs. However, the products made by HPDC are incapable of being subjected to heat treatment and welding and possess lower reliability in strength.
Semi-solid processing is the forming method, which is carried out during the liquid-solid coexistence of the metal, at a stage when the material has a higher viscosity and lower solidification shrinkage than liquid metal. In this process, the amount of casting defects owing to air traps can be reduced because of the higher viscosity of the materials. Additionally, products with high dimensional accuracy and reduced
shrinkage porosity can be obtained owing to the lower solidification shrinkage than that in casting processes. Hence, recent studies have attempted to apply this process to the forming of aluminum alloys1,2) and magnesium alloys.3,4)
However, semi-solid metals possess higher viscosity and also lower temperatures than the liquid state and hence exhibit low fluidity, which causes low formability. In semi-solid materials, the morphology (such as the diameter and roundness) of solid the particles in the slurry has a profound effect on the viscosity and fluidity.5) The semi-solid slurry with the fine and spherical solid particles distributed in the liquid phase exhibits highfluidity.
We had previously developed a new semi-solid injection process that could be used in the forming of magnesium alloys.610)In this process, a magnesium billet was heated in
an injection cylinder to a temperature to reach a semi-solid state. Then, the semi-solid metal was subjected to shear stress when injected through a nozzle into a mold so that the solid particles in the semi-solid slurry become deformed into fine and spherical particles. Hence, the slurry exhibited high fluidity. However, this process cannot be applied to aluminum alloys because semi-solid aluminum alloys show high reactivity with the injection cylinder.
Therefore, we developed a new configuration in which the gate is placed at the entrance of the mold in a conventional HPDC machine. Then, the slurry was subjected to a shear stress and it was expected that the solid particles becomefine and spherical. Until now, there has been some research on the effect of morphology of the solid particles before forming on the fluidity11,12)and on the effect of dimensions of the gate
+This Paper was Originally Published in Japanese in J. JFS84(2012) 605 611.
on the fluidity.13) However, hardly any reports exist in the
literature on the effect of high shear stress onfluidity. In this study, the fluidity of the semi-solid aluminum alloy AC4C (A356) slurry was investigated in the semi-solid die casting with various gate thicknesses and injection velocities. Additionally, we attempted to correlate the character of the solid particles and fluidity of the slurry by measuring the diameters and the roundness of solid particles.
2. Experimental Procedure
2.1 Examination of the microstructure of the slurry before injection
Al7 mass%Si0.3 mass%Mg alloy (AC4CH in the JIS) was used in the experiments. The alloy is the equivalent of A356 by the ASTM standards. The semi-solid slurry used for the experiments was prepared by the Nanocast method.14)
First, the fraction solid and the morphology of the solid particles in the slurry before injection were examined in the following way.
Approximately 250 g of molten AC4CH alloy with adjusted temperature was poured into a stainless steel cup of 38.7 mm in inner diameter, 90.0 mm in height and 1.2 mm in thickness. BN release agent was sprayed into the internal surface to prevent reaction between the molten metal and the cup. The cup drew heat from the molten alloy such that the temperature of the molten alloy fell to generate semi-solids. Electromagnetic stirring was first applied in the vertical direction for 5 s and then rotationally for 10 s during cooling. After holding for a given time period, the semi-solid slurry was obtained. As the reference condition, the pouring temperature and holding time were set to 700°C and 15 s, respectively. To examine the microstructure of the semi-solid slurry made by the above method, the slurry was cooled rapidly by water cooling.
First, to estimate the effect of pouring temperature, samples were prepared by changing the pouring temperature to 680, 690 and 700°C. Next, to examine the effect of dispersion of time till when the slurry was put into the HPDC machine, the samples were prepared by changing the holding time to 15, 25 and 35 s. Additionally, a sample held for 30 s after pouring the molten metal without electromagnetic stirring, was prepared to examine the effect of the electro-magnetic stirring.
The microstructures of these specimens were observed at the top, middle and bottom by optical microscopy. The specimens were molded in epoxy resin at room temperature and polished by grinding with SiC paper and then polished with diamond paste. Then, the specimens were etched in a 0.5%HF solution.
2.2 Fluidity test
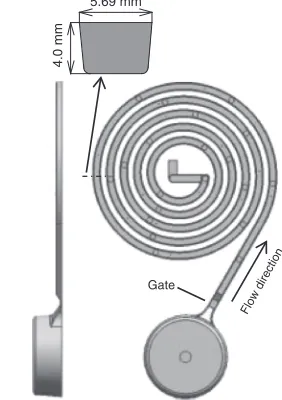
Fluidity tests were carried out using a 1226 kN horizontal HPDC machine. The semi-solid slurry was injected into the permanent mold containing spiral cavities that were 5.7 mm in width, 1350 mm in length and 4.0 mm in thickness. A schematic of the specimen is shown in Fig. 1. The shear rate was controlled by changing the thickness of the gate from 1.0 to 2.2, 3.1 and 4.0 mm and also by changing the injection velocity (plunger velocity), which was set to either 0.1 or
0.35 m·s¹1. The plunger diameter was 50 mm. The casting pressure (i.e., thefinal pressure afterfilling in the cavity) was set at either 37 or 80 MPa. The AC4CH alloy slurry was made by the Nanocast method, as described in the previous section. The slurry was put into the sleeve so that the bottom of the slurry touched the plunger. The fraction solid was constant at about 0.55. The time period from the completion of electromagnetic stirring to injection ranged from 13 to 20 s and the average time was 15 s. For comparison, thefluidity of the fully liquid phase was measured in the same manner as in a conventional HPDC process. The molten AC4CH alloy at 700°C was directly poured into the sleeve and the specimen was cast.
Fluidity was evaluated as the length of the spiral from the spiral tip to the gate. Moreover, metallographic observation was conducted to the cross sections perpendicular to theflow direction.
3. Results
3.1 Microstructure of slurry before injection
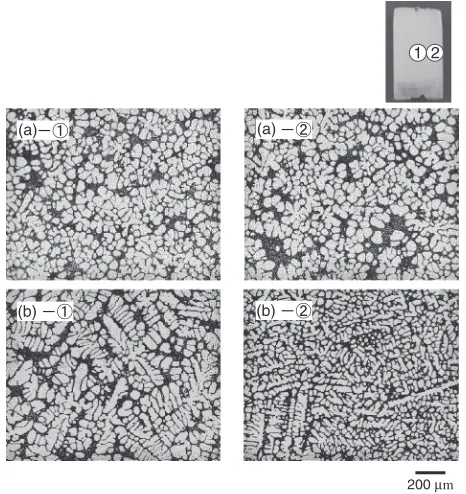
The microstructure of the reference sample, which was prepared at the pouring temperature of 700°C and holding time of 15 s, is shown in Fig. 2(a). The microstructure of the sample without electromagnetic stirring (holding time after pouring was 30 s) is shown for comparison in Fig. 2(b). These micrographs show that the primary¡-Al particles were dispersed in the matrix (eutectic¡-Al and Si) of the alloys. The images suggest that the primary ¡-Al particles were in the solid phase and the matrix was in the liquid phase before samples were cooled rapidly. The microstructures in both the center ((a)-1) and the surface ((a)-2) of the slurry made by Nanocast method showed that the ¡-Al particles were dispersed in the liquid phase. However, the microstructures of the slurry made without electromagnetic stirring showed the coarse¡-Al dendrite morphology in center portion ((b)-1) and thefine¡-Al dendrite morphology on the surface ((b)-2). It is considered that when the slurry is made without electromagnetic stirring, the molten metal cooled from the
Gate 5.69 mm
4.0 mm
Flow direct ion
[image:2.595.348.489.74.274.2]interface of the stainless steel cup and the cooling rate of the metal was higher at the surface and lower at the center. However, when the Nanocast method was used, the growth of dendrite may have been repressed caused uniform cooling because the molten metal was cooled with electromagnetic stirring. Consequently, slurry with dispersed solid particles with uniform size and shape was obtained.
Next, the fraction solids of the samples were calculated from the image analysis of the microstructures. To estimate the effect of the pouring temperature, the fraction solid of the samples were prepared by changing the pouring temperature, which were set to 680, 690 and 700°C, as shown in Fig. 3(a). Furthermore, the relationship between the holding time and fraction solid was shown in Fig. 3(b). In either sample, the fraction solid was higher at the top of the slurry. The fraction solids were not significantly different at the same position
when the pouring temperature was set in the range of 680 to 700°C. However, when the holding time was altered, the fraction solids changed. While the fraction solids were approximately identical at holding times of 15 and 25 s, the fraction solid increased by about 0.1, when the holding time was 35 s.
The fraction solid at the top of the slurry was also higher than that in the other areas and the slurry was put into the sleeve so that the bottom of the slurry touched the plunger. The variation in the fraction of the solid and shape is predicted to create an adverse effect on the fluidity. In this study, a capture space was created between the sleeve and the mold as a vacancy of 15 mm in height. The top of the slurry was trapped by this capture space and thus the slurry of low quality remained as a biscuit, while only the homogeneous region was injected into the mold. Additionally, the time from the completion of the electromagnetic stirring to the beginning of injection ranged from 13 to 20 s. Hence, the variation in the time to injection was considered to be negligible.
3.2 Fluidity test
The relationship between the gate thickness and fluidity length is shown in Fig. 4. In the case of samples injected in the liquid phase (Fig. 4(e)), the fluidity length slightly decreased with decrease in the gate thickness from 4.0 to 2.2 mm, and slightly increased when the gate thickness was 1.0 mm. If the gate thickness decreased, the resistance of the slurry toflow may be expected to increase. Also, decreasing the gate thickness is thought to reduce the time to fully solidify the slurry at the gate. These effects are predicted to work against the flow of the slurry. Meanwhile, the gate velocity increased with decrease in gate thickness; hence, thefluidity length is expected to increase. Thus, thefluidity length decreased when the gate thickness was 2.2 mm during injection of the liquid phase. However, during semi-solid casting (Figs. 4(a)4(d)), the fluidity showed a tendency to increase with decrease in the gate thickness. Though, without the reduction area of the gate (with the gate thickness of 4.0 mm), the fluidity length was greater than the gate thickness of 3.1 mm. The effect of reducing the gate thickness in the semi-solid casting was greater than that in the case of injecting the liquid phase.
(a) (a)
(b) (b)
200 µm 1 2
Fig. 2 Microstructures of the samples at the middle part along the vertical direction and poured at the pouring temperature of 700°C. (a) Nanocast slurry; electromagnetic stirring time: 5 s (vertical direction), 10 s (radial direction) and holding time: 15 s. (b) Sample without electromagnetic stirring with holding time: 30 s.
0.40 0.45 0.50 0.55 0.60 0.65 0.70
670 680 690 700
Fraction solid
Pouring temperature (°C)
10 20 30 40 50
Holding time after electromagnetic stirring (s) Top-Center
Top-Surface Middle-Center Middle-Surface Bottom-Center Bottom-Surface
(a) (b)
1 2
3 4
5 6
[image:3.595.53.286.281.528.2] [image:3.595.95.502.605.760.2]Moreover, the fluidity length at the injection speed of 0.35 m·s¹1 was greater than that at the injection speed of
0.1 m·s¹1. When the injection speed increased, the flow
volume per unit time increased and the flow velocity also increased. Hence, increasing the flow distance with time to reach the temperature of flow cessation is thought to cause the increase in thefluidity length.
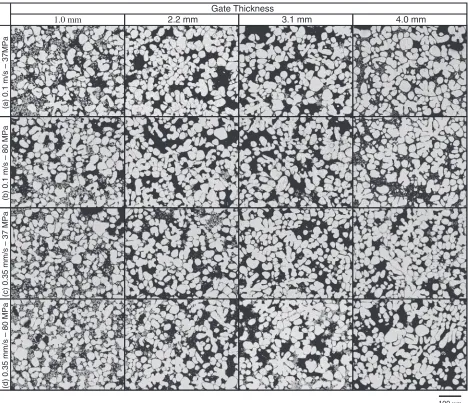
[image:4.595.58.278.172.328.2]The microstructures of the central portion of the test specimen, 100 mm from the gate, are shown in Fig. 5. These micrographs show that the primary ¡-Al particles were dispersed in the matrix (eutectic¡-Al and Si) of the alloy as discussed in the previous section. These images also suggest that when the slurry was injected, primary¡-Al particles were in the solid phase and the matrix was in the liquid phase. The dispersion of the solid particles in the samples shown in Fig. 5 became more uniform when compared to that in the slurry before injection (shown in Fig. 2(a)). In addition, the particles also became spherical. Additionally, at the same injection velocity and casting pressure, the solid particles appeared to becomefine and spherical with decreasing gate thickness. To quantitatively evaluate the size and shape of the solid particles, the particle roundnessR and the particle diameter d [µm] were measured by image analysis. The roundness of a particle was calculated by the following equation.15)
R¼L2=ð4³AÞ
In the above expression, L [µm] and A [µm2] are the boundary length and area of the solid particle, respectively. WhenR=1, the particle is a perfect sphere and the value of
0 200 400 600 800 1000 1200
0.0 1.0 2.0 3.0 4.0 5.0
Fluidity length (mm)
Gate thickness (mm) (a)0.1 m/s-37 MPa (b)0.1 m/s-80 MPa (c)0.35 m/s-37 MPa (d)0.35 m/s-80 MPa (e)0.1 m/s-37 MPa, Liquid
Semisolid
Fig. 4 Relation between gate thickness andfluidity length.
1.0 mm 2.2 mm 3.1 mm 4.0 mm
100 µm
(a) 0.1 m/s – 37MPa
(d) 0.35 mm/s – 80 MPa
(c) 0.35 mm/s – 37 MPa
(b) 0.1 m/s – 80 MPa
Gate Thickness
[image:4.595.65.533.363.766.2]R increases if the shape of the particle deviates from being spherical. Next, the particle diameter (equivalent circle diameter) was calculated by the following equation.
d¼2pffiffiffiffiffiffiffiffiffiA=³
The area-weighted mean roundness Rsand area-weighted
mean diameter ds [µm] were also calculated from the
following equations.
Rs¼RiAi=Ai;
ds¼diAi=Ai
di[µm],Ai[µm2] andRiare the diameter, area and roundness
of a solid particle, respectively.
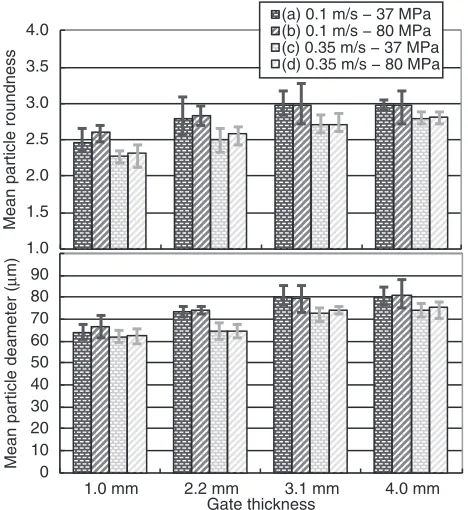
The mean particle roundness and the mean particle diameter of the specimens calculated from the above expressions are shown in Fig. 6. Both the mean particle
roundness and the mean particle diameter decreased with decrease in the gate thickness at the same injection velocity. This means that the solid particles becamefine and spherical. Moreover, both the mean particle roundness and the mean particle diameter at the injection velocity of 0.35 m·s¹1were smaller than that at the injection velocity of 0.1 m·s¹1. Meanwhile, the casting pressure had little direct effect on both the mean particle roundness and the mean particle diameter.
4. Discussion
The aim of this process is to make the solid particles in the slurry becomefine and spherical by subjecting the slurry to a shear stress at the gate with the reduction of the cross sectional area. Therefore, the effects of gate velocity and shear rate on the fluidity length and the morphology of the solid particles were evaluated as follows.
The gate velocity at a rectangular cross-section was calculated by the following equation.
v¼Q=ðBHÞ
Qis the volumeflow [m3/s] andBandHare the length of the long side and the short side of the rectangle [m], respectively. Furthermore, the apparent shear rate£of the non-Newtonian fluidflowing at the rectangular cross section is expressed by the following equation.
£¼6Q=ðBH2Þ
The effects of both the gate velocity and shear rate calculated by the above expressions on thefluidity length are shown in Fig. 7. In the liquid state, the fluidity length was decreased with increase in both the gate velocity and the shear rate until the gate velocity was 15 m·s¹1, while the fluidity length
increased at the gate velocity of 31 m·s¹1. Meanwhile, in the
semi-solid state, thefluidity length increased with increase in the gate velocity, except when the gate thickness was 4.0 mm. In addition, when the injection speed was 0.35 m·s¹1, the fluidity length was greater than 37 MPa at the casting pressure of 80 MPa.
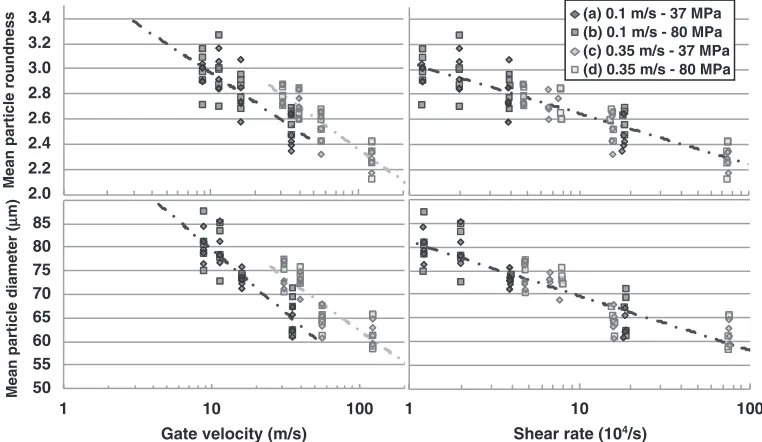
The relationships between the gate velocity or the shear rate at the gate and the mean roundness or the mean diameter
0 100 200 300 400 500 600 700 800 900
1 10 100
Fluidity length (mm)
Gate Velocity (m/s)
1 10 100
Shear rate (104/s)
(a) 0.1 m/s - 37 MPa (b) 0.1 m/s - 80 MPa (c) 0.35 m/s - 37 MPa (d) 0.35 m/s - 80 MPa (e) 0.1 m/s - 37 MPa, LiquidSemisolid
Fig. 7 Effects of both gate velocity and shear rate at gate onfluidity length. 0
10 20 30 40 50 60 70 80 90
1.0 mm 2.2 mm 3.1 mm 4.0 mm
Mean particle deameter (
µ
m)
Gate thickness 1.0
1.5 2.0 2.5 3.0 3.5 4.0
Mean particle roundness
(a) 0.1 m/s − 37 MPa (b) 0.1 m/s − 80 MPa (c) 0.35 m/s − 37 MPa (d) 0.35 m/s − 80 MPa
[image:5.595.53.287.277.532.2] [image:5.595.100.492.582.771.2]of the solid particles are shown in Fig. 8. Both the mean particle roundness and the mean particle diameter decreased with increase in the gate velocity and the shear rate, which indicates that the solid particles became fine and spherical. Moreover, at the same gate velocity, the difference in the casting pressure had hardly any effect on the morphology of the solid particles, while the mean particle roundness and the mean particle diameter at the injection speed of 0.35 m·s¹1
were smaller than that at the injection speed of 0.1 m·s¹1. The
relationship between the shear rate and both the mean particle roundness and the mean particle diameter had the same tendency even if the injection speed and the casting pressure was different. An apparent viscosity of the slurry is expressed as the ratio of shear stress and shear rate. In this study, the conditions under which the slurry was prepared before injection were the same; hence, the apparent viscosity can be expected to be constant. Therefore, the difference in the shear stress is considered to depend on the difference in the shear rate. Hence, the morphology of the solid particles is thought to vary because of the difference in the shear rate. Figure 9 shows the relationship between the mean particle roundness, the mean particle diameter and thefluidity length. If the same
injection velocity, i.e., the same flow velocity was used, the fluidity length increased with decrease in the mean particle roundness or the mean particle diameter.
The viscosity of the semi-solid slurry was affected by the morphology of the solid particles, i.e., the slurry comprising particles with small diameter and low specific surface area showed low viscosity.5,16)In this study, with increase in the
shear rate at the gate, the mean particle diameter of the solid particles decreased while the specific surface area of the solid particles decreased because the mean particle roundness decreased. Hence, it is contemplated that the viscosity of the slurry decreased with increase in the shear rate. Thus, the fluid length was thought to be enhanced in the semi-solid state rather than in the liquid phase.
In Fig. 7, the fluidity was inclined to be increased with increase in the casting pressure at high shear rate areas greater than 2©105s¹1. At this area, the solid particles werefine and spherical, i.e., the mean particle diameter was about 60 µm and the mean particle roundness was smaller than 2.5. The fluidity length may have increased by the application of the final pressure after filling the cavity because the slurry had fluidity after the cessation of flow owing to the decreased
50 55 60 65 70 75 80 85
1 10 100
Mean particle diameter (
µµ
m)
Gate velocity (m/s) 2.0
2.2 2.4 2.6 2.8 3.0 3.2 3.4
Mean particle roundness
1 10 100
Shear rate (104/s)
(a) 0.1 m/s - 37 MPa (b) 0.1 m/s - 80 MPa (c) 0.35 m/s - 37 MPa (d) 0.35 m/s - 80 MPa
Fig. 8 Effects of both gate velocity and shear rate at gate on mean roundness and diameter of the primary¡-Al particles.
0 100 200 300 400 500 600 700 800
1.0 1.5 2.0 2.5 3.0
Fluidity length (mm)
Mean particle roundness
50 60 70 80 90
Mean particle diameter (µµm) (a) 0.1 m/s - 37 MPa
(b) 0.1 m/s - 80 MPa (c) 0.35 m/s - 37 MPa (d) 0.35 m/s - 80 MPa
[image:6.595.107.488.72.293.2] [image:6.595.103.488.332.490.2]viscosity. This result suggests that the possibility of reduction in the shrinkage cavity and improvement of dimensional accuracy can be obtained by applying a casting pressure.
5. Conclusion
The fluidity test was carried out by using the HPDC machine. The AC4CH semi-solid slurry was injected into the mold with a spiral cavity and the shear stress was applied at the gate installed between the sleeve and the mold. The microstructures of the samples were observed and the morphology of the particles was compared with the gate velocity and shear stress at the gate. From the results of this study, the following conclusions were drawn:
(1) Thefluidity increased with increase in gate velocity and shear rate owing to decrease in gate thickness to values smaller than 2.2 mm.
(2) The mean diameter and mean roundness of the solid particles correlated with the shear rate at the gate. Both the mean particle diameter and the mean particle roundness decreased with increase in the shear rate and the solid particles became fine and spherical. (3) The fluidity increased with increase in the casting
pressure when the mean diameter was about 60 µm and the mean roundness was smaller than 2.5 by applying shear stress above a particular threshold.
REFERENCES
1) C. G. Kang, J. S. Choi and D. W. Kang:J. Mater. Process. Technol.73 (1998) 289.
2) S. Nafisi and R. Ghomashchi:J. Mater. Process. Technol.174(2006) 371.
3) Z. Fan, G. Liu and Y. Wang:J. Mater. Sci.41(2006) 3631. 4) F. Czerwinski:Scr. Mater.48(2003) 327.
5) M. Hirai, K. Takebayashi, Y. Yoshikawa and R. Yamaguchi:ISIJ Int.33 (1993) 405.
6) K. Miwa, R. S. Rachmat, T. Tamura and K. Sakaguchi: J. JFS 78 (2006) 193.
7) R. S. Rachmat, T. Tamura and K. Miwa:Solid State Phenom.116117 (2006) 534.
8) Y. Murakami, N. Omura, M. G. Li, T. Tamura, S. Tada and K. Miwa: Magnesium Technol. 2011, (2011) p. 107.
9) Y. Murakami, N. Omura, M. G. Li, T. Tamura and K. Miwa:Mater.
Trans.53(2012) 10901093.
10) Y. Murakami, K. Miwa, N. Omura and S. Tada:Mater. Trans.53(2012)
17751781.
11) E. de Freitas, M. Ferrante, C. T. Ruckert and W. W. Bose Filho:Mater.
Sci. Eng. A479(2008) 171.
12) H. Mirzadeh and B. Niroumand:J. Mater. Process. Technol.209(2009) 4977.
13) C. G. Kang, S. M. Lee and B.-M. Kim:J. Mater. Process. Technol.204 (2008) 8.
14) M. Itamura, C. P. Hong and J. M. Kim: J. JFS77(2005) 537. 15) V. Mikli, H. Käerdi, P. Kulu and M. Besterci: Proc. Estonian Acad. Sci.
Eng.7(2001) 2234.