Effect of Coat Permeability on Temperature Drop of Molten Aluminum Alloy
during Mold Filling in Expendable Pattern Casting Process
Sadatoshi Koroyasu
1and Akira Ikenaga
21Department of Mechanical and Precision Systems, School of Science and Engineering, Teikyo University, Utsunomiya 320-8551, Japan
2Department of Metallurgy and Materials Science, Graduate School of Engineering, Osaka Prefecture University, Sakai 599-8531, Japan
In the expendable pattern casting (EPC) process for the aluminum alloy casting, the thermal decomposition rate of the expendable pattern is smaller than the cast iron, therefore the misrun by the temperature drop at the melt surface occurs easily. This study takes account of the control of the heat release to the mold to investigate numerically and experimentally the effect of the coat permeability on the molten aluminum alloy temperature during moldfilling in the EPC process. An aluminum alloy plate was cast by the EPC process, and the temperature change of the melt surface to the meltflow direction was measured. The use of high permeability coat led to a higher melt velocity and a smaller temperature drop at the melt surface than the case of the normal permeability coat. The temperature of molten metalfilling into the cavity was numerically simulated, and the obtained temperature drop at the melt surface agreed relatively well with the experimental values.
[doi:10.2320/matertrans.M2011242]
(Received August 9, 2011; Accepted October 12, 2011; Published November 30, 2011)
Keywords: expendable pattern casting process, aluminum alloy, moldfilling, coat, permeability
1. Introduction
Large amounts of aluminum alloy have been used for high fuel efficiency in automobile parts. The expendable pattern casting (EPC) process is very attractive, particularly in the casting of thin-wall components with a complex shape such as automobile parts.1,2) However, when the aluminum alloy was cast by the EPC process, the low molten metal temperature resulted in a lower thermal decomposition rate of the expendable polystyrene (EPS) pattern and a lower melt velocity than the cast iron. Therefore, particularly at the melt surface, the time of heat release to the mold becomes long, and the misrun by the temperature drop occurs easily. There is comparatively little research on thefluidity mechanism of the molten metal3,4) and the heat transfer from the molten metal to the mold5,6) in the EPC process.
In this work, by taking account of the control of the heat release to the mold through the coat, two kinds of approaches for the coat were carried out. Thefirst method that has been reported5,6)is the application of a high insulating coat for the heat release rate decrease to the mold. The use of a high insulating coat led to a smaller temperature drop at the melt surface than in the case of the normal coat. The second method examined in this paper is the application of a high permeability coat for shortening the heat release time by the increase of the melt velocity. This paper examines exper-imentally and numerically the effect on the decrease in the melt temperature drop by using a high permeability coat. The numerical predictions for the temperature of the molten metal filling into the cavity were obtained and compared with the experimental results of the melt surface temperature.
2. Experimental Procedure
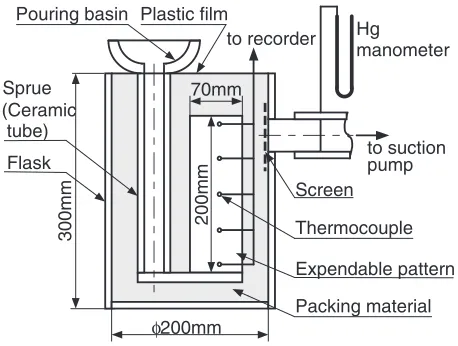
Figure 1 shows the schematic diagram for the casting apparatus used in experiments which is similar to the previous report.6)The steel moldflask is a cylindrical vessel
with the inside diameter of 200 mm and depth of 300 mm. The EPS pattern has a plate shape of 70 mm wide, 200 mm high and 10 mm thick, and has an expansion ratio of 60. The cluster of the bottom pouring system was assembled.
Three kinds of coat were used in this study as shown in Table 1. The first coat is the silica base coat which is generally used in cast iron etc. (normal coat). The second coat is the silica base coat with a high permeability which is
Thermocouple
Expendable pattern
Packing material Screen
to suction pump to recorder
Flask Sprue (Ceramic tube)
Pouring basin
Hg
manometer
φ200mm 70mm
200mm
300mm
Plastic film
Fig. 1 Schematic diagram of casting apparatus.
Table 1 Test coat used in experiments.
Test coat Main component
Thermal conductivity, /W·m¹1·K¹1
JIS Permeability,
K/cm2·cmH
2O¹1·min¹1
Normal coat Silica 0.53 1.2
High
permeability Silica 0.48 19.2
High insulating
Alumina,
Silica, Mica 0.17 0.40
[image:1.595.313.542.345.518.2]composed of large particles (high permeability coat). The JIS permeability7)of a high permeability coat is about 20 times of the normal coat. The JIS coat permeability is the absolute number with the dimension of (cm2·cmH
2O¹1·min¹1) defined in the following equation using the coat thickness ¤cm, the volumetric gas flow rate per unit area vcm/min and the differential pressure "PcmH2O.
K¼¤v=P
The thermal conductivity of a high permeability coat is almost the same as the normal coat, because both coats are silica base. The third coat is the mica base coat with a high void fraction and a high heat insulation for light metals such as an aluminum alloy (high insulating coat), and was for examining the effect of a coat insulating in the previous work.5,6)The thermal conductivity of the high insulating coat is about 1/3 of the normal coat5) and the permeability is about 1/3 of the normal coat. The thermal conductivities of the coat in Table 1 were measured by the transient hot wire method8)based on JIS R2618. These values of the thermal conductivity are not largely different compared with the values in the previous study5)which were estimated from the relationship between the cooling rate of the molten aluminum alloy and the coat thickness using the metal mold coated by the test coat. Each coat was coated so that the coat thickness after drying was about 1 mm.
The silica sand with AFS grain fineness number 62 was poured into theflask. AC2A in the JIS aluminum alloy was melted in the high frequency electric induction furnace and directly cast from the furnace. The pouring temperature was set at about 1073 K. The atmospheric pressure was applied as the condition of the pressure in theflask. In order to measure the temperature change of the melt surface relative to the melt flow direction, K-type thermocouples were set in the EPS pattern at 10, 55, 100, 145, 190 mm from the ingate as shown in Fig. 1. The thermocouple was 0.36 mm in diameter and shielded by a two-holed protection tube of 3 mm in the outside diameter, but the thermocouple junction was unprotected in order to decrease the response delay.
3. Analytical Procedure
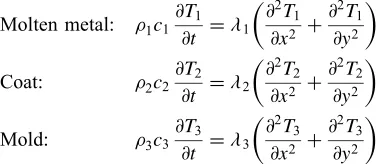
The case in which the molten aluminum alloy replaces above in the EPS pattern of a semi-infinite plate as shown in Fig. 2, was considered.6) In Fig. 2, x is the distance of a thickness direction from the center of the semi-infinite molten metal,d/2 is the half thickness andyis the distance from the inlet of the molten metal. In this case, the conductive heat transferred from the molten metal to the mold through the coat, can be formulated as:
Molten metal: μ1c1 @T1
@t ¼1 @2T
1 @x2 þ
@2T 1 @y2
Coat: μ2c2 @T2
@t ¼2 @ 2T2
@x2 þ @2T2
@y2
Mold: μ3c3 @T3
@t ¼3 @ 2T3
@x2 þ @2T3
@y2
wheretis the time,Tis the temperature,,candμshow the thermal conductivity, the specific heat and the density
respectively, and subscript 1, 2, and 3 show the value in the molten metal, the coat and the mold respectively. In the previous work,6) since the phenomenon in the short time during mold filling was considered, the heat transfer coefficient in the molten metal-coat interface was assumed to beh=2000 W/m2K without an air gap.9)However, since the calculated values of temperature change at the melt surface was considerably larger than the experimental data, in this work, this heat transfer coefficient was assumed to be
h=350 W/m2K considering the interface resistance of an air gap.9)In this analysis, because the phenomenon in the short time during mold filling is considered, most of the temper-ature change is in the molten metal-coat interface and the coat. Therefore, it was considered that the thermal resistance at the coat-mold interface was not significant. In the molten metal center (x=0) and the external wall of the mold, the adiabatic condition was applied. In the melt surface, the adiabatic condition was applied assuming that the effect of the heat loss by the thermal decomposition of the EPS pattern on the temperature drop at the melt surface was not significant.
[image:2.595.336.514.72.199.2]In order to consider the phenomenon during mold filling, for simplicity, the analysis was carried out only for the heat conduction without considering the solidification. Therefore, the range over the liquidus temperature is significant in the calculation result. As a numerical calculation method, the finite differential method was used. In this analysis, the following simplified method6) was applied for the molten metalflow. It was assumed that the melt surface moves step by step so that the melt surface agrees with the finite difference mesh. In the interval for the melt surface moving to the next mesh, the heat conduction calculation was carried out under the condition of fixed melt surface. The time in which melt surface moves to the next mesh was decided from the melt velocity.
Table 2 shows the main physical properties used in calculations. The values for a pure aluminum alloy were used for physical properties of the molten aluminum alloy at 973 K.9) The measured values by authors were used for a thermal conductivity and a bulk density of the dry sand packed bed10)and the literature data of the sand mold9)was used for a specific heat. The values shown in Table 1 were used for a thermal conductivity of the coat layer. The experimental values in this work were used for a melt velocity and a melt temperature at ingate and their values were assumed to be a constant value.
x
Coat
Ti=const. d/2
Mold
0 y
T1,λ1,ρ1,c1 T
3,λ3,ρ3,c3
δ
Molten metal
∂T/∂y=0
∂T/∂y =0
∂
T
/
∂
x
=0
∂
T
/
∂
x
=0
T2
λ2
ρ2 c2
L d/2
u
[image:2.595.49.239.675.757.2]4. Results and Discussion
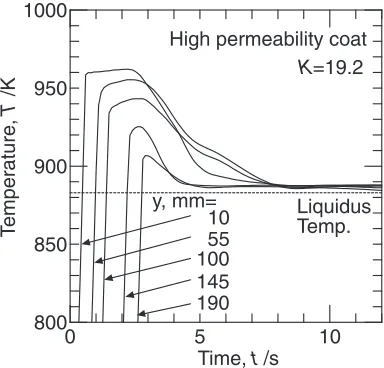
Figures 3 and 4 show the experimental data of the temperature change with the distance from the ingateyas a parameter for the normal coat and the high permeability coat, respectively. Figure 3 presents the experimental result shown in the previous report,6)and is for the comparison with the result of the high permeability coat shown in Fig. 4.
In Figs. 3 and 4, with increasing of the flow direction distancey, the temperature rising position deviates backward, and the maximum temperature after rising gradually
[image:3.595.324.528.71.261.2]decreases. Those maximum temperatures were defined as melt surface temperatures at the positiony. The average melt velocity can be defined from the time difference of the temperature rise at y=10 and 190 mm, and is calculated 27 mm/s for the normal coat shown in Fig. 3. The melt velocity in case of the high permeability coat shown in Fig. 4 is 72 mm/s, and larger than that for the normal coat shown in Fig. 3 because the coat permeability is larger than the normal coat.
In Fig. 3 for the normal coat, aty=145 and 190 mm, after the temperature rises, the melt temperature is almost constant without decreasing. The reason may be that the melt surface temperature has decreased to a liquidus temperature when the molten metal reached these positions. In Fig. 4 for the high permeability coat, though the melt surface temperature at
y=10 mm is an almost equal value as the normal coat shown in Fig. 3, the maximum temperature after rising is higher than the liquidus temperature even aty=190 mm, and higher than that for the normal coat as shown in Fig. 3.
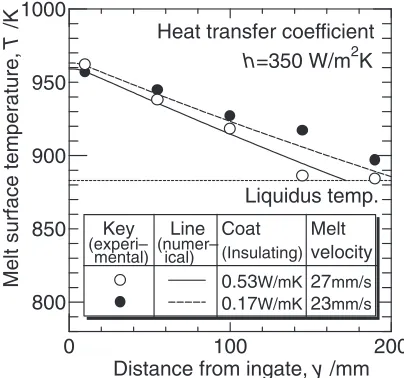
Figure 5 shows the melt surface temperature as a function of the distance from ingateyobtained from the temperature change in Figs. 3 and 4. The marks in the figure present the experimental values for the normal coat and the high permeability coat. The solid line and the broken line in this figure show the numerical predictions. These predictions were calculated by using h=350 W/m2K as a heat transfer coefficient in the molten metal-coat interface and the experimental values of the melt velocity, and by setting the melt temperature at the ingate so that the calculated temperature aty=10 mm is almost equal to the experimental value. With the increase of y, the melt surface temperature decreases. This degree of temperature drop to the meltflow direction for the high permeability coat is smaller than that for the normal coat. This can be explained as follows. It is considered that the melt velocity for the high permeability coat is larger, and the time in which the melt surface reached the arbitrary distance yis smaller than those values for the normal coat. Therefore the heat release time into the mold for the high permeability coat is shorter than that for the normal coat. There is no change of the melt surface temperature over 0
800 850 900 950 1000
Time, t /s
T
e
mperature,
T
/
K
Normal coat K=1.2 y /mm=
10 55
100
145 190
Liquidus Temp.
10 5
Fig. 3 Effect of distance from ingate on temperature curve for normal coat.
0 800 850 900 950 1000
Time, t /s
T
e
mperature,
T
/K
High permeability coat K=19.2
y, mm= 10 55 100 145 190
Liquidus Temp.
10 5
Fig. 4 Effect of distance from ingate on temperature curve for high permeability coat.
0 800 850 900 950 1000
Distance from ingate, y/mm
Melt surface temperature,
T
/K Heat transfer coefficient
Key Melt
(Perme– velocity
1.2 19.2
27mm/s
72mm/s ability)
(experi–
mental) (numer–ical)
Liquidus temp. h=350 W/m2K
200 100
Coat Line
Fig. 5 Effect of coat permeability on melt surface temperature. Table 2 Physical properties used in calculations.
Molten metal Sand mold
Thermal conductivity,
/W·m¹1·K¹1 100 0.44
Specific heat,
c/kJ·kg¹1·K¹1 1.09 0.90
Density
[image:3.595.55.281.81.378.2] [image:3.595.76.265.205.378.2] [image:3.595.74.266.418.602.2]y=145 mm in the case of the normal coat. It seems that this result is due to the melt surface temperature drop to about 885 K of the liquidus temperature. However in the case of the high permeability coat, the melt surface temperature is higher than the liquidus temperature even at y=190 mm. From those results, when a high permeability coat was used, the fluidity length in which the melt surface temperature decreases to the liquidus temperature is longer than that for a normal coat, and there is a smaller possibility of a misrun. The average value of the temperature drop of the melt surface per unit fluidity length can be obtained from the gradient by the linearization of measured values in Fig. 5. This value for the normal coat is 0.57 K/mm and that for the high permeability coat is 0.25 K/mm. The above calculation for the normal coat was carried out within 10 to 145 mm ofy, because the melt surface temperature has decreased to the liquidus temperature at the position of y=145 mm. From this result, the temperature drop of the melt surface for the high permeability coat is smaller than that for the normal coat, and about 44%of the normal coat. Experimental data on the melt surface temperature are in relatively good agreement with the calculated values under the condition over the liquidus temperature.
The adiabatic condition at the melt surface in this numerical analysis is examined as following. From the result of Fig. 4, the heat release to the mold at the complete filling is calculated from the average temperature drop of the molten metal, and is about 9700 J. On the other hand, the heat transferred from melt surface to the EPS model is consumed in the thermal decomposition of the model. This heat is calculated with about 70 J using the decomposition heat 30 kJ/kg,11)and is under 1%of the heat release to the mold. The heat transfer from the melt surface to the EPS model does not almost affect the temperature drop of the molten metal. Therefore, the adiabatic condition in the melt surface would be appropriate.
The effect of a high permeability coat described above was compared with the effect of a high insulating coat reported previously.6)Figure 6 is a similar plot as Fig. 5, and obtained from the experimental results of the high insulating coat in the previous report.6)From Fig. 6, though the melt surface temperature aty=145 mm for the normal coat has decreased to the liquidus temperature, that for the high insulating coat is higher than the liquidus temperature even at y=190 mm. Therefore, the degree of temperature drop to the melt flow direction for the high insulating coat is smaller than that for the normal coat. The average value of the temperature drop of the melt surface per unitfluidity length for the high insulating coat is 0.30 K/mm, and about 53%for the normal coat. This result is similar to the case of the high permeability coat as shown in Fig. 5. From those results, the effect in using a high permeability coat mentioned above is almost similar to the effect in using a high insulating coat in the previous report.6) The solid line and the broken line in this figure show the predictions calculated by using h=350 W/m2K as well as the case of Fig. 5. Experimental data on the melt surface temperature are in relative agreement with the calculated values under the condition over the liquidus temperature, as well as the case of the high permeability coat shown in Fig. 5.
Quantitative considerations on the effects of the coat permeability on the melt velocity and on the melt surface temperature are necessary. The first consideration of the effect of the coat permeability on the melt velocity is examined as following. From the experimental results shown in Figs. 3 and 4, even if the coat permeability increases about 16 times, the melt velocity increases only about three times. The reason for this may be considered as following. Though the permeability of the coat increases, the gas layer thickness of the thermal decomposition gas decreases and the exhaust area of the gas decreases.3) Therefore the relationship between the coat permeability and the melt velocity is not linear, and it is difficult to predict the melt velocity from the coat permeability. Further consideration on the effect described above is not discussed, and will be reported in the next report.
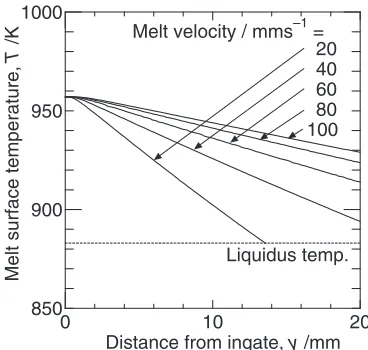
The second consideration of the effect of the melt velocity on the temperature drop of the melt surface was examined as following. As previously mentioned, because it is difficult to set at the experimental condition of an arbitrary melt velocity, the effect of the melt velocity on the melt surface temperature was considered based on a numerical analysis. Figure 7 shows the numerical predictions for the melt surface temperature as a function of the distance from the ingate y
with the melt velocity as a parameter. In these calculations, the value of h=350 W/m2K was used as a heat transfer coefficient in the molten metal-coat interface, and the condition of the melt temperature at the ingate was similar to the case shown in Fig. 4. From Fig. 7, the degree of temperature drop to the melt flow direction is smaller as the melt velocity is larger. Under the condition in this calculations, when the melt velocity increases from 20 to 100 mm/s, the temperature drop decreases to 23% and is almost proportional to the reciprocal of the melt velocity.
5. Conclusion
The aluminum alloy casting was cast using the plate EPS pattern coated by a high permeability coat, and the temper-ature change of the melt surface to the melt flow direction was measured. The numerical simulation was carried out for
0 800 850 900 950 1000
Distance from ingate, y /mm
Melt surface temperature,
T
/K
h=350 W/m2K
Key Coat
(Insulating) velocity
0.53W/mK
0.17W/mK
27mm/s
23mm/s
Heat transfer coefficient
(experi–
mental) (numer–ical)
Liquidus temp.
200 100
Melt Line
[image:4.595.325.527.72.261.2]the heat transfer from the molten metal to the mold through the coat. The following conclusions were drawn from this experimental and analytical study.
(1) When a high permeability coat is used, the melt velocity is greater and the temperature drop of the melt surface is smaller than the case for a normal coat, and this effect is similar to the case for a high insulating coat.
(2) Experimental data on the temperature drop at the melt surface to the melt flow direction are in relative agreement with the calculated values.
Acknowledgement
This study was carried out by the delivery of young member research encouragement fund of the Japan Foundry Engineering Society. We wish to express our deepest gratitude to the Japan Foundry Engineering Society.
REFERENCES
1) General Motors Asia Pacific Japan: SOKEIZAI (1994) p. 5. 2) A. T. Speda: MODERN CASTING (2001) 2933. 3) S. Koroyasu: J. JFS81(2009) 377383.
4) M. R. Barone and D. A. Caulk:Int. J. Heat Mass Transfer48(2005) 41324149.
5) S. Koroyasu and M. Matsuda: J. JFS76(2004) 679686. 6) S. Koroyasu and M. Matsuda: J. JFS76(2004) 687694.
7) EPC Process Technical Meeting:Characteristic and Standardization of
Coat for EPC Process, (Kansai Branch of JFS) (1996) p. 18.
8) W. Nakajima:Saishin Den-netu Keisoku Gizyutsu, (1992) pp. 259262. 9) I. Ohnaka: Computer Den-netsu Gyoukokaiseki Nyumon, (Maruzen,
Japan) (1990) pp. 326341.
10) S. Koroyasu and M. Matsuda: J. JFS68(1996) 949955. 11) T. Kobayashi and Y. Kasuya: IMONO64(1992) 192197.
0 850 900 950 1000
Distance from ingate, y /mm
Melt surface temperature,
T
/K
Liquidus temp.
Melt velocity / mms–1 =
20 40 60 80 100
20 10
[image:5.595.76.260.70.245.2]