Crystallographic Orientation Distribution Control by Means
of Continuous Cyclic Bending in a Pure Aluminum Sheet
Yoshimasa Takayama
1;*1, Yuji Uchiyama
1;*2, Tsuyoshi Arakawa
1;*2,
Masakazu Kobayashi
2and Hajime Kato
11Department of Mechanical Systems Engineering, Utsunomiya University, Utsunomiya 321-8585, Japan
2Department of Production Systems Engineering, Toyohashi University of Technology, Toyohashi 441-8580, Japan
Continuous cyclic bending (CCB) has been proposed as a useful straining technique to produce the high strain on the surface layers and the lower strain in the central layer of the sheet. A pure aluminum sheet is worked by the CCB using the ‘‘Roll traveling device’’ and ‘‘Roll driven machine’’. It is found that a sharp Cube orientation is formed by the CCB and subsequent annealing in the pure aluminum sheet. Influences of the CCB/annealing process parameters such as partial or final annealing temperature, strain inside grains and repeating effect, on the Cube sharpening are investigated. The sharper Cube orientation is obtained for the higher temperature of the final annealing after the roll traveling device CCB. While a considerably strong Cube texture appears after one routine of the roll driven machine CCB/773 K-3.6 ks, the texture is weakened after two routines repeated to change into a random texture. The 10 Pass and 20 Pass CCBs with a comparatively low degree of working before partial annealing lead to a high Cube fraction more than 60%. [doi:10.2320/matertrans.L-MRA2007870]
(Received February 2, 2007; Accepted April 26, 2007; Published July 19, 2007)
Keywords: aluminum, texture, SEM/EBSP technique, crystallographic orientation, continuous cyclic bending
1. Introduction
Recently, necessity of improving resource productivity has been emphasized from an aspect of sustainable development, and the importance of recycling has been considered. Improvement of recyclability in materials requires the simplification of chemical composition, the unification of alloy kinds and non addition of rare or poisonous elements. Therefore, importance to control of ‘‘production process’’ rather than ‘‘chemical composition’’ is attached to the development of material. In other words, the microstructural control only by thermomechanical treatment (TMT) without small amount of minor elements should be noted for development of innovative materials or improvement of common commercial materials. One of strategies to control the microstructure by TMT is to make the proper graphic orientation distribution. Controlling the crystallo-graphic orientation should be an attractive way for the improvement of properties.
In order to improve the capacitance of high voltage capacitors, it is required to increase the surface area of high purity aluminum foils. Cube texture ({100} h001i) is effective to increase the surface area through an etching process, because the etch pits form along crystallographic h001i-direction into the foils. Accordingly, the aluminum foils for the electrolytic capacitors have a strong component of Cube texture. Many studies concerned with a formation of Cube texture were performed widely in the production process from the hot rolled sheets to the final annealed foils up to date.1–11)It was considered in the previous studies that Cube-oriented nuclei formed during the hot rolling or cold rolling, they became stable grains in partial annealing process, and in final annealing process, the Cube grains were able to grow preferentially with strain-induced grain boun-dary migration (SIBM) driven by difference in stored energy
introduced by additional rolling process. It was mentioned that Cube grains were less affected than other oriented grains by deformation of additional rolling12–14) or were able to recover earlier than other oriented ones.12,15)
The aim of the present study is to investigate the possibility of crystallographic orientation distribution control by means of continuous cyclic bending (CCB), which has been proposed as a straining technique that can produce the high strain in the surface layer and the low strain in the central part of metal sheet.16) Further, after CCB and subsequent annealing, a pure aluminum sheet and foil are analyzed by orientation image microscope (OIM) using scanning electron microscopy/electron backscattered diffraction pat-tern (SEM/EBSP) technique.17,18)
2. Experimental Procedure
2.1 Samples
Sample was a 99.99% pure aluminum sheet, which contains following elements: 28 Fe, 33 Si, 17 Cu, 2 Mn, 1 Cr, 6 Zn and 0.5 Ti in ppm. The as-received sheet of 1.5 mm thick had been manufactured by the process of casting, hot rolling, cold rolling and annealing. From the sheet, workpiece was machined parallel to rolling direction (RD) with a 200 mm length, 20 mm width and a 1.5 mm thickness.
The workpiece was subjected to the continuous cyclic bending (CCB), partial annealing (PA), additional CCB and final annealing (FA). PAed and FAed refer to ‘‘partially annealed’’ and ‘‘finally annealed’’, respectively, below. CCB was performed using the ‘‘Roll traveling device’’ or ‘‘Roll driven machine’’ as illustrated in Figs. 1 and 2, respectively. PA was carried out in vacuum of 2.3 kPa with a heating rate of 0.28 to 0.35 K/s at a temperature ranging from 463 K to 503 K for 1.8 ks. FA was in salt-bath after CCB by the roll traveling device or in vacuum after CCB by the roll driven machine at a temperature of 673 K to 773 K for 3.6 ks. The preparation process of sample is shown in Fig. 3.
*1Corresponding author, E-mail: [email protected] *2Graduate Student, Utsunomiya University
2.2 Crystallographic orientation analysis by SEM/ EBSP method
Specimens were polished to mechanically and electro-chemically (HClO4 :ethanol¼1 : 8, 7 V, 283 K, 480 to 600 s). Crystallographic orientation analysis was performed using SEM/EBSP technique by HITACHI S-3500H equip-ped with TSL Orientation Image Microscopy (OIM) system. Analyzed area and scanning step were selected for the grain size of each sample shown in Table 1.
Unclear data points were included partially since results of EBSP analysis were affected by cleanness and a roughness on the surface of samples. Therefore, EBSP maps were modified by clean-up treatment of the OIM software. Grains are colored by the color-code that is assigned to the texture components of recrystallization after rolling in aluminum, i.e. ‘Cu’ {112}h111i, ‘S’ {123}h634i, ‘Brass’ {110}h112i, and ‘Cube’ {001}h100iorientations. The orientation components were recognized with misorientation within 10 degrees so as to avoid overlap of the components. Grain or area with lower misorientation from a ideal orientation is given a deeper color. Fine and bold lines show low-angle (LAGB) and high-angle grain boundaries (HAGB). LAGB and HAGB are
commonly defined here misorientations between two grains as 5 to 15 degrees and more than 15 degrees, respectively. Consequently, we adopt the threshold angle of 5 degrees for grain boundaries. Red lines represent coincidence site lattice (CSL) boundaries of3 to19b.
3. Results and Discussion
3.1 Change in Dimensions by Continuous Cyclic
Bend-ing
Figure 4 shows change in dimensions after continuous φ22
2 t=1.5
2 Roll 1
Roll 4 Roll 3
Roll 2
18
9
18
9
Fig. 1 Roll traveling CCB device.
Roll 5 Roll 2
Roll 1
Roll 4
Roll 3
50 18 18 18 18 50
φ36.36 φ32
R1=162.125
Advancing direction
R2=80.5
0.5
0.5
1.5
t=1.5
Fig. 2 Roll driven CCB machine.
Partially annealed
at 463 503K for 1.8ks
CCBent(10P)
As-received sheet
CCBent sheet
(50P)
Finally Annealed in 673K, 773K for 3.6ks
99.99% AluminumSheet
As-received
Continuous Cyclic Bent (10 50P)
PA+CCBent sheet PAed
sheet
[image:2.595.57.286.69.501.2]Fig. 3 The preparation process of sheet sample.
Table 1 Analysis area and scanning step
Samples Analysis Area Step Size Before FA 800mm800mm 5mm
After FA 3000mm3000mm 1525mm
0 2
−20 −10 0 −10 0 10 0 10 20 30
Cumulative true strain, cum
Change in dimensions (%)
4N Al
Length
Width
Thickness
Roll traveling Roll driven
1 3 4 5
ε
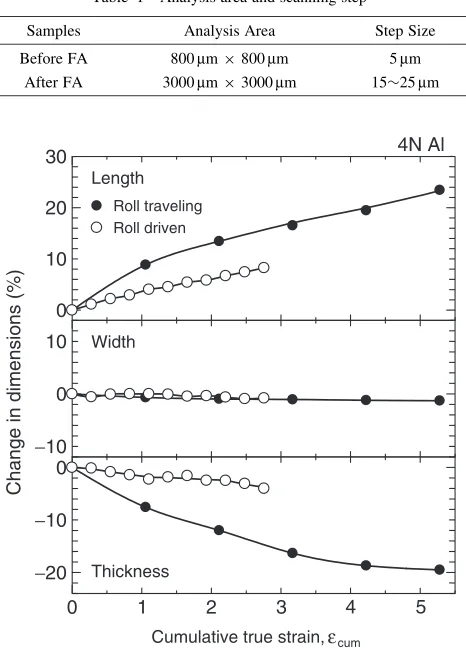
[image:2.595.189.535.70.607.2] [image:2.595.309.539.76.251.2] [image:2.595.312.545.283.607.2]cyclic bending (CCB) using both types of the CCB in the pure aluminum workpiece. Cumulative true strain is taken as abscissa in the figure since true strains per a single pass are not the same for both the CCBs. In the roll traveling CCB, the dimensional change of the workpiece is considerably large as
well as in titanium sheet,19)in particular, increase in length reaches 23.4% at a cumulative strain of 5.281. Because the increase in length for a high purity (HP) titanium was only 6.9% at the same strain,19)such dimensional change probably depends on the tensile strength. On the other hand, change in
0.0 0.1 0.3 0.4 0.5 0.7 0.8 0.9 1.0
Area Fraction
As-received
50P/673K-3.6ks
50P/773K-3.6ks
Brass S Cu Cube
Cube Cu S Brass LAGB HAGB
Σ3∼19b
RD
TD
a
b
cd
0.2 0.6
Fig. 5 Experimental results of the FAed sheet after the CCB by roll traveling device: (a) Orientation maps for as-received and annealed samples for 3.6 ks at (b) 673 K, (c) 773 K, and (d) fractions of distribution. 50P refers to 50 Passes of CCB.
0 0.2 0.4
2.0 4.0 6.0
Misorienation degrees
50Pass −TD−
Cube
S
0 0.2 0.4
Cube
S
Fraction
50Pass −RD−
CCB direction
a b
[image:3.595.88.511.73.423.2] [image:3.595.94.507.476.679.2]50P/773K-3.6ks (50P/773K-3.6ks)2 (50P/773K-3.6ks)3 (50P/773K-3.6ks)4
Pole Figure
Max 20.573 Max 16.050 Max 17.395 Max 25.374
Fraction of Boundaries
0.0 0.2 0.4 0.6 0.8 1.0
Area Fraction
50P/773Kñ3.6ks
(50P/773K-3.6ks)2
(50P/773K-3.6ks)3
(50P/773K-3.6ks)4
Brass S Cu Cube
0.1 0.3 0.5 0.7 0.9
Fig. 7 Repeating effect of CCB/annealing by the roll driven device. 50P refers to 50 Passes of CCB.
0.0 0.1 0.2 0.3 0.4 0.5 0.6 0.7 0.8 0.9 1.0
Area Fraction As-received
463K
483K
503K
Brass
S Cu Cube
0.0 0.1 0.2 0.3 0.4 0.5 0.6 0.7 0.8 0.9 1.0
Area Fraction 50P/PA+10P/FA
20P/FA
50P/PA+50P/FA 50P/FA
Brass
S Cu Cube 10P /FA
50P/PA+20P/FA
(a) (b)
[image:4.595.87.511.70.500.2] [image:4.595.85.511.562.760.2]length due to the roll driven CCB reaches 8.9% at a strain of 2.757 even for the pure aluminum. Decrease in width is less than 0.8% to be regarded as almost unchanged for both of CCBs. Change in thickness seemed to correspond to that in length. The roll traveling CCB lowered thickness by about 20% in a strain of 5.281. Therefore, CCB by the roll driven machine were closer to an ideal one accompanied with no dimensional change, and plane strain state, which remains in rolling, was almost held in both CCBs.
3.2 Crystallographic orientation distribution control by
roll traveling CCB device
3.2.1 Effect of FA temperature on microstructure
Figure 5 represents the result of crystal orientation analy-sis as an orientation map on the surface of the sheet specimen FAed at 673 K and 773 K after the roll traveling CCB. The average grain sizes were evaluated for as-received, 673 K-FAed and 773 K-K-FAed specimens as 51.7mm, 212mm and 390mm, respectively, from the orientation maps. The FAed specimens have about four and eight times larger grain size than the as-received one, due to marked grain growth. There is no difference in grain shape in the microstructures of the three specimens. However, colored grains in the maps indicate different distributions of crystallographic orienta-tion.
The typical texture components of recrystallization after rolling in aluminum are displayed as an area fraction in Fig. 5(d). In the as-received sheet, the rolling recrystalliza-tion texture appears as expected. While the fracrecrystalliza-tion of S oriented grains is a high percentage over 25%, Cube oriented grains have a fraction as low as 2.9%. After CCB and annealing, the fraction of Cube orientation increases up to 17.4%, and that of S orientation decreases to 10.8%, in the 673 K-FAed. For the higher temperature FAed at 773 K, the Cube orientation reaches very high fraction of 65.8%, and S orientation shows only 1.9%. The Cube grains probably consumed the other orientations, such as S orientation by a driving force of the stored strain energy given by CCB. As a result, Cube texture was formed quickly.
3.2.2 Intragranular Misorientation due to CCB
Here, the intragranular misorientation was examined in a 50-pass CCBent sheet specimen. Figure 6 shows the ori-entation map and the intragranular misoriori-entation distribu-tions in rolling and transverse direcdistribu-tions for the CCBent specimen. The orientation map shown in Fig. 6(a) is colored by only primary orientations. The gradation of the color in the map shows large amount of strain inside grains by CCB passes. Local concentration of strain, that is sharp gradation, is found not only near grain boundaries but inside grains. As well as gradation, the thin lines representing the low angle boundary with misorientation of 5 to 15 degrees are observed inside the grains uniformly. However, the thin lines have anisotropy to be parallel to TD, in other words, vertical to CCB direction, which makes clear the strain stored by CCB. The histograms (Fig. 6(b)) show the intragranular misor-ientation distributions for the Cube and S oriented grains in both of RD and TD. The intragranular misorientations were measured along transverse lines in each grain for points with intervals of 0.5 micrometers, totaled to 100 grains for both orientations. These histograms reveal that the misorientation
of Cube grains is concentrated on the classes of small values while those of S grains were distributed in the wider range over 6.0 degrees, especially, in RD.
As mentioned above, Cube grains have the small misor-ientation produced by CCB compared with S grains. Because magnitude of the intragranular misorientation corresponds to amount of geometrically necessary dislocations,20) Cube grains have smaller amounts of stored strain energy. More-over, a part of the present authors reported that Cube grains were easier to recover than the other grains in rolled samples.21) Therefore, the reason why Cube grains grow preferentially is probably their recovery in an early stage resulting from the small amounts of the stored energy and ease of recover.
We are interested in the fact that the intragranular misorientations of Cube grains are clearly lower than that of the other oriented ones. According to Ridha and Hutchinson12)the Cube grains have had lower stored energy than the other oriented grains after deformation as explained by Taylor factor.22)Moreover, It was understood that Cube orientations were able to recover faster than the others were. When the Cube grains are difficult to introduce or easy to release the stored energy, the driving force for grain-boundary migration arise from Cube grains to the neighbor other-oriented grains with higher stored energy.5)Then the Cube grains grow preferentially. This mechanism, which is well known as strain induced grain boundary migrations (SIBM),23) evolve the Cube texture during early annealing stages in the additionally rolled foils.
3.3 Crystallographic orientation distribution control by
roll driven CCB machine
In this section, control of crystallographic orientation distribution using roll driven CCB machine was investigated. The roll driven CCB is close to an ideal bending process as described above.
3.3.1 Repeating effect of CCB/Annealing process
To give the CCB and the annealing once more to the annealed sample after the CCB is very interesting for the Cube texture evolution in the present samples.
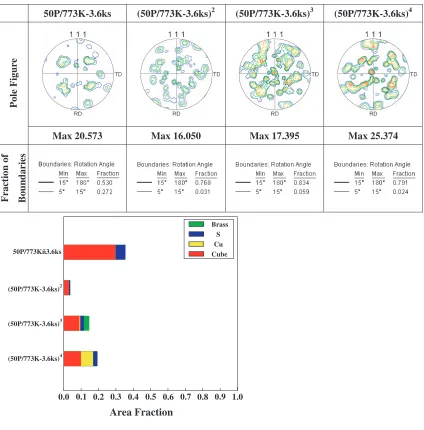
Figure 7 represents {111} pole figures and a bar graph showing the fraction of each orientation after repeating routine of CCB/Annealing up to 4 times. After one routine of 50 Pass/773 K-3.6 ks, the fractions of Cube and S orienta-tions are 29.7% and 5.7%, respectively. The considerably strong Cube texture has appeared after the first routine. However, as shown in the pole figures, primary orientations including Cube orientation decrease after two routines repeated, and the random texture is formed. The third and the forth routines lead to a little evolution of the primary components, especially Cube orientation.
primary components evolve in the same mechanism as the first routine. It should be noted that there is a critical grain size of Cube grain to recover and grow up after deformation.
3.3.2 Effect of partial annealing (PA)
It is known that in the industrial manufacturing process of electrical capacitor a Cube texture is developed by cold rolling, partial annealing (PA), additional rolling and final annealing (FA). In this study, the additional rolling was replaced by an additional CCB. Then, how the PA temper-ature and subsequent CCB/annealing affect microstructure was investigated.
Figure 8 indicates the changes in fractions of primary components on the surface of the specimens subjected to 50-pass CCB, PA, additional 10-50-pass CCB and FA in a pure aluminum sheet. As shown in Fig. 8(a), the fraction of Cube orientation is over 50% for PA at 463 K and 483 K. The fractions of an S orientation are 26.3% and 4.8% for both specimens. On the other hand, the fraction of a Cube orientation was a low percentage of 36% at a PA temperature of 503 K. This means that Cube orientations are able to recover faster or at lower temperature than the others. Strain of Cube oriented grains is released at a low temperature where the marked difference appears in the stored energy between Cube and S oriented grains. Cube oriented grains can grow up preferentially compared with S oriented grains during FA owing to the difference of the stored energy.
Comparing the specimens with and without PA of 463 K-1.8 ks FA is set as 773 K-3.6 ks. It is found that the number of additional CCB passes after PA affects final fractions of crystallographic orientations. The 10 Pass and 20 Pass CCB with the comparatively low degree of working lead to a high Cube fraction more than 60%. For the 50 Pass CCB with the high degree of working, the Cube orientation occupies a fairly small percentage of 36.8%. This is due to considerably large amounts of strain stored in the Cube oriented grains by the additional 50 Pass CCB.
In the 483 K-PAed sheets, a marked difference in the initial grain size between the Cube and the other oriented grains is favorable for the formation of Cube clusters through the foil thickness. The partial annealing at the relatively low temper-atures of 463 K and 483 K is helpful to the formation of the large Cube grains and small other oriented grains, because the Cube grains can recover and grow well in this temper-atures range. Larger grains can grow preferentially.
4. Conclusions
In this study, in order to investigate the possibility of crystallographic orientation distribution control by means of continuous cyclic bending (CCB) and annealing in a pure aluminum sheet and foil have been analyzed by OIM using electron backscattered diffraction pattern (SEM/EBSP) technique. The conclusions are summarized as follows.
(1) The roll driven CCB is close to an ideal bending process compared with the roll traveling CCB.
(2) For the sheet specimen FAed at a higher temperature of 773 K, the Cube orientation reaches very high fraction of 65.8% while the S orientation shows only 1.9% by the roll traveling CCB device.
(3) Cube grains have the small intragranular misorientation produced by CCB compared with S grains.
(4) After one routine of 50 Pass-roll driven CCB/773 K-3.6 ks, the considerably strong Cube texture has appeared. However, primary orientations including Cube orientation decrease after two routines repeated, and the random texture is formed. The third and the forth routines lead to a little evolution of the primary components, especially Cube orientation.
(5) The 10 Pass and 20 Pass CCB with the comparatively low degree of working lead to a high Cube fraction more than 60%.
REFERENCES
1) F. Seki and T. Kamijyo: J. Japan Inst. Light Metals48(1998) 507–510. 2) O. Engler and M.-Y. Huh: Mater. Sic. and Eng.A271(1999) 371–381. 3) T. Kamijo, F. Seki, H. Tamaki and K. Ito: J. Japan Inst. Light Metals49
(1999) 589–594.
4) F. Seki: J. Inst. Metals64(2000) 218–219.
5) K. Ikeda, K. Tsumagari, F. Yoshida, H. Nakashima and H. Abe: J. Japan Inst. Light Metals51(2001) 119–124.
6) K. Kajihara, K. Tokuda, Y. Sugizaki and Y. Seki: J. Japan Inst. Light Metals51(2001) 182–187.
7) T. Murakami: J. Japan Inst. Light Metals52(2002) 541–546. 8) S. Endou and H. Inagaki: J. Japan Inst. Light Metals52(2002) 167–
173.
9) N. Takata, K. Ikeda, F. Yoshida, H. Nakashima and H. Abe: J. Japan Inst. Light Metals53(2003) 218–223.
10) N. Takata, K. Ikeda, F. Yoshida, H. Nakashima and H. Abe: Mater. Trans.45(2004) 1687–1692.
11) N. Takata, F. Yoshida, K. Ikeda, H. Nakashima and H. Abe: Mater. Trans.46(2005) 2975–2980.
12) A. A. Ridha and W. B. Hutchinson: Acta Metall.30(1982) 1929–1939. 13) I. Samajdar and R. D. Doherty: Scripta Metal. Mater.32(1995) 845–
850.
14) I. Samajdar and R. D. Doherty: Acta Mater.46(1998) 3145–3158. 15) H. E. Vatne, T. Furu and E. Nes: Mater. Sci. and Tech.12(1996) 201–
210.
16) Y. Takayama, M. Yamaguchi, T. Tozawa, H. Kato, H. Watanabe and T. Izawa: Proc. fourth Intern. Conf. on Recrystallization and Related Phenomena (JIMIS10), The Japan Institute of Metals, (1999), 321–326.
17) B. L. Adams, S. I. Wright and K. Kunze: Metall. Trans. A24(1993) 819–831.
18) A. J. Schwartz, M. Kumar and B. L. Adams: Electron Backscatter Diffraction in Materials Science, (Kluwer Academic/Plenum Publish-ers, 2000).
19) Y. Takayama, T. Miura, H. Kato and H. Watanabe: Mater. Trans.45
(2004) 2826–2831.
20) N. A. Fleck, G. M. Muller, M. F. Ashby and J. W. Hutchinson: Acta Metall. Mater.42(1994) 475–487.
21) M. Kobayashi, Y. Takayama and H. Kato: Mater. Trans.45(2004) 3247–3255.
22) G. I. Taylor: J. Inst. Metals62(1938) 307–325.