The Effect of Thermal Cycling on B2
!
B19
!
B19
0Transformations
of Ti
50Ni
40Cu
10Shape Memory Alloy by Dynamic Mechanical Analyzer
Kai-Nan Lin
1;*1, Shyi-Kaan Wu
1;2;*2and Chia-Liang Tsai
1;*11
Department of Materials Science and Engineering, National Taiwan University, Taipei 106, Taiwan, R.O. China 2Department of Mechanical Engineering, National Taiwan University, Taipei 106, Taiwan, R.O. China
The effect of thermal cycling on B2!B19!B190 transformations of cold-rolled and annealed Ti
50Ni40Cu10SMA was examined by DMA. Experimental results point out the transformation peak temperature and itstanpeak value of B19!B190 transformation are more
suppressed by thermal cycling than those of B2!B19. This is because of the different microstructures between B19 and B190martensites in
which B19 is a defect-free martensite but B190has plenty of twinning. Dislocations induced by thermal cycling can hinder the mobility of twin
boundaries of B190martensite and cause different thermal cycling effects on B2!B19 and B19!B190transformations. Thermal cycling also
shows an obvious effect on storage modulusE0values of B19 and B190martensites and theirE0values increase with increasing thermal cycles.
[doi:10.2320/matertrans.MRA2008123]
(Received April 7, 2008; Accepted September 18, 2008; Published October 29, 2008)
Keywords: shape memory alloy, thermal cycling, internal friction, martensitic transformation, dynamic mechanical analysis
1. Introduction
TiNi-based shape memory alloys (SMAs) are known as having high potential for mechanical, biomedical and sports applications because of their excellent properties of shape memory effect, pseudoelasticity and damping capacity.1) Among ternary TiNi-based SMAs, Ti50Ni50xCux SMAs with x530at%, have been extensively examined from
various aspects, such as the shape memory effect,2–4) martensitic transformation behaviors,5–8)mechanical
charac-teristics,9–11)microstructures,12–17)internal friction,18–26) etc.
The transformation sequences of Ti50Ni50xCux SMAs are
B2 !B190, B2 !B19 !B190 and B2 !B19 for
x<5, 55x520andx>20at%, respectively.27–29) Here,
B2 is the parent phase, and B19 and B190are orthorhombic and monoclinic martensites, respectively.
In our previous study,30)the dynamic mechanical analyzer
(DMA) is confirmed to be more suitable than differential scanning calorimetry (DSC) for examining both B2!B19 and B19!B190 transformations of Ti50Ni40Cu10 SMA. Reported studies show, using the DMA test, there are three tan peaks for Ti50Ni40Cu10 SMA: B2!B19 and B19!B190 transformation peaks, and a relaxation peak.22,24,25)The former two tan peaks individually corre-spond to their storage modulus (E0) minimums.18,26,30)At the same time, the annealing recovery behavior of B2!B19 and B19!B190 transformations of severely cold-rolled and annealed Ti50Ni40Cu10 alloy have also been studied by DMA.30)The experimental results suggest different recovery
behaviors result from different intrinsic microstructures inherent in defect-free B19 martensite and twinned B190 martensite.5) This feature causes the tan peak height of
B19!B190transformation to be much more suppressed by cold-working defects than B2!B19, and the former trans-formation therefore needs higher annealing temperature and/ or longer annealing time to recover.
Thermal cycling can induce dislocations in TiNi-based SMAs. These dislocations result in the decrease in Ms
temperature, an increase in electrical resistance prior to martensitic transformation and an increase in temperature difference betweenMsandMf.31–33)We find most studies on
the thermal cycling effect focused on binary TiNi-based SMAs, instead of ternary TiNiCu SMAs. Besides, most studies used the DSC technique to study the thermal cycling effect on TiNi-based SMAs. However, in Ti50Ni40Cu10SMA, the DSC technique is suitable for examining B2!B19 transformation but not for B19!B190 transformation be-cause the latter displays only a diffuse and broad peak with small transformation enthalpy (about 2{3J/g). On the contrary, the DMA test can reveal significant tan peaks for both B2!B19 and B19!B190transformations.18,30)To
the best of our knowledge, the DMA technique has not been utilized to study the thermal cycling effect on the trans-formation behavior of TiNiCu ternary SMAs. In this study, the effect of thermal cycling on B2!B19 and B19!B190 transformations of 30% cold-rolled and873K1h annealed Ti50Ni40Cu10 SMA was examined by the DMA test in which the effect of thermal cycles, N, on transformation peak temperatures, theirtanpeak values andE0minimum values are measured. From these results, the different effects of thermal cycling on B2!B19 and B19!B190 transforma-tions by DMA tests are discussed.
2. Experimental Procedures
Ti50Ni40Cu10 ingot was prepared by vacuum arc-remelter (VAR) in which high purity Ti (99.7 mass%), Ni (99.9 mass%) and Cu (99.99 mass%) were remelted six times in a high purity Ar atmosphere. The as-melted ingot was hot-rolled at 1123 K to a sheet of 2 mm thickness by STANAT TA-515-5-5X8 rolling machine at a constant rolling speed of 10 m/min. The oxidation layer of the sheet was chemically etched by a solution composed of HF:HNO3:H2O¼1 :
5 : 20 (in volume) and then polished by #150 sandpapers.
After removing the oxidation layer, the sheet was cut into *1Graduate Student, National Taiwan University
*2Corresponding author, E-mail: [email protected]
100mm40mm plates with the longitude along the hot-rolling direction. Then, the plates were cold-rolled to about 1.3 mm in thickness at room temperature along the hot-rolling direction by the same hot-rolling machine with about 6% thickness reduction for each pass. The total thickness reduction of cold-rolling was about 30%. After cold-rolling, the plates were cut into 40mm5mm1:3mm strips along the rolling direction, sealed in evacuated quartz tubes and annealed at 873 K for 1 h, and subsequently quenched in water. Finally, the strips were cut and ground to 35mm
5mm1:2mm specimens for DMA test. Transformation peak temperatures, theirtanpeak values andE0minimum values of the specimens were determined by a TA 2980 DMA equipment with a 3 K/min cooling rate under constant frequency (1 Hz) and amplitude (5mm, with the strain
5:65105) of the single cantilever mode. The testing temperature range was from 373 to 173 K. For the thermal cycling test, the specimen was conducted repeatedly between the 473 K hot plate and liquid nitrogen. The isothermal DMA test was conducted under the same cooling rate, frequency and amplitude mentioned above and followed the sequence: (1) held at 373 K for 1 min, (2) cooling to the B2!B19 transformation peak temperature (290.1 K), (3) held at 290.1 K for 60 min, (4) cooling to the B19!B190 trans-formation peak temperature (242.2 K), (5) held at 242.2 K for 60 min and (6) cooling to 173 K. The abbreviations ‘‘tan1’’ and ‘‘tan2’’ are employed to representtan peak values of B2!B19 and B19!B190transformations, respectively.
[image:2.595.315.540.73.446.2]3. Experimental Results
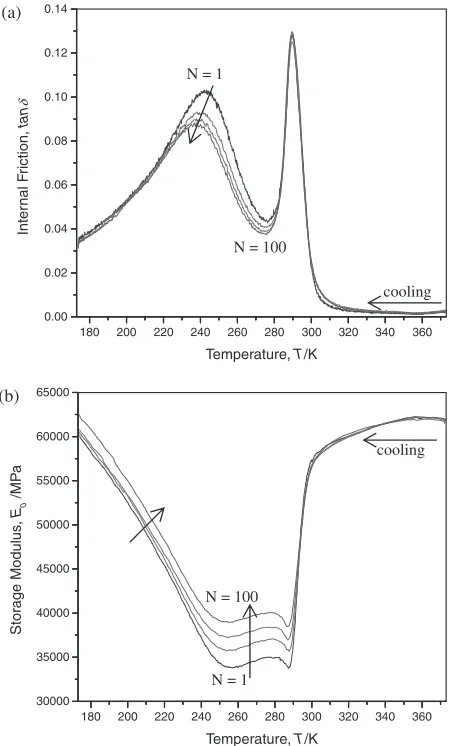
Figure 1 shows the DMA cooling curves oftanandE0vs. temperature of 30% cold-rolled and 873K1h annealed Ti50Ni40Cu10 specimen. From Fig. 1, a typical two stage B2!B19!B190martensitic transformation is observed. The transformation peak temperature, itstanpeak value andE0 minimum value of B2!B19 transformation are 290.1 K, 0.1290 and 33775 MPa, respectively, and those of B19! B190 are 242.2 K, 0.1041 and 33828 MPa, respectively, as marked by the arrows shown in Fig. 1. The inconsistency of
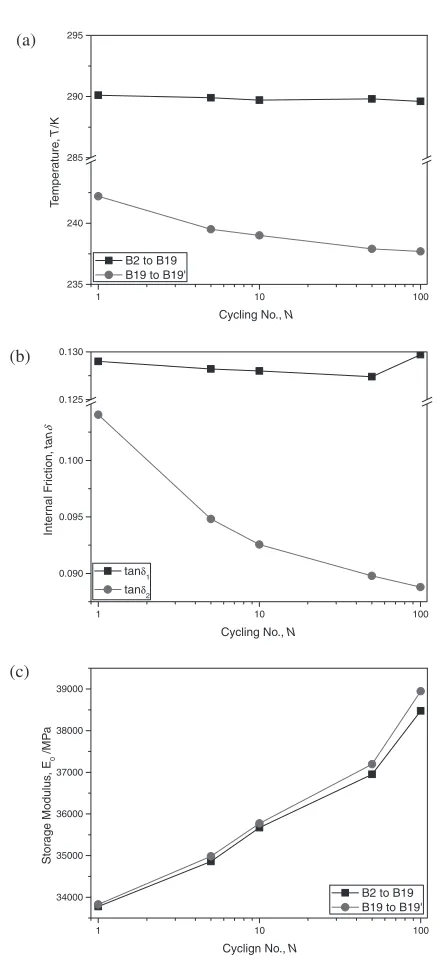
tan peak temperature (242.2 K) andE0 minimum temper-ature (255.6 K) is resulted from the fact that the B190 martensite forming above 242 K increases theE0value with decreasing temperature. Figures 2(a) and 2(b) show the DMA cooling curves of tan and E0 vs. temperature, respectively, of Fig. 1 specimen after N¼1, 10, 50 and 100. From Fig. 2, the data of transformation peak temper-atures, theirtanpeak values andE0minimum values vs.N are plotted in Figs. 3(a), 3(b) and 3(c), respectively. Clearly, thermal cycling can affect the transformation behavior of the cold-rolled and annealed Ti50Ni40Cu10 specimen.
In Fig. 3(a), for B2!B19 transformation, the tan peak temperature decreases from 290.1 K (N¼1) to 289.6 K (N¼100) and the total decrease forN¼100is only 0.5 K. While for B19!B190transformation, thetanpeak temper-ature first varies from 242.2 K (N¼1) to 239 K (N¼10), then decreases slowly from 239 K (N¼10) to 237.7 K (N¼100) and the total decrease for N¼100 is 4.5 K. From Fig. 3(a), the decrease in tan peak temperature of B19!B190 transformation is obviously larger than B2!B19 after thermal cycling. In Fig. 3(b), thetan1value is found to be almost constant (about 0.1285) fromN¼1to N¼100, while thetan2value varies from 0.1041 to 0.0925 within N¼10 and then decreases slowly from 0.0925 to
180 0.00 0.02 0.04 0.06 0.08 0.10 0.12 0.14
30000 35000 40000 45000 50000 55000 60000 65000
Stor
age Modulus
,
E0
/ MP
a
Inter
nal F
riction,
tan
δ
Temperature, T/K
cooling
cooling E0 curve
tanδ curve
360 340 320 300 280 260 240 220 200
Fig. 1 The DMA cooling curves oftanandE0vs. temperature of 30% cold-rolled and873K1h annealed Ti50Ni40Cu10specimen.
180 0.00 0.02 0.04 0.06 0.08 0.10 0.12 0.14
Inter
nal F
riction,
tan
δ
Temperature, T/K
30000 35000 40000 45000 50000 55000 60000 65000
Stor
age Modulus
,
E0
/MP
a
Temperature, T/K
(a)
(b)
N = 1
N = 100
N = 1 N = 100
cooling
cooling 360 340 320 300 280 260 240 220 200
180 200 220 240 260 280 300 320 340 360
[image:2.595.56.280.568.757.2]0.0887 after a further 90 thermal cycles. From Fig. 3(b), the decrease of tan2 value is clearly larger than that of tan1 value after thermal cycling. In Fig. 3(c), E0 minimums all increase uniformly with increasingN(from about 33800 MPa of N¼1 to about 38700 MPa of N¼100 for both trans-formations).
Figure 4 shows the results of the isothermal DMA test of Fig. 1 specimen. The isothermal DMA test was also conducted under 3 K/min cooling rate, constant frequency (1 Hz) and constant amplitude (5mm, with the strain
5:65105) of the single cantilever mode. In Fig. 4(a), the specimen was first cooled down from 373 K to transformation peak temperature of B2!B19 transformation (290.1 K) and was kept isothermally for 60 mins. Thereafter, the specimen was further cooled down from 290.1 K to transformation peak temperature of B19!B190 transformation (242.2 K) and was also kept isothermally for 60 mins. Finally, the
specimen was cooled down to 173 K. Figure 4(b) plots the curves of the tan value vs. isothermal time for these two transformations. In Fig. 4(b), the tan values of both B2!B19 and B19!B190 transformation peaks decrease with increasing isothermal time and reach a steady value after 30 min. The decrease in tan values of B2!B19 and B19!B190transformations are 85.0 and 74.9%, respective-ly, after the specimen has been isothermal for 30 min. For the specimen further held isothermally up to 60 min, the decrease intanvalues of B2!B19 and B19!B190transformations are 86.2 and 76.6%, respectively.
4. Discussion
Chang and Wu have systematically studied the isothermal
tan values of Ti50Ni50 and Ti51Ni39Cu10 SMAs by DMA test.26,34–36) The decrease in tan values of B2!B190, B2!R and R!B190 transformation peaks in Ti50Ni50 SMA and those of B2!B19 and B19!B190transformation peaks in Ti51Ni39Cu10 SMA is measured to be 87.7, 70.1, 79.9, 81.9 and 81.2%, respectively, after the specimen had been isothermal at transformation peak temperatures for 100
10 1
235 240 285 290 295
T
emper
ature
,
T
/K
Cycling No., N
B2 to B19 B19 to B19'
100 10
1 0.090 0.095 0.100 0.125 0.130
Inter
nal F
riction,
tan
δ
Cycling No., N
tanδ1
tanδ2
100 10
1 34000 35000 36000 37000 38000 39000
Stor
age Modulus
, E
0
/MP
a
Cyclign No., N
B2 to B19 B19 to B19'
(a)
(b)
(c)
Fig. 3 (a) Transformation peak temperatures, (b)tanpeak values and (c)E0minimum values vs.Nfrom Fig. 2.
180 0.00 0.02 0.04 0.06 0.08 0.10 0.12 0.14
Inter
nal F
riction, tan
δ
Temperature, T/K
-10 0.00 0.01 0.02 0.03 0.04 0.05 0.06 0.07 0.08 0.09 0.10 0.11 0.12 0.13
B2 to B19 transformation peak
Inter
nal F
riction,
tan
δ
Isothermal Time, t/min
B19 to B19' transformation peak cooling
Isothermal Decrease 74.9%
Isothermal Decrease 85.0%
(a)
(b)
70 60 50 40 30 20 10 0
360 340 320 300 280 260 240 220 200
Fig. 4 The results of the isothermal DMA test of Fig. 1 specimen. (a) The DMA cooling curve of tan value held isothermal for 60 mins at transformation peak temperatures of B2!B19 and B19!B190
[image:3.595.58.281.59.538.2] [image:3.595.315.541.74.446.2]30 min. However, for Ti50Ni50SMA, thetanvalue decrease of the relaxation peak in B190martensite is only about 22.1% under the same isothermal condition.35) Obviously, the
decrease in tan values for those transformation peaks in TiNi-based SMAs is in the range of 70{88% after the specimen was isothermal at peak temperatures for 30 min. These values differ from the relaxation peak by about 22%. From Fig. 4, for 30 min isotherm, the decrease in the tan values of B2!B19 and B19!B190transformation peaks is 85.0 and 74.9%, respectively, which is the same order as those reported data mentioned above. Therefore, we suggest both B2!B19 and B19!B190transformation peaks shown in Figs. 1 and 2 are not overlapped with the relaxation peak.22,25)
From Figs. 2, 3(a) and 3(b), the different effects of thermal cycling on B2!B19 and B19!B190transformations can be explained as follows. From N¼1 to N¼100, the total decrease in transformation peak temperatures and theirtan peak values is more suppressed in B19!B190transformation than in B2!B19 one. According to our previous study of the cold-rolled and annealed Ti50Ni40Cu10 specimen, the tan2 value is more affected by the defects introduced by cold-rolling and requires a higher annealing temperature and/or longer annealing time to recover.30) Thus, the dislocations
induced by thermal cycling and the defects introduced by cold-rolling play the same role in suppressing B19!B190 transformation, but are not so obvious for B2!B19 trans-formation. This is because thetanvalue is closely related to the mobility of twin boundaries during transformation. The B19 and B190 martensites have different microstructures. Here, B19 is a defect-free martensite but B190martensite has plenty of internal (001)B190 twinning.5)The thermal cycling
induced dislocations can hinder the mobility of twin boundaries and thus affect the transformation peak temper-ature and itstanpeak value of B19!B190transformation, as shown in Figs. 3(a) and 3(b).
Also, from Figs. 2(b) and 3(c), thermal cycling shows no obvious effect on theE0value in the temperature range of the B2 parent phase (higher than 300 K). TheE0 value at 340 K keeps about 61500 MPa with increasingN. However, theE0 value corresponding to B2!B19 and B19!B190 trans-formations and that in the B190martensite (lower than 240 K) all increase uniformly with increasing N. G. Fan et al.
reported, in the study of 200 K relaxation peak of Ti50Ni50 SMA, the E0 increases with increasing N in the B190 martensite by DMA test.37)They deduced the twin
bounda-ries motion of the B190martensite is hindered by dislocations induced by thermal cycling and makes Ti50Ni50SMA appear harder in the B190 martensite. In the present study, B19!B190 transformation of Ti
50Ni40Cu10 SMA also reveals the same characteristic. The B190martensites contain twin boundaries and both B19 and B190 martensites have movable phase interfaces during transformation but the B2 austenite does not have either. The mobility of these twin boundaries/phase interfaces is also hindered by thermal cycling induced dislocations and its mobility decreases with increasing dislocation density by increasing N. Thus, E0 values of the B19 and B190 martensites increase uni-formly with increasing N, but that of the B2 parent phase does not.
5. Conclusions
The effect of thermal cycling on B2!B19!B190 trans-formations of 30% cold-rolled and 873K1h annealed Ti50Ni40Cu10 SMA was examined by DMA. Both B2!B19 and B19!B190 transformations can display significant transformation tan peaks in the DMA curves. According to the isothermal DMA tests, after 30 min isotherm, bothtan peaks of B2!B19 and B19!B190 transformations are found to not overlap with the relaxation peak. Transformation peak temperature and its tan peak value of B19!B190 transformation are more suppressed by thermal cycling than those of B2!B19 one. This is because of the different microstructures between the B19 and B190martensites. Here, B19 is a defect-free martensite but B190 is an internal (001)B190 twinned one. The thermal cycling induced
disloca-tions can hinder the mobility of twin boundaries and thus suppress the peak temperature and its tan peak value of B19!B190 transformation. Thermal cycling shows no obvious effect on the E0 value of the B2 parent phase, but increases theE0values of the B19 and B190martensites with increasing N. This feature occurs because the mobility of twin boundaries and/or phase interfaces of the B19 and B190 martensites is hindered by dislocations induced by thermal cycling.
Acknowledgment
The authors gratefully acknowledge the financial support of this study from the National Science Council (NSC), Taiwan, Republic of China, under the Grant NSC96-2221-E002-016.
REFERENCES
1) C. M. Wayman and T. W. During: Engineering aspects of shape memory alloys, ed. by T. W. During, K. N. Melton, D. Sto¨ckel and C. M. Wayman, (Butterworth-Heinemann, London, 1990) pp. 3–20. 2) T. H. Nam, T. Saburi, Y. Kawamura and K. Shimizu: Mater. Trans. JIM
31(1990) 262–269.
3) T. H. Nam, T. Saburi and K. Shimizu: Mater. Trans. JIM33(1992) 814–820.
4) H. Sehitoglu, I. Karaman, X. Zhang, A. Viswanath, Y. Chumlyakov and H. J. Maier: Acta Metal.49(2001) 3621–3634.
5) T. Fukuda, T. Saburi, T. Chihara and Y. Tsuzuki: Mater. Trans. JIM36 (1995) 1244–1248.
6) T. Fukuda, M. Kitayama, T. Kakeshita and T. Saburi: Mater. Trans. JIM37(1996) 1540–1546.
7) G. Mazzolai, A. Biscarini, B. Coluzzi, F. M. Mazzolai, A. R. Ross and T. A. Lograsso: Mater. Sci. Eng. A370(2004) 497–503.
8) X. Ren, N. Miura, K. Taniwaki, K. Otsuka, T. Suzuki, K. Tanaka, Y. I. Chumlyakov and M. Asai: Mater. Sci. Eng. A273–275(1999) 190– 194.
9) K. N. Melton and O. Mercier: Metall. Trans.9A(1978) 1487–1488. 10) T. Saburi, T. Takagaki, S. Nenno and K. Koshino: MRS Int. Mtg. Adv.
Mats.9(1988) pp. 147–150.
11) J. L. Proft, K. N. Melton and T. W. Duerig: MRS Int. Mtg. Adv. Mats.9 (1988) pp. 159–161.
12) P. L. Potapov, A. V. Shelyakov and D. Schryvers: Scr. Mater.44(2001) 1–7.
13) T. Tadaki, K. Shmizu and C. M. Wayman: Mater. Trans. JIM32(1991) 43–47.
14) R. H. Bricknell, K. N. Melton and O. Mercier: Metall. Trans.10A (1979) 693–697.
1546.
16) T. Tadaki and C. M. Wayman: Metallography15(1982) 233–245. 17) T. Tadaki and C. M. Wayman: Metallography15(1982) 247–258. 18) Y. C. Lo, S. K. Wu and H. E. Horng: Acta Metal. Mater.41(1993) 747–
759.
19) F. M. Mazzolai, A. Biscarini, R. Campanella, B. Coluzzi, G. Mazzolai, A. Rotini and A. Tuissi: Acta Mater.51(2003) 573–583.
20) A. Biscarini, B. Coluzzi, G. Mazzolai, A. Tuissi and F. M. Mazzolai: J. Alloy. Compd.355(2003) 52–57.
21) S. K. Wu and H. C. Lin: J. Alloy. Compd.355(2003) 72–78. 22) I. Yoshida, D. Monma, K. Otsuka, M. Asai and H. Tsuzuki: J. Alloy.
Compd.355(2003) 79–84.
23) A. Biscarini, B. Coluzzi, G. Mazzolai, F. M. Mazzolai and T. Tuissi: J. Alloy. Compd.356–357(2003) 669–672.
24) I. Yoshida, D. Monma, K. Iino, K. Otsuka and M. Asai: Mater. Sci. Eng. A370(2004) 444–448.
25) G. Fan, Y. Zhou, K. Otsuka, X. Ren, K. Nakamura, T. Ohba, T. Suzuki, I. Yoshida and F. Yin: Acta Mater.54(2006) 5221–5229.
26) S. H. Chang and S. K. Wu: Mater. Trans.48(2007) 2143–2147. 27) T. H. Nam, T. Saburi and K. Shimizu: Mater. Trans. JIM31(1990)
959–967.
28) T. H. Nam, T. Saburi, Y. Nakata and K. Shimizu: Mater. Trans. JIM31 (1990) 1050–1056.
29) H. Miyamato, T. Taniwaki, T. Ohba, K. Otsuka, S. Nishigori and K. Katc: Scr. Mater.53(2005) 171–175.
30) K. N. Lin and S. K. Wu: Scr. Mater.56(2007) 589–592.
31) S. Miyazaki, Y. Igo and K. Otsuka: Acta Metall.34(1986) 2045–2051. 32) R. D. Jean and J. B. Duh: Scr. Metall. Mater.32(1995) 885–890. 33) X. M. He, L. Z. Zhao, X. M. Wang, R. F. Zhang and M. S. Li: Mater.
Sci. Eng. A427(2006) 327–330.
34) S. H. Chang and S. K. Wu: Scr. Mater.55(2006) 311–314. 35) S. H. Chang and S. K. Wu: J. Alloy. Compd.437(2007) 120–126. 36) S. H. Chang and S. K. Wu: Mater. Sci. Eng. A454–455(2007) 379–
383.