Comparative advantage of the EU in
global value chains: How important and
efficient are new EU members in
transition?
Gurgul, Henryk and Lach, Łukasz
AGH University of Science and Technology in Cracow, AGH
University of Science and Technology in Cracow
1 July 2016
Online at
https://mpra.ub.uni-muenchen.de/72738/
Henryk Gurgul*, Łukasz Lach*
Comparative advantage of the EU
in global value chains:
How important and efficient
are new EU members in transition?
11. Introduction
In economic analysis, the measures of competitiveness are expressed in terms of shares of gross output in world export markets. In recent years, these types of mea-sures have become questioned, as one could observe the increasing fragmentation of production across borders. Due to easier communication, increasing information flow, and changes in coordination costs, the various stages of the production process are no longer conducted at geographically close locations. The rising fragmentation of production implies that more and more stages of the production process are faced with international competition. In the past decades, the competitiveness of countries was mainly determined by domestic firms. In most cases, these companies competed ‘sector to sector’ with similar firms from other countries. The competition was usually taking place in the sphere of the price and quality of traded products.
Fragmentation of production, the process by which different production stages of final goods are conducted in different countries, has been increasing over the last several decades. It is clear that this tendency reflects the globalization process in the world economy. An illustrative example of this phenomenon, often discussed in economic literature, is the case of the German automobile industry, which is a leader in the car world market, at least in terms of traditional competition indexes (Dudenhoeffer, 2005). Since a big share of the intermediate production stages
* AGH University of Science and Technology in Cracow, Faculty of Management, Department of Ap-plications of Mathematics in Economics, e-mails: [email protected] (Henryk Gurgul), llach@ zarz.agh.edu.pl (Łukasz Lach).
The authors would like to thank two anonymous referees for the valuable comments on an earlier version of the paper.
1 Financial support for this paper from the National Science Centre of Poland (Research Grant
of German cars is conducted in some other countries (mostly in Europe) and, therefore, a considerable part of the value of German cars is produced abroad, one can ask the following question: To what extent are German cars really German? As Marin (2010) stresses, the ‘super-competitiveness’ of the German economy is in large part derived from the increasing use of imported intermediates. Therefore, the high share of German car exports in the world may not result from the high competitiveness of the German economy. This example clearly shows that, in the time of increasing globalization, new measures of competitiveness are needed. Such measures should be based on the value added in production by a country and on the jobs and capital involved in global production chains. In this paper, we derive such measures empirically from world input-output (IO) tables.
Fragmentation of production is one of the most important sources of structural changes in the CEE economies in transition. This process is likely responsible for the rise (after a dramatic drop in the first half of the 90s) of the share of industrial production in gross domestic product that has been observed in CEE transition economies since the last five years of the Twentieth Century2.
The EU membership of Poland and other CEE countries, globalization and fragmentation process speeded up the rate of growth of the ratio of investment loans to consumption loans and supported growth rate of manufacturing and construction, which has been reflected in the rise of shares of these sectors in the GDP of Poland and other CEE countries.
The fragmentation of production processes can be principally classified into two main forms. The first one is usually called a “snake” and the second – a ‘spider’ (Baldwin and Venables, 2013). Under this notion, the ‘snake’ is understood as a sequence in which intermediate goods are exported from country X to Y. Next, these goods are incorporated into intermediate goods and sent from country Y to country W. This export pattern goes on until the goods reach their final stage of production. In contrary, the ‘spiders’ comprehend multiple parts coming together from a number of countries. The goal is a single location for assembly of a new component or final product. In the world economy, we usually observe produc-tion processes that are complex mixtures of these two types. In this paper, we label the fragmented production processes as ‘chains’ irrespective of their type. This notion is widely used in the economic literature despite the fact that it rather appeals to the snake-like description of this term.
2 For example, in Poland during the years 1996–2015, the gross domestic product increased by 105%,
The most influential framework used in the study of globalization is the so-called global value chain (GVC) concept. The calculation of GVC incomes is a very interesting methodology to deal with increasing fragmentation of produc-tion, and it surely adds more useful information about competitiveness than the raw export data. However, interpretation of trends in GVC income as trends in competitiveness should be conducted carefully and with a dose of criticism. The reason is that there are very interesting patterns of specialization within different manufacturing of final goods. Results of GVC analysis may be relevant for policy makers and have important policy implications. The application of this methodol-ogy with respect to value added, labor productivity, and capital efficiency in the ten new EU members in transition from the CEE region is the main topic of our contribution. We focus on a relative context and try to answer the question of how important and efficient are the CEE transition economies when it comes to building a comparative advantage of the European Union in global value chains. To the best of our knowledge, this paper is the first study dedicated to the issue of answering the latter question by using some original modifications and exten-sions of methodological developments on an ex-post accounting framework in global value chains presented in the recent IO literature.
The rest of the paper is organized as follows. In Section 2, we conduct a lit-erature review. In the third section, we formulate main research hypotheses. The methodology of studying GVC, the data sources used to measure GVC incomes, as well as indexes of jobs and capital efficiency and discussion on topics that are important for assessing the validity of the empirical results are presented in Sec-tion 4. SecSec-tion 5 is the most important one, as it presents the empirical results along with the respective discussion. The last section provides concluding remarks and some suggestions for future research.
2. Literature review
Early studies on fragmentation were conducted by Fukao et al. (2003) and Ando and Kimura (2005) for Japanese firms, Hanson et al. (2005) for US firms, and Marin (2006) and (2011) for German and Austrian international companies. Macroeconomic evidence has been presented by Hummels et al. (2001) and John-son and Noguera (2012). They found increasing vertical specialization in trade for most countries. Below, we provide a brief review of the literature that provides direct evidence of fragmentation focusing on the value chains of final products.
mainly from Eastern Europe were a source of decline in the German value added per unit of exports. However, export-earned value added as a share of GDP was preserved in Germany. This was possible due to increased specialization and more than proportional growth of exports. In opinion of Sinn (2006), high and rigid wages for unskilled workers were a source of over-specialization on the skill- and capital-intensive segments of the production chain. In the framework of revealed comparative advantage analysis based on gross exports, Di Mauro and Forster (2008) claim that the specialization pattern of the countries from the euro zone was nearly the same between the 1990s and 2000s. In their opinion, the reason for that is the inability of gross export statistics to include the value added in internationally fragmented production. Koopman et al. (2012) analyzed the structure of the export sector of China and found that the latter is mainly based on imported intermediates. The contributors demonstrated that value added in this sector was much lower than suggested by the gross export values. However, the rate of growth of this sector was indeed very high.
It has been found (see e.g., Koopman et al., 2012; Ottaviano et al., 2009) that structures provided by respective columns for particular industries in the Use IO table may only provide average production structures across all firms and all products in those industries and, thus, might be quite different for exporters and non-exporters. However, according to the authors, further evidence on this issue is needed to better understand the nature of the discussed problems.
or by asymmetric productivity growth. A crucial role is played by the type of data analyzed; i.e., data on production or consumption expenditure. In order to conduct GVC analysis, reliable time series data on global input-output tables is required. Such data allows us to map value added sectoral shares (which are the ones that should enter the production functions) into consumption sectoral shares (which are the ones that should enter the utility functions). The key role here is played by the import–export relation in the data, since there are quite different implications of productivity changes in open and closed economies.
The fragmentation of the global production process does not necessarily lead to an increase of unemployment in advanced countries. Grossman and Rossi-Hansberg (2008) found that offshoring may lead to lower output prices and increased demand for the final output. Therefore, the net impact on domestic jobs might be even positive.
In the study by Kuboniwa (2015), which presents an analysis of the role of Russia in GVC, a modified version of the original World Input Output Data (WIOD) was used. The study also uses an alternative definition of value-added trade based on the contribution of Trefler and Zhu (2010). The author proves that this alternative definition is bilaterally equivalent to the traditional definition of TiVA. In the paper, one may also find (rather straightforward) proof of a theorem on the identity between the sum total of a country’s value-added trade balances and gross trade balances (net “gross exports” or net exports). In other words, the author claims that the sum total of the differentials between balances in value-added and those in gross terms equals zero. In addition, it is also proven in the paper that a country’s total factor content of trade is simply its net exports in conventional terminology. Using several versions of aggregated data taken from WIOD, the contributor supplies evidence supporting the theorems. A modification of the approach, with respect to Russia’s trade flows and value-added for sectors related to oil (both crude and refined) and natural gas, are next examined in the empirical part of the paper3.
Our paper is widely based on the innovative paper by Timmer et al. (2013), which concerns with the World fragmentation process. The authors introduce new indicators of competitiveness that take fragmentation into account. Their method measures the value added in each activity in the process, irrespective of its position in the production network. The contributors stress that concepts like ‘global supply chains’ or ‘international production chains’ typically refer to only the physical production stages, whereas the value chain concept used by them refers to a broader set of activities, both in the pre- and post-production phases, including research and development, software, design, branding, finance,
logistics, after-sales services, and system integration activities. In other words, the GVC income measures of Timmer et al. (2013) will take into account the value added in all of these stages of production. This methodology seems especially important in an IT branch where (in the case of many products) a major part of value is added (Ali-Yrkko et al., 2011; Dedrick et al., 2010).
Timmer et al. (2013) use recently compiled time series of input-output data of the world (41 countries and regions, 35 industries, time span 1995–2008). The contributors analyze global value chains (GVC) based on the methodology of Trefler and Zhu (2010), Bems et al. (2011), and Johnson and Noguera (2012). In particular, for every pair of a final good and a country of use, the authors obtain a vector with the value added generated in every possible sector in the countries of origin and a vector with the corresponding number of workers involved in every possible sector in the countries of origin. Next, using a traditional static IO approach, they invert and aggregate the respective matrices of data to obtain the total value added and number of workers in each country used to produce the world final manufactured goods. They call these indicators manufactures global value chains (denoted GVCm) income and jobs. Moreover, the authors keep track of the sectors in each country (including non-manufactures, like ser-vices and agriculture) that originate the GVCm income and jobs.
Timmer et al. (2013) focus in particular on the European region as a whole, since it has undergone a strong process of integration in the past two decades (both inside and outside the European Union). Their main findings can be sum-marized as follows. First of all, they proved that in recent years a strong process of international fragmentation of manufacturing production across Europe has been taking place. This process was the reason for rising differences between changes in gross exports and GVC incomes. In particular, they found that growth in manufactures GVC income during 1995–2008 is essentially lower than the growth in gross manufacturing exports for all European countries (in particular for Austria, Greece, Spain, and Eastern European countries). Moreover, the authors established strong differences in the estimated indexes of comparative advantages of the EU calculated on the basis of the new measures and gross exports. They found that European GVC income is increasing fastest in activities carried out in the production of nonelectrical machinery and transport equipment, and it is declining in activities related to the production of non-durables. In the opinion of the contributors, these findings reflect observed changes in measures of com-parative advantage more precisely than the suggestion based on gross export data that implies rather stable patterns of comparative advantage.
GVC income of a country estimates the income resulted from activities on the domestic territory related to the production of final manufacturing goods by multinational corporations.
We aim to study the production fragmentation of final products. A final product is consumed while intermediate products continue on in the produc-tion process. Total consumpproduc-tion includes both private and public consumpproduc-tion as well as investment. A global value chain of a final product is defined as the value added of all activities that are directly and indirectly required to produce it. This global value chain is identified by the country-industry where the last stage of production is performed before delivery to the final user. The final stage of production in a particular country is not equivalent to the governance of the value chain by a domestic country. For example, large IT corporations from the USA govern the production networks of CEE or India.
In general, the originality of our paper is twofold. First, we focus on a relative context and try to answer the question of how important and efficient the CEE transition economies are when it comes to building a comparative advantage of the European Union in global value chains. To the best of our knowledge, this paper is the first study dedicated to the issue of answering this type of ques-tion regarding the new EU members in transiques-tion. Second, we propose original modifications and extensions of recently presented methodological developments in ex-post accounting framework in global value chains (e.g., those presented in Timmer et al., 2013), which seems to provide a background for interesting em-pirical deliberations on both country-specific level as well as for the whole group of CEE economies analyzed.
3. Main research conjectures
In general, each research hypothesis examined in this paper consists of three major components. First, in each hypothesis, we refer to one of the three rela-tive measures discussed in this study. These are the relarela-tive value added in the group of CEE economies in transition and the measures of relative productivity and capital efficiency. Second, we try to express (and verify) our suppositions on the dynamics of these indexes over the period under study. Finally, we try to extend the general statements on the whole group of examined CEE transition economies by focusing on country- and sector-specific results.
redi-rected to other sectors (especially services). The latter was accompanied with the ongoing process of globalization, especially in the sphere of economic openness and information flows; this had a significant positive causal impact on economic growth in new EU member countries from the CEE region (Gurgul and Lach, 2014). Since we are interested in the analysis of value added in CEE transition economies in the relative context with respect to the EU in total, we should also underline that, in recent years, the level of technological progress in new EU members has not reached the average EU level as of yet4. This implies that these economies are still not playing a key role in high-technology sectors but rather focus on usage of their natural resources/conditions and aim at specializing in rather low-technology production; e.g., in the sector of agriculture, food production, products of wood, etc. Moreover, the energy sectors of the largest EU members from the CEE (e.g. Poland) are still heavily dependent on coal and lignite, while the richest EU coun-ties have already implemented many programs aimed at moving toward alternative sources of energy; e.g., renewable sources or nuclear energy.
On the other hand, during the period of transition, some sectors of CEE econo-mies have grown dramatically (especially after EU accession). A good example here would be the sector of tourism. After the collapse of the Iron Curtain, the societies of CEE transition economies gained the possibility of traveling freely abroad. At the same time, the tourist offerings of the region have been continuously expanding.
All of the above-mentioned observations may have a significant impact on the levels of sector-specific value added in new EU member countries measured as a share of total value added by all EU countries in the framework of GVC. Taking into account these remarks (along with some basic characteristics of the new EU member countries from CEE), one may expect the following hypothesis to hold true:
Hypothesis 1: The role of selected CEE economies in transition in the creation of value added with respect to the total value added in the European Union in the GVC framework was biggest in the case of the following sectors: Agriculture, Hunting, Forestry and Fishing, Mining and Quarrying, Wood and Products of Wood and Cork, Other Non-Metallic Mineral, and Other Supporting and Auxiliary Transport Activities; Activities of Travel Agencies. When it comes to the country-specific results, one may expect that, among new EU members in transi-tion, the highest shares in the EU total GVC value added were obtained
in the largest countries, e.g. Poland and Romania5.
4 For example, the share of R&D expenditure in GDP in new EU members in transition is still much
lower as compared to old EU countries.
Beside analyzing the relative sector-specific shares in the value added in the group of the ten CEE economies in this paper, we propose new GVC-embedded measures of productivity and capital efficiency and focus on an analysis of their levels and growth rates in two sub-periods: before and after EU expansion6. At this place one should underline that, contrary to the values of shares in the EU total GVC value added, the growth rates of productivity are expected to be higher in smaller CEE transition economies. The latter follows from the fact that the smaller the size of the country, the larger the gain from trade. A small country can successfully export the surplus production to a large country (with large market capacity), and it can take advantage of foreign trade (comp. the theory of comparative costs). Thus, small countries are usually encouraged to specialize (or even forced to, due to a scarcity of primary products). In contrary, large countries typically do not suffer from a scarcity of primary products. However, they could have problems with respect to export of (large) excess output to smaller markets (with small market capacity). Therefore, they are not forced (or even encouraged) to specialize. Taking into account these observations (along with the history of structural change in CEE transition economies in the past 25 years), the compo-sitions of key sectors in CEE transition economies and West European countries as well as the differences between labor markets in both groups of EU countries, one may formulate the following conjecture:
Hypothesis 2: After the two decades of transition, productivity in the ten CEE economies was still much lower as compared to the EU average for most of the sectors. However, during this period, the growth rates of the measures of productivity were, in general, positive. Moreover, they increased at a higher rate after EU accession. The highest levels
and growth rates of productivity were found for smaller CEE countries.
Before the beginning of the transition, the group of CEE countries strongly relied on fixed capital, which was an important input in manufacturing. One of the consequences of economic transition was de-industrialization in CEE along with the following shift towards new types of economic activities (especially ser-vices). The latter was also accompanied with the process of privatization. Taken altogether, one may expect that the levels of capital efficiency in CEE transition economies with respect to the EU average will be much higher that the corre-sponding indexes of relative productivity. Moreover, one could expect that, after EU accession, the role of capital input in the process of production and creation
of value added in the new EU members in transition could be even smaller, due to the shift towards less capital-intensive activities. These general remarks suggest the formulation of our final hypothesis:
Hypothesis 3: After the two decades of transition, capital efficiency in the ten CEE economies in 2009 was comparable to the EU average for most of the sectors. Moreover, during this period, the growth rates of the measures of the capital efficiency were, in general, positive. However, the growth rates of these indexes dropped after EU accession. The high-est levels and growth rates of indexes of capital efficiency were found for smaller CEE countries.
The hypotheses listed above will be verified using the methodology and da-taset presented in Section 4. In the next section, we will briefly present the main empirical findings of the paper.
4. Dataset and research methodology
In order to analyze the dynamics of value added shares as well as the indexes of productivity and capital efficiency in the ten CEE transition economies, we will use the global value chain (GVC) approach introduced in Timmer et al. (2013). In order to provide an ex-post accounting of the value of final demand, we will trace the value added at the various stages of production in an international input-output model. First, we will briefly introduce the accounting framework drawing on the exposition in Johnson and Noguera (2012) and Timmer et al. (2013); then, we will generalize and extend their approach to analyze the value added by specific production factors in the case of the group of new EU members in transition.
Let us now shed some light on the GVC approach. Henceforth, we assume that there are C countries, S sectors, and F production factors. Under the term
country-sector, we shall understand one specific sector operating in one selected economy. Each of these country-sectors produces one good; thus, there are SC
government as well as gross fixed capital formation (investment) and changes in inventories and valuables. Following Timmer et al. (2013), we use the simplifying notation for each product, with i denoting the source country, j denoting the des-tination country, s standing for the source sector, and r denoting the destination sector. We assume that product market clearing takes place; thus, the quantity of a good produced in a particular country-sector must equal the quantities of this product used domestically and abroad. For every year t, the product market clearing condition takes the following form:
y si f s m s r
t ij t j ij t r j
( )=
∑
( )+∑
∑
( , ) (1)Where yt
i(s) stands for the value of output in sector s of country i in year t,
ft
ij(s) denotes the value of goods shipped from this sector for final use in country j
in year t, and mt
ij(s, r) stands for the value of goods shipped from this sector for
intermediate use by sector r in country j in year t7.
Using simple matrix algebra, the market clearing conditions (1) for each of the SC goods can be combined into a compact global input-output system. In order to obtain this compact form, let Yt denote the SC × 1 vector of production
in year t, which is obtained by row-wise concatenation of output levels (each in the form of a S × 1 vector) in each country-sector:
Y Y Y
Y
Y y s i
t t t C t i t i t s S = = = = 1 2 1 1
⋮ , [ ( )] ,..., , ,...,CC (2)
Analogously, we may define the SC × 1 vector of global final demand (denoted as Ft) by stacking world final demand for output from each country-sector fi
t( s). The latter takes the form of a summation of demand for a product of the sector
s from any country, i.e.,
fi s f s i C s S
t
ij t j
( )=
∑
( ), =1,..., , =1,..., (3)Using this notation, we may write:
F F F
F
F f s i
t t t C t i t i t s S = = = = 1 2 1 1
⋮ , [ ( )] ,..., , ,...,CC (4)
For each year t, we define a SC × SC global intermediate input coefficient matrix At = [a
t
wz]w,z=1,…,SC using the following formula:
a m s r
y r wz t ij t i t = ( , )
( ) , for w = s + (i – 1)S, z = r + (j – 1)S (5)
where i, j = 1, …, C, s, r = 1, …, S. The elements at
wz represent the output
from sector s in country i used as intermediate input by sector r in country j
as a share of output in the latter sector in year t (Timmer et al., 2013). Using matrix At, we maynowanswer the question of which combination of various
intermediate products (both domestic and foreign) are required to produce one unit of each country-sector product. Using this definition, we can now re-write the global market clearing conditions (1) in a compact IO-based form:
Yt = AtYt + Ft (6)
or equivalently:
Yt = (I – At)
–1F
t (7)
where I is an SC × SC identity matrix.
Using the approach of Timmer et al. (2013), one may attribute the value of final demand for a specific product to value added in all country-sectors that directly and indirectly participate in the production process of the final good. Throughout this paper, we define value added in a traditional way; namely, as the difference between gross output value (at basic prices) and the cost of intermediate goods and services (at purchaser’s prices). For each sector s and country c, we define
pt
c(s) as the value added per unit of gross output produced in year t, and create
the stacked SC × 1-vector pt
VA containing these (direct) value added coefficients:
p p p p C p c p VA t VA t VA t VA t VA t c t = = ( ) ( ) ( ) , ( ) 1 2 ⋮ where (( ) ( ) ( ) 1 2 p p S c t c t ⋮ (8)
In order to take ‘indirect’ contributions into account, we derive the
SC × 1-vector of value added levels vt
VA as generated to produce a final demand
vector Ft. To get this vector, the gross outputs needed for production of this final
demand should be multiplied by the elements of the direct value added coefficient vector pt
VA. After multiplying (7) by diag(p
t
VA), one gets
8:
8 Henceforth, for a given vector [x
j]j=1,…,n the symbol diag(xj) denotes the n × n diagonal matrix with
vt
VA = diag(p
t
VA)(I – At)
–1
Ft (9)
where: v v v v VA t VA t VA t VA C t = , , , 1 2 ⋮ (10)
Using model (9), one can now multiply matrix diag(pt
VA)(I –At)
–1 with any vec-tor of final demand levels F0t to find out which value added levels vt
VA should be
attributed to this particular set of final demand levels in all C countries9.
The GVC-embedded methodology outlined so far are based on suggestions of traditional IO literature and has already been applied in empirical research (see e.g., Timmer et al., 2013). Below, we will briefly present a modification of this approach aimed at analyzing dynamics of value added, productivity, and capital efficiency in ten new EU members in transition. Our goal is to es-tablish a GVC-embedded research framework to examine the dynamics of the discussed variables in ten CEE economies in a relative context with respect to the EU total.
For each sector s* and year t, let us define the SC × 1 global final demand vector using the following formula:
F s
F s F s
F s
F s f s
t t t C t i t i t ( ) ( ) ( ) ( ) , ( ) ( * * * * * * = = 1 2 ⋮ )) ( ) *
e s (11)
where e(s*) = [eq]q=1,…,S is an S × 1 vector defined as:
e q s
otherwise q = = 1 0 , , * (12)
9 Although the ex-post accounting framework described above does not allow us to explicitly deal
In other words, the vector Ft(s
*) contains the
C values of final demand for sector s* across all the countries. For remaining sectors j (j≠s*), the correspond-ing entries in vector Ft(s
*) are all equal to zero. Using formulas (8)–(10), we may now establish the distribution of value added to be attributed to the set of final demand levels contained in vector Ft(s
*):
vVAt s diag p I A F s
VA t
t t
( )* =
( )
( − )−1 ( )* (13)We will now focus on the construction of GVC-embedded indexes measuring the role of selected CEE economies in transition in the creation of value added with respect to the total production in the European Union. We are also interested in analyzing the dynamics of the indexes of productivity and capital efficiency in the new EU member countries in transition. Let JEU27 and JCEE denote the sets
of indexes for EU2710 and the ten new EU members from the CEE region11. For each sector s* and year t, we may calculate the value added in GVC in the whole EU27 and in the group of ten CEE economies using equation (13). Next, we may define the Value Added Share (VAS) attributed in the new EU members with respect to the EU27 total using the following formula:
VAS s t v s
v s
CEE EU
VA j t j J
VA j t j J
CEE
EU
27
27
100
( , ) ( )
( ) %
* ,
*
, *
= ∈ ×
∈
∑
∑
(14)For example, we may use formula (14) to assess the size of value added at-tributed to the global final demand in agriculture in the ten CEE economies in transition, with respect to the value added in this sector in the whole European Union12.
One can generalize the decomposition of the value of final demand outlined above to analyze the value and quantities used of specific production factors. In this paper, we focus on two basic types of inputs: labor and capital. We define
pt
L,c(s) as the direct labor input per unit of gross output produced in sector s in
10 Due to a lack of required data on Croatia throughout this paper, we do not focus on the EU28. 11 The ten new EU members are as follows (respective abbreviations are given in brackets): Bulgaria
(BGR), Czech Republic (CZE), Estonia (EST), Hungary (HUN), Latvia (LVA), Lithuania (LTU), Poland (POL), Romania (ROM), Slovakia (SVK), and Slovenia (SVN). It should be mentioned that, during the period of 2004–2010, 12 countries joined the EU. However, Malta and Cyprus have not been taken into consideration in this study because they have never been in transition.
12 It is clear that VAS
CEE|EU27(s*,t) ∈ [0,100%] for all sector and all years. For example, if VASCEE|EU27(s*,t) = 10%, this implies that 10% of GVC value added in the sector s* in year t in the whole European Union was
country c in year t. Using an analogous formula to equation (8), we can now obtain a stacked SC × 1 vector pt
L containing these (direct) coefficients.
Analo-gously to the case of analysis of value added, the elements of vector pt
L do not
account for labor embodied in the intermediate inputs used. However, analo-gous to formula (13), for each sector s* and each year t, we may derive all direct and indirect labor inputs needed for the production of a specific final product:
v sL diag p I A F s
t
L t
t t
( )* =
( )
( − )−1 ( )* (15)Using this formula, we may now simply calculate the ratio of labor (labor share, denotedLS) used in the global production processes in sector s* in the group of ten CEE economies, with respect to the labor used in the whole EU27:
LS s t
v s v s CEE EU L j t j J L j t j J CEE EU 27 27 100 ( , ) ( ) ( ) % * , * , * = ∈ × ∈
∑
∑
(16)Using analogous formulas to (15)–(16), we may define respective indicators for the second input considered – capital:
vC s diag p I A F s
t
C t
t t
( )* =
( )
( ) ( )*− −1 (17)
Using this formula, we may now simply calculate the ratio of capital (capital share, denotedCS) used in the global production processes in sector s* in the group of ten CEE economies with respect to the labor used in the whole EU27:
CS s t
v s v s CEE EU C j t j J C j t j J CEE EU 27 27 100 ( , ) ( ) ( ) % * , * , * = ∈ × ∈
∑
∑
(18)The labor (LSCEE|EU27(s
*,t)) and capital (CS
CEE|EU27(s
*,t)) ratios defined above may serve as a basis to define the following GVC-embedded index of workforce productivity:
PRODUCTIVITY s t VAS s t
LS s t
CEE EU CEE EU CEE EU 27 27 27 ( , ) ( , ) ( , ) * * *
and the GVC-embedded index of capital efficiency:
CAP EFF s t VAS s t
CS s t
CEE EU
CEE EU
CEE EU
_ ( , ) ( , )
( , ) %
*
*
*
27
27
27
100
= × (20)
The interpretation of both indexes defined above is rather straightforward. If, for example, PRODUCTIVITYCEE|EU27(s
*,t) = 50%, this implies that, in the GVC framework, the labor used to create one unit of value added in sector s* in year t in the ten CEE economies in transition was twice as high as the labor used in all of the EU27 countries.
To measure share in value added and calculate the indexes of productivity and capital efficiency for each of the EU27 countries, we need to track coun-try gross output and value added by induscoun-try, the global input-output matrix, final goods shipments over time, as well as labor and capital inputs. This type of data is available from the recently released World Input-Output Database (WIOD). In this paper, we use the most-recent world IO tables published by the WIOD, which cover the period 1995–2009 and provide data on 41 regions of the world (40 major countries and the aggregate data on the rest of the world). Thus, the respective IO matrices (vectors) are 1435 × 1435 (1435 × 1) in size13. For each sector s*∈ {1,35} and year t ∈ {1995,2009}, the vector of final output Yt, input coefficient matrix At, sector-specific final demand Fi
t( s*), and vector of direct value added coefficient ˆt
VA
p are derived directly from the WIOD database14. We used the WIOD data on hours worked to proxy the direct labor input per unit of gross output (i.e., vector ˆt
L
p ) and the WIOD data on gross fixed capital formation as approximation of direct capital input per unit of gross output (vector ˆt
C p )15.
5. Empirical results
In order to analyze the role of the new EU members in transition in the cre-ation of value added in the European Union within the global value chain (GVC)
13 WIOD consists of a series of detailed and reliable databases and covers 27 EU countries and 13 other
major countries in the world. For more details on the WIOD database, see Timmer (2012).
14 If e stands for a SC × 1 summation vector containing ones, one may write (^p ) ( ) (e I A)
VA t ′
= ′ − . This implies that, in (9), the elements of the vector of distribution of the value of final output as attrib-uted to sectors in the value chain of any product (vt
VA) add up to the elements of the vector of final
demand Fi t
(s*) (for a short proof, see Timmer et al., 2013).
15 We used exchange rates published by the World Bank to transform the original WIOD data on gross
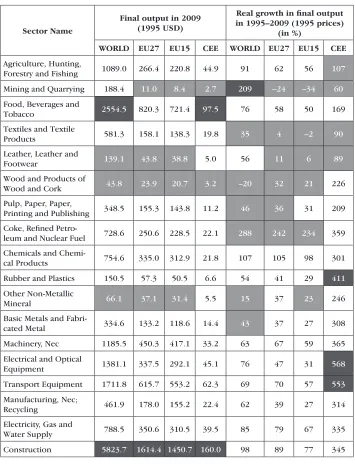
framework, one should first take a look at data on the size and dynamics of global final demand for all of the products examined. For this purpose, we used the WIOD input-output tables expressed in the previous years’ prices (covering the period 1996–2010). Next, we used the chain rule to obtain the final demand levels in 2009 expressed in 1995 US dollars. Finally, we calculated real growth rates for all 35 sectors. Table 1 presents the respective results16.
There are some similarities when it comes to the list of the sectors with the biggest and lowest values of final demand in EU27, EU1517, the group of ten CEE economies in transition, and the world total. The sectors of Construction, Real Estate Activities, Public Admin and Defense, Compulsory Social Security, and Health and Social Work were listed among the sectors with the largest levels of final demand, while the sectors of Wood and Products of Wood and Cork
and Water Transport were characterized with the smallest levels of final demand (no matter the group of economies examined). Except for the Water Transport
sector, all remaining sectors experienced more than 60% of real growth of final demand in the group of ten CEE economies under study. Moreover, in the case of some sectors, the final demand levels in the ten CEE economies have risen by more than six times during the period of 1995–2009. More attention should be given to the sector of Mining and Quarrying in the case of which one could see a significant rise in global final demand (in particular, a 60% rise in the case of the ten CEE economies). At the same time, the final demand for the products of this sector has fallen in the remaining group of EU countries, especially the old EU members (EU15).
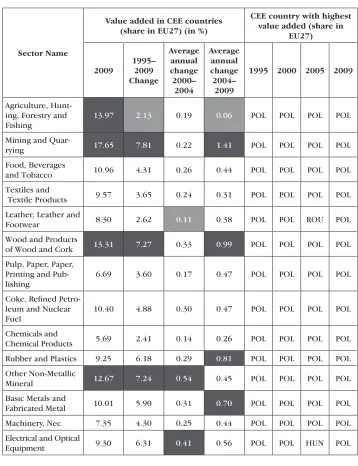
In the next stage, we used equation (14) to analyze the role of new EU members in transition (as a group of ten countries and individually for each country) in the creation of value added in the European Union within the global value chain (GVC) framework. The results of this analysis are presented in Table 218.
16 In addition to the EU-related data in Table 1, we also provide data on the discussed trade statistics
for all countries in the world (see the column named World). The latter illustrates the evolution of GVC value added from a global perspective.
17 EU15 consist of the 15 so-called old members of the EU.
18 The goal of this paper is to analyze the GVC value added in the ten CEE economies expressed as
One can list several sectors in the case of which the GVC value added in 2009 in CEE transition economies (measured as a share of the EU27 GVC total value added) was largest. These were Agriculture, Hunting, Forestry and Fishing,
Mining and Quarrying, Wood and Products of Wood and Cork, Other Non-Metallic Mineral, and Other Supporting and Auxiliary Transport Activities,
Activities of Travel Agencies. In other words, in the case of these sectors, the group of ten new EU members in transition had the greatest effect on the value added in the whole EU in global production processes. With just a few excep-tions, the highest share of value added among the ten CEE countries was usually reported for Poland19.
When it comes to the analysis of the dynamics of the measures of value added in the examined CEE economies, one should underline that, during the period of 1995–2009, the sectors of Mining and Quarrying, Wood and Prod-ucts of Wood and Cork, and Other Non-Metallic Mineral experienced the highest rise in the share of the EU27 GVC value added20. In general, the share of the GVC value added in the sector of Mining and Quarrying in ten CEE economies in the EU27 GVC value added rose during the transition period. Moreover, the highest growth rate was observed especially after EU accession. This result, however, should be interpreted together with the outcomes pre-sented in Table 1; namely, the shrinking demand for coal observed in the EU15 countries accompanied with a shift towards low-carbon energy sources evident in the richest European economies. Taken altogether, these results provide solid support for the Hypothesis 1.
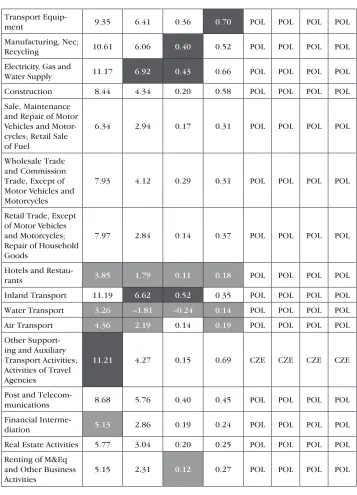
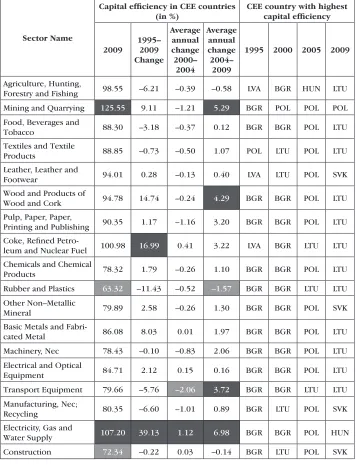
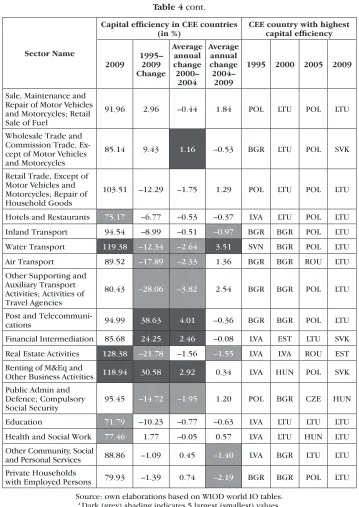
In the next stage, for each sector s*∈ {1,35} and each year t∈ {1995,2009}, we calculated the indexes of productivity and capital efficiency for the group of ten CEE countries examined (using formulas (19) and (20)). The results are presented in Tables 3 and 4.
In the case of most of the sectors, the index of productivity in the ten CEE economies in 2009 was still below 50%. This implies that, in general, the CEE economies in transition were still using approximately twice as much labor to create one unit of value added as compared to the EU27 average. The highest levels of the index of productivity (around 70–80%) were obtained for the sectors of Other Supporting and Auxiliary Transport Activities; Activities of Travel Agencies
and Sale, and Maintenance and Repair of Motor Vehicles and Motorcycles;
Retail Sale of Fuel.
19 Using the formula that allows changing the benchmark from EU27 to EU15 (see footnote 18), one
may easily see that the ordering of sectors according to the relative GVC value added in the ten CEE economies in transition is exactly identical (no matter if the EU27 or EU15 was taken as a benchmark).
20 In the case of the sectors of Wood and Products of Wood and Cork and Other Non-Metallic
Beside the two mentioned sectors, the largest positive changes of the index of productivity during the period of 1995–2009 were obtained for the sector of
Mining and Quarrying. Moreover, the growth rates of these indexes increased after EU accession. When it comes to the data on individual counties, it is worth underling that the index of productivity was highest most frequently for Slovenia. In other words, these results provide support for Hypothesis 2.
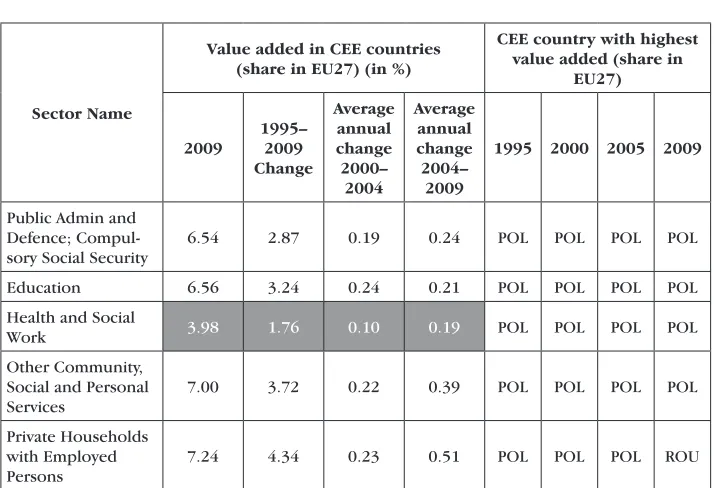
Quite different results were obtained for the index of capital efficiency. In the case of most of the sectors, this index in 2009 was close to (or higher than) 100% in the case of the group of ten CEE economies in transition. In general, this implies that, in order to create one unit of value added, the CEE economies were using similar amounts of capital input as the average values of this input in the whole EU27. The highest levels of the index of capital efficiency (around 110–120%) were obtained for the sectors of Real Estate Activities, Mining and Quarrying, Renting of M&Eq and Other Business Activities, and Water Transport.
The largest positive changes of the index of capital efficiency during the period of 1995–2009 were obtained for the sectors of Electricity, Gas and Water Sup-ply, Post and Telecommunications, Financial Intermediation, and Renting of M&Eq and Other Business Activities. In contrary to the results presented in Table 4, the growth rates of these indexes dropped after EU accession21. These results, in turn, provide support for Hypothesis 1.
In addition to the results presented in Tables 1–4 (which were dedicated to the whole group of ten CEE economies), we conducted a detailed country- and sector-specific individual analysis of the shares in value added and indexes of productivity and capital efficiency for all ten CEE economies. Since this analysis was carried out for individual countries, the results significantly extend the group-overall information presented in Tables 1–4. We focused on the top five sectors with respect to the shares in the GVC EU27 value added. The list of the top value-added sectors is as follows: Agriculture, Hunting, Forestry and Fishing, Mining and Quarrying, Wood and Products of Wood and Cork,Other Non-Metallic Mineral, and Other Supporting and Auxiliary Transport Activities, Activi-ties of Travel Agencies. The respective results are presented in the Figures 1–5.
It is worth mentioning that, in the case of the sector of Mining and Quarry-ing, one could notice extremely small or even negative values of VAS in the case of some CEE transition economies. The latter implies that, in the global-market framework, some CEE countries have experienced a situation when the final demand for products of the sector Mining and Quarrying was equal to or even smaller than the intermediate consumption. The latter is evidence of inefficiency of this sector in the ten new EU members in transition in the global framework, as it did not make enough profit to cover the cost of doing business. In general, the detailed results presented in Figures 1–5 support Hypotheses 1–3.
Table 1
Levels and real growth rates of final demand in the 35 sectorsa
Sector Name
Final output in 2009 (1995 USD)
Real growth in final output in 1995–2009 (1995 prices)
(in %)
WORLD EU27 EU15 CEE WORLD EU27 EU15 CEE
Agriculture, Hunting,
Forestry and Fishing 1089.0 266.4 220.8 44.9 91 62 56 107
Mining and Quarrying 188.4 11.0 8.4 2.7 209 –24 –34 60
Food, Beverages and
Tobacco 2554.5 820.3 721.4 97.5 76 58 50 169
Textiles and Textile
Products 581.3 158.1 138.3 19.8 35 4 –2 90
Leather, Leather and
Footwear 139.1 43.8 38.8 5.0 56 11 6 89
Wood and Products of
Wood and Cork 43.8 23.9 20.7 3.2 –20 32 21 226
Pulp, Paper, Paper,
Printing and Publishing 348.5 155.3 143.8 11.2 46 36 31 209
Coke, Refined
Petro-leum and Nuclear Fuel 728.6 250.6 228.5 22.1 288 242 234 359
Chemicals and
Chemi-cal Products 754.6 335.0 312.9 21.8 107 105 98 301
Rubber and Plastics 150.5 57.3 50.5 6.6 54 41 29 411
Other Non-Metallic
Mineral 66.1 37.1 31.4 5.5 15 37 23 246
Basic Metals and
Fabri-cated Metal 334.6 133.2 118.6 14.4 43 37 27 308
Machinery, Nec 1185.5 450.3 417.1 33.2 63 67 59 365
Electrical and Optical
Equipment 1381.1 337.5 292.1 45.1 76 47 31 568
Transport Equipment 1711.8 615.7 553.2 62.3 69 70 57 553
Manufacturing, Nec;
Recycling 461.9 178.0 155.2 22.4 62 39 27 314
Electricity, Gas and
Water Supply 788.5 350.6 310.5 39.5 85 79 67 335
Sale, Maintenance and Repair of Motor Vehicles and Motorcycles; Retail Sale of Fuel
558.8 296.9 276.4 20.1 69 97 90 282
Wholesale Trade and Commission Trade, Ex-cept of Motor Vehicles and Motorcycles
2048.2 677.2 618.5 57.4 85 89 80 308
Retail Trade, Except of Motor Vehicles and Motorcycles; Repair of Household Goods
2378.3 632.0 575.1 55.3 62 89 82 208
Hotels and Restaurants 1936.3 773.0 740.4 29.7 89 112 107 330
Inland Transport 842.8 267.3 232.2 34.9 83 69 54 355
Water Transport 113.6 42.6 41.8 0.8 173 183 193 –6
Air Transport 233.4 72.9 69.8 2.7 77 98 94 281
Other Supporting and Auxiliary Transport Activities; Activities of Travel Agencies
260.8 140.8 123.4 16.9 102 106 95 241
Post and
Telecommuni-cations 829.8 259.2 234.7 23.9 168 144 128 645
Financial Intermediation 2097.6 648.9 610.0 37.7 137 183 173 659
Real Estate Activities 4757.6 1649.1 1534.6 110.6 101 109 100 408
Renting of M&Eq and
Other Business Activities 1608.1 534.6 502.6 31.6 157 134 127 359
Public Admin and Defence; Compulsory Social Security
6110.2 1454.1 1348.8 101.5 112 100 93 281
Education 2051.6 908.5 840.8 65.8 102 90 83 310
Health and Social Work 4436.7 1698.5 1623.7 72.8 125 134 129 357
Other Community, Social and Personal Services
1970.7 744.5 683.8 58.2 93 100 91 368
Private Households
with Employed Persons 96.5 70.8 67.7 2.9 114 126 122 240
Source: own elaborations based on WIOD world IO tables in previous years’ prices.
a Dark (grey) shading indicates 5 largest (smallest) values.
Table 2
Share in value added attributed in the new EU members with respect to the EU27 totala
Sector Name
Value added in CEE countries (share in EU27) (in %)
CEE country with highest value added (share in
EU27)
2009
1995– 2009 Change
Average annual change
2000– 2004
Average annual change
2004– 2009
1995 2000 2005 2009
Agriculture, Hunt-ing, Forestry and Fishing
13.97 2.13 0.19 0.06 POL POL POL POL
Mining and
Quar-rying 17.65 7.81 0.22 1.41 POL POL POL POL
Food, Beverages
and Tobacco 10.96 4.31 0.26 0.44 POL POL POL POL
Textiles and
Textile Products 9.57 3.65 0.24 0.31 POL POL POL POL
Leather, Leather and
Footwear 8.30 2.62 0.11 0.38 POL POL ROU POL
Wood and Products
of Wood and Cork 13.31 7.27 0.33 0.99 POL POL POL POL
Pulp, Paper, Paper, Printing and Pub-lishing
6.69 3.60 0.17 0.47 POL POL POL POL
Coke, Refined Petro-leum and Nuclear Fuel
10.40 4.88 0.30 0.47 POL POL POL POL
Chemicals and
Chemical Products 5.69 2.41 0.14 0.26 POL POL POL POL
Rubber and Plastics 9.25 6.18 0.29 0.81 POL POL POL POL
Other Non-Metallic
Mineral 12.67 7.24 0.54 0.45 POL POL POL POL
Basic Metals and
Fabricated Metal 10.01 5.90 0.31 0.70 POL POL POL POL
Machinery, Nec 7.35 4.30 0.25 0.44 POL POL POL POL
Electrical and Optical
Transport
Equip-ment 9.35 6.41 0.36 0.70 POL POL POL POL
Manufacturing, Nec;
Recycling 10.61 6.06 0.40 0.52 POL POL POL POL
Electricity, Gas and
Water Supply 11.17 6.92 0.43 0.66 POL POL POL POL
Construction 8.44 4.34 0.20 0.58 POL POL POL POL
Sale, Maintenance and Repair of Motor Vehicles and Motor-cycles; Retail Sale of Fuel
6.34 2.94 0.17 0.31 POL POL POL POL
Wholesale Trade and Commission Trade, Except of Motor Vehicles and Motorcycles
7.93 4.12 0.29 0.31 POL POL POL POL
Retail Trade, Except of Motor Vehicles and Motorcycles; Repair of Household Goods
7.97 2.84 0.14 0.37 POL POL POL POL
Hotels and
Restau-rants 3.85 1.79 0.11 0.18 POL POL POL POL
Inland Transport 11.19 6.62 0.52 0.35 POL POL POL POL
Water Transport 3.26 –1.81 –0.24 0.14 POL POL POL POL
Air Transport 4.36 2.19 0.14 0.19 POL POL POL POL
Other Support-ing and Auxiliary Transport Activities; Activities of Travel Agencies
11.21 4.27 0.15 0.69 CZE CZE CZE CZE
Post and
Telecom-munications 8.68 5.76 0.40 0.45 POL POL POL POL
Financial
Interme-diation 5.13 2.86 0.19 0.24 POL POL POL POL
Real Estate Activities 5.77 3.04 0.20 0.25 POL POL POL POL
Renting of M&Eq and Other Business Activities
[image:24.468.56.413.109.604.2]5.15 2.31 0.12 0.27 POL POL POL POL
Sector Name
Value added in CEE countries (share in EU27) (in %)
CEE country with highest value added (share in
EU27)
2009
1995– 2009 Change
Average annual change
2000– 2004
Average annual change
2004– 2009
1995 2000 2005 2009
Public Admin and Defence; Compul-sory Social Security
6.54 2.87 0.19 0.24 POL POL POL POL
Education 6.56 3.24 0.24 0.21 POL POL POL POL
Health and Social
Work 3.98 1.76 0.10 0.19 POL POL POL POL
Other Community, Social and Personal Services
7.00 3.72 0.22 0.39 POL POL POL POL
Private Households with Employed Persons
7.24 4.34 0.23 0.51 POL POL POL ROU
Source: own elaborations based on WIOD world IO tables.
[image:25.468.57.414.105.349.2]a Dark (grey) shading indicates 5 largest (smallest) values.
Table 2 cont.
Table 3
Indexes of productivity in the new EU members with respect to the EU27 totala
Sector Name
Productivity in CEE countries (in %)
CEE country with highest productivity
2009
1995– 2009 Change
Average annual change 2000–
2004
Aver-age annual change 2004–
2009
1995 2000 2005 2009
Agriculture, Hunting,
Forestry and Fishing 27.43 6.62 0.37 0.72 CZE SVK EST SVK
Mining and Quarrying 62.36 46.97 2.69 5.02 SVN SVN SVN SVK
Food, Beverages and
[image:25.468.58.411.441.597.2]Textiles and Textile
Products 23.69 5.06 0.18 0.82 SVN SVN SVN SVN
Leather, Leather and
Footwear 21.29 0.42 –0.18 0.55 SVN SVN SVN SVN
Wood and Products of
Wood and Cork 39.98 23.59 1.12 3.09 SVN SVN SVN LVA
Pulp, Paper, Paper,
Print-ing and PublishPrint-ing 49.00 25.82 1.51 2.69 SVN SVN SVN SVN
Coke, Refined Petroleum
and Nuclear Fuel 24.83 11.47 0.64 1.28 SVN SVN HUN SVK
Chemicals and Chemical
Products 39.44 18.14 1.58 0.58 SVN SVN SVN SVN
Rubber and Plastics 53.33 30.30 1.94 2.72 SVN SVN SVN SVN
Other Non–Metallic
Mineral 37.47 19.74 1.81 0.42 SVN SVN SVN SVN
Basic Metals and
Fabri-cated Metal 41.22 13.94 0.86 1.33 SVN SVN SVN SVN
Machinery, Nec 35.62 22.33 1.55 1.71 SVN SVN SVN SVN
Electrical and Optical
Equipment 40.15 20.52 1.72 0.82 SVN SVN SVN SVN
Transport Equipment 41.36 22.72 1.68 1.48 SVN SVN SVN SVN
Manufacturing, Nec;
Recycling 34.27 11.34 0.55 1.45 SVN SVN SVN SVN
Electricity, Gas and Water
Supply 32.32 18.10 1.02 1.98 SVN SVN SVN SVK
Construction 39.42 15.53 1.48 0.19 SVN SVN SVN SVN
Sale, Maintenance and Repair of Motor Vehicles and Motorcycles; Retail Sale of Fuel
72.58 42.89 1.56 6.83 SVN SVN SVN SVN
Wholesale Trade and Commission Trade, Except of Motor Vehicles and Motorcycles
36.97 13.91 1.30 0.22 SVN SVN SVN SVN
Retail Trade, Except of Motor Vehicles and Motorcycles; Repair of Household Goods
[image:26.468.57.411.110.606.2]46.73 6.72 0.05 1.57 SVN SVN SVN SVN
Sector Name
Productivity in CEE countries (in %)
CEE country with highest productivity
2009
1995– 2009 Change
Average annual change 2000–
2004
Aver-age annual change 2004–
2009
1995 2000 2005 2009
Hotels and Restaurants 35.03 10.92 0.70 0.97 SVN SVN SVN SVN
Inland Transport 45.01 24.81 1.84 1.60 SVN SVN SVN SVK
Water Transport 31.15 10.63 0.63 1.08 SVN SVN SVN SVN
Air Transport 40.54 25.00 1.65 2.13 SVN SVN SVN SVN
Other Supporting and Auxiliary Transport Activities; Activities of Travel Agencies
88.22 55.61 4.21 3.37 SVN SVN SVN SVN
Post and
Telecommuni-cations 54.79 33.75 2.38 2.49 SVN SVN SVN SVN
Financial Intermediation 60.46 31.12 2.87 0.61 SVN SVN SVN SVN
Real Estate Activities 22.56 9.25 0.94 –0.03 SVN SVN SVN SVN
Renting of M&Eq and Other Business Activities
58.33 31.08 2.12 2.47 SVN SVN POL SVN
Public Admin and Defence; Compulsory Social Security
37.18 10.52 0.47 1.45 SVN SVN SVN SVN
Education 28.22 11.90 0.84 0.87 SVN SVN SVN SVN
Health and Social
Work 29.32 13.33 0.81 1.30 SVN SVN SVN SVN
Other Community, Social and Personal Services
47.32 19.64 0.86 2.77 SVN SVN SVN SVN
Private Households with Employed Persons
28.23 14.52 1.66 –0.51 SVN SVN SVN SVN
Source: own elaborations based on WIOD world IO tables.
[image:27.468.57.413.104.567.2]a Dark (grey) shading indicates 5 largest (smallest) values.
Table 4
Indexes of capital efficiency in the new EU members with respect to the EU27 totala
Sector Name
Capital efficiency in CEE countries (in %)
CEE country with highest capital efficiency
2009
1995– 2009 Change
Average annual change 2000–
2004
Average annual change 2004–
2009
1995 2000 2005 2009
Agriculture, Hunting,
Forestry and Fishing 98.55 –6.21 –0.39 –0.58 LVA BGR HUN LTU
Mining and Quarrying 125.55 9.11 –1.21 5.29 BGR POL POL POL
Food, Beverages and
Tobacco 88.30 –3.18 –0.37 0.12 BGR BGR POL LTU
Textiles and Textile
Products 88.85 –0.73 –0.50 1.07 POL LTU POL LTU
Leather, Leather and
Footwear 94.01 0.28 –0.13 0.40 LVA LTU POL SVK
Wood and Products of
Wood and Cork 94.78 14.74 –0.24 4.29 BGR BGR POL LTU
Pulp, Paper, Paper,
Printing and Publishing 90.35 1.17 –1.16 3.20 BGR BGR POL LTU Coke, Refined
Petro-leum and Nuclear Fuel 100.98 16.99 0.41 3.22 LVA BGR LTU LTU
Chemicals and Chemical
Products 78.32 1.79 –0.26 1.10 BGR BGR POL LTU
Rubber and Plastics 63.32 –11.43 –0.52 –1.57 BGR BGR LTU LTU
Other Non–Metallic
Mineral 79.89 2.58 –0.26 1.30 BGR BGR POL SVK
Basic Metals and
Fabri-cated Metal 86.08 8.03 0.01 1.97 BGR BGR POL LTU
Machinery, Nec 78.43 –0.10 –0.83 2.06 BGR BGR POL LTU
Electrical and Optical
Equipment 84.71 2.12 0.15 0.16 BGR BGR POL LTU
Transport Equipment 79.66 –5.76 –2.06 3.72 BGR BGR LTU LTU
Manufacturing, Nec;
Recycling 80.35 –6.60 –1.01 0.89 BGR LTU POL SVK
Electricity, Gas and
Water Supply 107.20 39.13 1.12 6.98 BGR BGR POL HUN
Sector Name
Capital efficiency in CEE countries (in %)
CEE country with highest capital efficiency
2009
1995– 2009 Change
Average annual change 2000–
2004
Average annual change 2004–
2009
1995 2000 2005 2009
Sale, Maintenance and Repair of Motor Vehicles and Motorcycles; Retail Sale of Fuel
91.96 2.96 –0.44 1.84 POL LTU POL LTU
Wholesale Trade and Commission Trade, Ex-cept of Motor Vehicles and Motorcycles
85.14 9.43 1.16 –0.53 BGR LTU POL SVK
Retail Trade, Except of Motor Vehicles and Motorcycles; Repair of Household Goods
103.51 –12.29 –1.75 1.29 POL LTU POL LTU
Hotels and Restaurants 75.17 –6.77 –0.53 –0.37 LVA LTU POL LTU
Inland Transport 94.54 –8.99 –0.51 –0.97 BGR BGR POL LTU
Water Transport 119.38 –12.34 –2.64 3.51 SVN BGR POL LTU
Air Transport 89.52 –17.89 –2.33 1.36 BGR BGR ROU LTU
Other Supporting and Auxiliary Transport Activities; Activities of Travel Agencies
80.43 –28.06 –3.82 2.54 BGR BGR POL LTU
Post and
Telecommuni-cations 94.99 38.63 4.01 –0.36 BGR BGR POL LTU
Financial Intermediation 85.68 24.25 2.46 –0.08 LVA EST LTU SVK
Real Estate Activities 128.38 –21.78 –1.56 –1.55 LVA LVA ROU EST
Renting of M&Eq and
Other Business Activities 118.94 30.58 2.92 0.34 LVA HUN POL SVK Public Admin and
Defence; Compulsory Social Security
95.45 –14.72 –1.95 1.20 POL BGR CZE HUN
Education 71.79 –10.23 –0.77 –0.63 LVA LTU LTU LTU
Health and Social Work 77.46 1.77 –0.05 0.57 LVA LTU HUN LTU
Other Community, Social
and Personal Services 88.86 –1.09 0.45 –1.40 LVA BGR LTU LTU Private Households
with Employed Persons 79.93 –1.39 0.74 –2.19 BGR BGR POL LTU
Source: own elaborations based on WIOD world IO tables.
[image:29.468.55.414.94.601.2]a Dark (grey) shading indicates 5 largest (smallest) values.
Figure 1. Share in value added and indexes of productivity and capital efficiency attributed in the sector of Agriculture, Hunting, Forestry and Fishing in the new EU
members with respect to the EU27 total
Figure notes:
Panel A: Share in value added (in%) in the new EU members with respect to the EU27 total. Legend:
Panel B: Change of share in value added (in %) in the new EU members with respect to the EU27 total (horizontal axis: change in 2000–2004 period, 2004–2009: change in 2004–2009 period).
Figure 2. Share in value added and indexes of productivity and capital efficiency attributed in the sector of Mining and Quarrying in the new EU members with respect
to the EU27 total
Figure notes:
Panel A: Share in value added (in%) in the new EU members with respect to the EU27 total. Legend:
Panel B: Change of share in value added (in %) in the new EU members with respect to the EU27 total (horizontal axis: change in 2000–2004 period, 2004–2009: change in 2004–2009 period).
Figure 3. Share in value added and indexes of productivity and capital efficiency attributed in the sector of Wood and Products of Wood and Cork in the new EU
members with respect to the EU27 total
Figure notes:
Panel A: Share in value added (in%) in the new EU members with respect to the EU27 total.
Legend:
Panel B: Change of share in value added (in %) in the new EU members with respect to the EU27 total (horizontal axis: change in 2000–2004 period, 2004–2009: change in 2004–2009 period).
Figure 4. Share in value added and indexes of productivity and capital efficiency attributed in the sector of Other Non-Metallic Mineral in the new EU members with
respect to the EU27 total
Figure notes:
Panel A: Share in value added (in%) in the new EU members with respect to the EU27 total.
Legend:
Panel B: Change of share in value added (in %) in the new EU members with respect to the EU27 total (horizontal axis: change in 2000–2004 period, 2004–2009: change in 2004–2009 period).
Figure 5. Share in value added and indexes of productivity and capital efficiency attributed in the sector of Other Supporting and Auxiliary Transport Activities,
Activities of Travel Agencies in the new EU members with respect to the EU27 total
Figure notes:
Panel A: Share in value added (in%) in the new EU members with respect to the EU27 total.
Legend:
Panel B: Change of share in value added (in %) in the new EU members with respect to the EU27 total (horizontal axis: change in 2000–2004 period, 2004–2009: change in 2004–2009 period).