ECNU: Using Traditional Similarity Measurements and Word Embedding
for Semantic Textual Similarity Estimation
Jiang Zhao, Man Lan∗, Jun Feng Tian
Shanghai Key Laboratory of Multidimensional Information Processing Department of Computer Science and Technology,
East China Normal University, Shanghai 200241, P. R. China
51121201042,10112130275@ecnu.cn; mlan@cs.ecnu.edu.cn∗
Abstract
This paper reports our submissions to seman-tic textual similarity task, i.e., task 2 in Se-mantic Evaluation 2015. We built our sys-tems using various traditional features, such as string-based, corpus-based and syntactic simi-larity metrics, as well as novel simisimi-larity mea-sures based on distributed word representa-tions, which were trained using deep learning paradigms. Since the training and test datasets consist of instances collected from various do-mains, three different strategies of the usage of training datasets were explored: (1) use all available training datasets and build a unified supervised model for all test datasets; (2) se-lect the most similar training dataset and sep-arately construct a individual model for each test set; (3) adopt multi-task learning frame-work to make full use of available training set-s. Results on the test datasets show that using all datasets as training set achieves the best av-eraged performance and our best system ranks 15 out of 73.
1 Introduction
Estimating the degree of semantic similarity be-tween two sentences is the building block of many natural language processing (NLP) applications, such as textual entailment (Zhao et al., 2014a), tex-t summarizatex-tion (Lloretex-t etex-t al., 2008), questex-tion an-swering (Celikyilmaz et al., 2010), etc. Therefore, semantic textual similarity (STS) has been received an increasing amount of attention in recent years, e.g., the Semantic Textual Similarity competition-s in Semantic Evaluation Exercicompetition-secompetition-s have been held
from 2012 to 2014. This year the participants in the STS task inSemEval2015 (Agirre et al., 2015) are required to rate the similar degree of a pair of sen-tences by a value from 0 (no relation) to 5 (semantic equivalence) with an optional confidence score.
To identify semantic textual similarity of tex-t pairs, mostex-t existex-ting works adoptex-t atex-t leastex-t one of the following feature types: (1) string based simi-larity (B¨ar et al., 2012; Jimenez et al., 2012) which employs common functions to calculate similari-ties over string sequences extracted from original strings, e.g., lemma, stem, orn-gram sequences; (2) corpus based similarity (ˇSari´c et al., 2012; Han et al., 2013) where distributional models such as Laten-t SemanLaten-tic Analysis(LSA) (Landauer and Dumais, 1997), are used to derive the distributional vectors of words from a large corpus according to their occur-rence patterns, afterwards, similarities of sentence pairs are calculated using these vectors; (3) knowl-edge based method (Shareghi and Bergler, 2013; Mihalcea et al., 2006) which estimates the similari-ties with the aid of external resources, such as Word-Net1. Among them, lots of researchers (Sultan et al., 2014; Han et al., 2013) leverage different word alignment strategies to bring word-level similarity to sentence-level similarity.
In this work, we first borrow aforementioned ef-fective types of similarity measurements including string-based, corpus-based, syntactic features and so on, to capture the semantic similarity between two sentences. Beside, we also present a novel feature type based onword embeddingsthat are induced us-ing neural language models over a large raw
pus (Mikolov et al., 2013b). Then these features are served as input of a regression model. Notice that, the organizers provide us seventeen training dataset-s and five tedataset-st datadataset-setdataset-s, which are drawn from dif-ferent but related domains. Accordingly, we build three different systems in terms of the usage of train-ing datasets: (1) exploit all the traintrain-ing datasets and train a single model for all test datasets; (2) choose one domain-dependent training dataset for each test dataset usingcosinedistance selection criterion and train models individually for each test dataset; (3) to overcome overuse or underuse of training datasets, we adopt multi-task learning (MTL) framework to make full use of available training datasets, that is, for each test set the main task is built upon designat-ed training datasets and the rest training datasets are used in the auxiliary tasks.
The rest of this paper is organized as follows. Section 2 describes various similarity measurements used in our systems. System setups and experimen-tal results on training and test datasets are presented in Section 3. Finally, conclusions and future work are given in Section 4.
2 Semantic Similarity Measurements Following our previous work (Zhao et al., 2014b), we adopted the traditional widely-used features (i.e., string, corpus, syntactic features) for semantic simi-larity measurements. In this work, we also proposed several novel features using word embeddings.
2.1 Preprocessing
Several text preprocessing operations were per-formed before we extracted features. We first con-verted the contractions to their formal writings, for example,doesn’tis rewritten asdoes not. Then the WordNet-based Lemmatizer implemented in Natu-ral Language Toolkit2 was used to lemmatize al-l words to their nearest base forms in WordNet, for example,wasis lemmatized tobe. After that, We re-placed a word from one sentence with another word from the other sentence if these two words share the same meaning, where WordNet was used to look up synonyms. No word sense disambiguation was per-formed and all synsets in WordNet for a particular lemma were considered.
2http://nltk.org/
2.2 String Based Features
We firstly recorded length information of given sentences pairs using the following eight mea-sure functions: |A|,|B|,|A−B|,|B−A|,|A∪B|,|A∩ B|,(|A|−|B||B| ),(|B|−|A||A| ) , where|A|stands for the num-ber of non-repeated words in sentence A , |A−B| means the number of unmatched words found inA
but not inB,|A∪B|stands for the set size of non-repeated words found in either Aor B and|A∩B| means the set size of shared words found in bothA
andB.
Motivated by the hypothesis that two texts are considered to be semantic similar if they share more common strings, we adopted the following five type-s of meatype-surementtype-s: (1) longetype-st common type-sequence similarity on the original and lemmatized sentences; (2)Jaccard,Dice,Overlapcoefficient on orig-inal word sequences; (3)Jaccardsimilarity using
n-grams, wheren-grams were obtained at three dif-ferent levels, i.e., the original word level (n=1,2,3), the lemmatized word level (n=1,2,3) and the char-acter level (n=2,3,4); (4) weighted word overlap feature (ˇSari´c et al., 2012) that takes the impor-tance of words into consideration, where Web 1T 5-gram Corpus3 was used to estimate the impor-tance of words; (5) sentences were represented as vectors intf*idf schema based on their lemmatized forms and then these vectors were used to calcu-latecosine,Manhattan,Euclideandistance andPearson,Spearmanr,Kendalltau corre-lation coefficients.
Totally, we got thirty-one string based features.
2.3 Corpus Based Features
The distributional meanings of words own good se-mantic properties andLatent Semantic Analysis (L-SA) (Landauer and Dumais, 1997) is widely used to estimate the distributional vectors of words. Hence, we adopted two distributional word sets released by TakeLab (ˇSari´c et al., 2012), where LSA was per-formed on the New York Times Annotated Corpus (NYT)4 and Wikipedia. Then two strategies were used to convert the distributional meanings of words to sentence level: (i) simply summing up the distri-butional vector of each wordwin the sentence, (ii)
using the information content (ˇSari´c et al., 2012) to weigh the LSA vector of each wordwand then sum-ming them up. After that we usedcosinesimilarity to measure the similarity of two sentences based on these vectors. Besides, we used the Co-occurrence Retrieval Model (CRM) (Weeds, 2003) as another type of corpus based feature. The CRM was cal-culated based on a notion of substitutability, that is, the more appropriate it was to substitute wordw1in
place of wordw2in a suitable natural language task,
the more semantically similar they were.
At last, we obtained six corpus based features.
2.4 Syntactic Features
Besides semantic similarity, we also estimated the similarities of sentence pairs at syntactic level. S-tanford CoreNLP toolkit (Manning et al., 2014) was used to obtain the POS tag sequences for each sen-tence. Afterwards, we performed eight measure functions described above in Section 2.2 over these sequences, resulting in eight syntactic features.
2.5 Word Embedding Features
Recently, deep learning has archived a great success in the fields of computer vision, automatic speech recognition and natural language processing. One result of its application in NLP, i.e., word embed-dings, has been successfully explored in named en-tity recognition, chunking (Turian et al., 2010) and semantic word similarities(Mikolov et al., 2013a), etc. The distributed representations of words (i.e., word embeddings) learned using neural network-s over a large raw corpunetwork-s have been network-shown that they performed significantly better than LSA for p-reserving linear regularities among words (Mikolov et al., 2013a). Due to its superior performance, we adopted word embeddings to estimate the sim-ilarities of sentence pairs. In our experiments, we used two different word embeddings: word2vec
(Mikolov et al., 2013b) and Collobert and West-on embeddings (Turian et al., 2010). The word embeddings from Word2vec are distributed within the word2vec toolkit5and they are 300-dimensional vectors learned from Google News Corpus which consists of over a 100 billion words. The Col-lobert and Weston embeddings are learned over a
5https://code.google.com/p/word2vec
part of RCV1 corpus which consists of 63 mil-lions words, resulting in 100-dimensional contin-uous vectors. To obtain the sentence representa-tions from word representarepresenta-tions, we used idf to weigh the embedding vectors of words and sim-ply summed them up. Although the word embed-ding is obtained from large corpus in considera-tion of its context, using this bag of words (BOW) representation of sentences, the current word se-quence in sentence is neglected. After that, we used cosine, Manhattan, Euclidean func-tions andPearson, Spearmanr, Kendalltau
correlation coefficients to calculate the similarities based on these synthetic sentence representations.
2.6 Other Features
Besides the shallow semantic similarities between words and strings, we also calculated the similari-ties of named entisimilari-ties in two sentences using longest common sequence function. Seven types of named entities, i.e., location, organization, date, money,
person, time and percent, recognized by Stanford CoreNLP toolkit (Manning et al., 2014) were con-sidered. We designed a binary feature to indicate whether two sentences in a given pair have the same polarity (i.e.,affirmativeornegative) by looking up a manually-collected negation list with 29 negation words (e.g.,scarcely,no,little). Finally, we obtained in eight features.
3 Experiments and Results
3.1 Datasets
Dataset # of pairs average length answers-forums 2000 (17.56,17.37) answers-students 1500 (10.49,11.17) belief 2000 (15.16,14.56) headlines 1500 ( 7.86,7.91 )
images 1500 (10.59,10.58)
Table 1: The statistics of test datasets for STS task in
SemEval2015.
3.2 Experimental Setups
We built three different systems according to the us-age of training datasets as follows.
allData: We used all the training datasets and built a single global regression model regardless of domain information of different test datasets. DesignatedData: For each test dataset, we cal-culated the cosine distance with every candidate training dataset. Then the training dataset with the lowest distance score was chose as the train-ing dataset to fit a regression model for specific test dataset.
Dist(Xtst, Xc) = 1−
∑
xi∈Xtst
∑
xj∈Xc
cosine(xi, xj)
|Xtst||Xc|
MTL: On one hand, taking all the training dataset-s into condataset-sideration may hurt the performance dataset-since training and test datasets are from different domains. On the other hand, using the most related dataset-s leaddataset-s to indataset-sufficient udataset-sage of available datadataset-setdataset-s. Therefore, we considered to adopt multi-task learn-ing framework to take full advantage of available training sets. Under multi-task learning framework, a main task learns together with other related aux-iliary tasks at the same time, using a shared repre-sentation. This often leads to a better model for the main task, because it allows the learner to use the commonality among the tasks. Hence, for each test dataset we selected the datasets whose cosine dis-tances are less than 0.1 (at least one training set) as training set to construct the main task, and then used the remaining training sets to construct auxil-iary tasks. In this work, we adopted the robust multi-task feature learning (rMTFL) (Gong et al., 2012), which assumes that the model W can be decom-posed into two components: a shared feature struc-ture P that captures task relatedness and a group-sparse structureQthat detects outlier tasks.
Specifi-cally, it solves following formulation:
min
W t
∑
i=1
∥WF
i Xi−Yi∥2F +ρ1∥P∥2,1+ρ2∥QT∥2,1
subject to:W =P +Q
whereXi denotes the input matrix of thei-th task,
Yi denotes its corresponding label,Wi is the model for task i, the regularization parameter ρ1 controls
the joint feature learning, and the regularization pa-rameterρ2 controls the columnwise group sparsity
onQthat detects outliers.
In our preliminary experiments, several regres-sion algorithms were examined, including Support Vector Regression (SVR, linear), Random Forest (RF) and Gradient Boosting (GB) implemented in the scikit-learn toolkit (Pedregosa et al., 2011). The system performance is evaluated using Pearson cor-relation (r).
3.3 Results on Training Data
To configure the parameters in the three systems, i.e., the trade-off parameterc in SVR, the number of treesn in RF, the number of boosting stages n
in GB inallDataandDesignatedData, ρ1,2
in MTL, we conducted a series of experiments on STS 2014 datasets (eleven datasets for training, six datasets for development). Table 2 shows the Pear-son performance of our systems on developmen-t dadevelopmen-tasedevelopmen-ts. We explored a large scale of paramedevelopmen-ter values and only the best result for each algorith-m was listed due to the lialgorith-mitation of page length. The numbers in the brackets in algorithms colum-n icolum-ndicate the parameter values acolum-nd those icolum-n bold font represent the best performance for each dataset and system. From the table we find that (1) GB and SVR obtain the best averaged results in sys-temallDataandDesignatedData respective-ly; (2) althoughDesignatedDatauses only one most-closely dataset for training for each test set, it achieves comparable or even better performance on some datasets when compared withallData; (3) our multi-task learning framework can indeed boost the performance.
3.4 Results on Test Data
Algorithms deft-forum deft-news headlines images OnWN tweet-news Mean SVR (0.01) 0.458 0.761 0.728 0.813 0.836 0.727 0.721 RF (65) 0.491 0.751 0.718 0.789 0.873 0.741 0.727 GB (50) 0.499 0.760 0.725 0.805 0.863 0.739 0.732
SVR (0.1) 0.549 0.725 0.765 0.790 0.810 0.740 0.730
RF (75) 0.513 0.709 0.741 0.768 0.814 0.767 0.719 GB (50) 0.504 0.694 0.738 0.790 0.809 0.751 0.714
[image:5.612.80.535.63.171.2]MTL(0.1, 0.1) 0.556 0.772 0.738 0.808 0.819 0.745 0.740
Table 2: Pearson ofallData,DesignatedDatausing different algorithms andMTLon STS 2014 datasets.
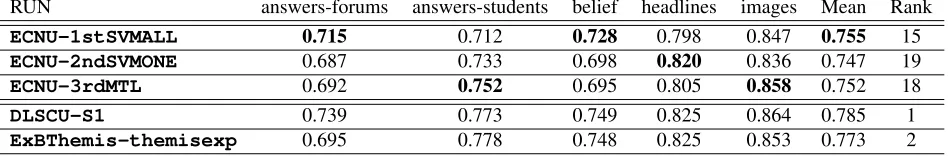
RUN answers-forums answers-students belief headlines images Mean Rank
ECNU-1stSVMALL 0.715 0.712 0.728 0.798 0.847 0.755 15
ECNU-2ndSVMONE 0.687 0.733 0.698 0.820 0.836 0.747 19
ECNU-3rdMTL 0.692 0.752 0.695 0.805 0.858 0.752 18
DLSCU-S1 0.739 0.773 0.749 0.825 0.864 0.785 1
ExBThemis-themisexp 0.695 0.778 0.748 0.825 0.853 0.773 2
Table 3: Results of our three runs on STS 2015 test datasets, as well as top rank runs.
ECNU-1stSVMALL which builds a global model on all datasets using SVR with parameter c=0.1; ECNU-2ndSVMONEwhich fits individual model for each test set on a designated training set using GB with parameter n=50; ECNU-3rdMTL which em-ploys robust multi-task feature learning with param-eterρ1 =ρ2 = 0.1.
Table 3 summarizes the results of our sub-mitted runs on test datasets officially released by the organizers, as well as the top rank run-s. In terms of mean Pearson measuremen-t, system ECNU-1stSVMALL performs the best, which is comparable to ECNU-3rdMTL. Howev-er, the ECNU-2ndSVMONE performs the worst. This is inconsistent with the results on train-ing datasets wherein ECNU-3rdMTL yields the best performance. On test dataset, we find that ECNU-3rdMTL has much worse performances than ECNU-1stSVMALL on answers-forums and belief while it achieves much better results on answers-students, headlines and images dataset-s. The possible reason may be that the train-ing dataset selected from the candidate dataset-s in main tadataset-sk are ill-dataset-suited for andataset-swerdataset-s-forumdataset-s and belief test datasets, which is also verified by the results of system ECNU-2ndSVMONE. It is noteworthy that on answers-students and headlines ECNU-2ndSVMONE achieves much better results thanECNU-1stSVMALL although the former
sys-tem only uses much less training instances (750,750 vs. 10592). In addition, the difference between top system DLSCU-S1 and our systems is about 3%, which means our systems are promising.
4 Conclusion
We used traditional NLP features including string-based, corpus-based and syntacitc features, for tex-tual semantic similarity estimation, as well as nov-el word embedding features. We also presented three different systems to compare the strategies of different usage of training data, i.e., single super-vised learning with all training datasets and individ-ual training dataset for each test dataset, and multi-task learning framework. Our best system achieves 15th place out of 73 systems on test datasets. Notice-ably each system achieves the best performance on different test datasets, which indicates the usage of training datasets is important, we will explore more sophisticated way to utilize these training datasets in future work.
Acknowledgements
[image:5.612.73.547.204.282.2]Things (ZF1213).
References
Eneko Agirre, Carmen Banea, and et al. 2014. SemEval-2014 task 10: Multilingual semantic textual similarity. In Proceedings of the 8th International Workshop on Semantic Evaluation (SemEval 2014), pages 81–91. Eneko Agirre, Carmen Banea, and et al. 2015.
SemEval-2015 task 2: Semantic textual similarity, English, S-panish and pilot on interpretability. InProceedings of the 9th International Workshop on Semantic Evalua-tion (SemEval 2015), June.
Daniel B¨ar, Chris Biemann, Iryna Gurevych, and Torsten Zesch. 2012. Ukp: Computing semantic textual sim-ilarity by combining multiple content simsim-ilarity mea-sures. In Proceedings of the First Joint Conference on Lexical and Computational Semantics, pages 435– 440.
Asli Celikyilmaz, Dilek Hakkani-Tur, and Gokhan Tur. 2010. LDA based similarity modeling for question answering. InProceedings of the NAACL HLT 2010 Workshop on Semantic Search, pages 1–9.
Pinghua Gong, Jieping Ye, and Changshui Zhang. 2012. Robust multi-task feature learning. InProceedings of the 18th ACM SIGKDD international conference on Knowledge discovery and data mining, pages 895– 903.
Lushan Han, Abhay L. Kashyap, Tim Finin, James Mayfield, and Jonathan Weese. 2013. UM-BC EBIQUITY-CORE: Semantic textual similarity systems. InSecond *SEM, pages 44–52.
Sergio Jimenez, Claudia Becerra, and Alexander Gel-bukh. 2012. Soft cardinality: A parameterized sim-ilarity function for text comparison. In *SEM 2012 and (SemEval 2012), pages 449–453.
Thomas K Landauer and Susan T Dumais. 1997. A so-lution to Plato’s problem: The latent semantic analysis theory of acquisition, induction, and representation of knowledge. Psychological review.
Elena Lloret, Oscar Ferr´andez, Rafael Munoz, and Manuel Palomar. 2008. A text summarization ap-proach under the influence of textual entailment. In
Proceedings of NLPCS 2008, pages 22–31.
Christopher D. Manning, Mihai Surdeanu, John Bauer, Jenny Finkel, Steven J. Bethard, and David McClosky. 2014. The Stanford CoreNLP natural language pro-cessing toolkit. InProceedings of 52nd ACL: System Demonstrations, pages 55–60.
Rada Mihalcea, Courtney Corley, and Carlo Strapparava. 2006. Corpus-based and knowledge-based measures of text semantic similarity. InAAAI, volume 6, pages 775–780.
Tomas Mikolov, Kai Chen, Greg Corrado, and Jeffrey Dean. 2013a. Efficient estimation of word representa-tions in vector space.arXiv preprint arXiv:1301.3781. Tomas Mikolov, Ilya Sutskever, Kai Chen, Greg S Corra-do, and Jeff Dean. 2013b. Distributed representations of words and phrases and their compositionality. In
Advances in Neural Information Processing Systems, pages 3111–3119.
Fabian Pedregosa, Ga¨el Varoquaux, Alexandre Gramfort, et al. 2011. Scikit-learn: Machine learning in Python.
The Journal of Machine Learning Research, 12:2825– 2830.
Ehsan Shareghi and Sabine Bergler. 2013. CLaC-CORE: Exhaustive feature combination for measuring textual similarity. InSecond Joint Conference on Lexical and Computational Semantics (*SEM).
Md Arafat Sultan, Steven Bethard, and Tamara Sumner. 2014. DLS@CU: sentence similarity from word align-ment. InSemEval 2014, pages 241–246.
Joseph Turian, Lev Ratinov, and Yoshua Bengio. 2010. Word representations: a simple and general method for semi-supervised learning. InProceedings of the 48th Annual Meeting of the Association for Computational Linguistics, pages 384–394.
Frane ˇSari´c, Goran Glavaˇs, Mladen Karan, Jan ˇSnajder, and Bojana Dalbelo Baˇsi´c. 2012. TakeLab: Systems for measuring semantic text similarity. In*SEM 2012 and (SemEval 2012), pages 441–448.
Julie Elizabeth Weeds. 2003.Measures and applications of lexical distributional similarity. Ph.D. thesis, Uni-versity of Sussex.
Jiang Zhao, Man Lan, Zheng-Yu Niu, and Dong-Hong Ji. 2014a. Recognizing cross-lingual textual entail-ment with co-training using similarity and difference views. InIJCNN 2014, Beijing, China, 2014, pages 3705–3712.