Original Article
Dysregulated pathways identification
analysis in Parkinson disease based on attractor of
within-pathway effects and crosstalk inter-pathways
Yang Xu1*, Xinyan Yi2*, Hongmei Yue1
1Department of Neurology, Jining No. 1 People’s Hospital, 272011, Jining, Shandong, P. R. China; 2Health
Management Center, Affiliated Hospital of Jining Medical University, 272100, Jining, Shandong, P. R. China.
*Equal contributors and co-first authors.
Received October 10, 2016; Accepted December 8, 2016; Epub February 15, 2017; Published February 28, 2017
Abstract: The etiology of Parkinson disease (PD) is not well established. In order to identify dysregulated pathways in the pathogenesis of PD, gene expression profiling of 38 Parkinson’s disease patients and 23 healthy controls were collected. The pathway crosstalk networks were constructed to assess interactions inter-pathways. A total of 18 differentially expressed genes were identified in Parkinson’s disease. There were 39 attractors with P<0.01 and 27 pathways with RP<0.01. Finally, 19 significantly dysfunctional pathways with strong interactions directly related to Parkinson disease progression were found. Among them, Epstein-Barr virus infection was the most significantly different pathway. In conclusion, a novel pipeline that identified the dysregulated pathways in Parkinson’s disease was constructed based on attractor of within-pathway effects and crosstalk inter-pathways.
Keywords: Parkinson disease, crosstalk, epstein-barr, dysregulated pathways
Introduction
Parkinson disease (PD) is a degenerative disor-der of the central nervous system mainly affect-ing the motor system [1-3]. Early in the course of the disease, the most obvious symptoms are movement-related. Later, thinking and behav-ioral problems may arise, with dementia com-monly occurring in the advanced stages of the disease, and depression being the most com-mon psychiatric symptom [4]. The disease can be either primary or secondary. Primary Parkin-
son’s disease has no known cause, although
some atypical cases have a genetic origin. Secondary parkinsonism is due to known causes like toxins. Many risks and protective factors have been investigated: the clearest evidence is for an increased risk in people exposed to certain pesticides and a reduced risk in tobacco smokers. The motor symptoms of the disease result from the death of cells in the substantia nigra, a region of the midbrain.
Parkinson’s disease in most people is idiopath
-ic (having no specif-ic known cause). However, a
small proportion of cases can be attributed to known genetic factors. Other factors have been
associated with the risk of developing PD, but no causal relationships have been proven [5].
It is a significant task that identifying dysregu -lated pathways from high-throughput experi-mental data in order to infer potential molecu-lar and functional insights [6]. The differentially expressed genes (DEG) and pathways can help to understand high-level functions between normal and disease groups. Recently, canoni-cal reports claimed that gene expression
pat-terns could identify biomarkers of Parkinson’s
disease, which highlighted the relevance of the innate immune system through signaling path-ways [3, 7-17].
There are abundant pathways related to
Parkinson’s disease in Kyoto Encyclopedia of
Genes and Genomes (KEGG) pathway data
leverage both existing pathway databases and the DEG between cell phenotypes. We employed it to screen attractors within pathways from vast data of KEGG pathway database, in order
to narrow down the number of correlated
dys-regulated pathways.
Screened differentially expressed pathways are
efficient to identify target functions. However,
they invariably focus on internal effects of sin-gle pathway and are fail to consider the inher-ent interdependency inter-pathways. Pathway crosstalk refers to the phenomenon of interac-tion or cooperainterac-tion between pathways. The construction of a pathway crosstalk network (PCN) inter-pathways is conductive to under-stand the comprehensive interactions in Par-
kinson’s disease [24-28]. Then a scoring
sche-me was utilized to comprehensively identify these pathways, taking into account both attr- actors of internal pathway effects and cross-talk inter-pathways.
In this study, we introduced a novel pipeline to identify dysregulated pathways associated with
Parkinson’s disease. Ultimately several signifi -cantly dysfunctional pathways with strong
inter-actions which directly related to Parkinson’s
disease progression were found. Attractor and crosstalk were designed to complement each other in order to increase the integrity of path-ways assessment. The new method was hoped
to be meaningful in seeking influential path -ways by reinforce of attractor and crosstalk, which served as therapy targeting markers. Materials and methods
Gene expression datasets
The transcription profile was obtained from
EMBIE-BI ArrayExpress [29]. Gene expression
profiling of 38 Parkinson’s disease patients and
23 healthy controls were collected from E-GEOD- 16561 [30]. The platform was A-MEXP-1172-Illumina HumanRef-8 v 3.0 Expression Bead Chip. Data of the gene chip was read in the affy [31]. The Linear Models for Microarray Data (LIMMA) was then used to preprocess data. Background adjustment and quantile data nor-malization were performed by robust multi-array average (RMA) [32]. To protect against outlier probes we used a robust procedure, median polish [33], to estimate model param-eters. The average value of a gene symbol with multiple probes was calculated. To scree
differ-|log fold change (FC) I≥2 were set as the thresh -old levels.
Pathway data
Information from gene sets representing bio-logical pathways of human was obtained from
Kyoto encyclopedia of Genes and Genomes (KEGG) database [34] which provides copious
pathway information [35, 36]. A set of pathways of which gene set size is >100 or <5 were
filtered. After these size cutoffs were set up,
294 pathways were obtained for downstream analysis.
Protein interaction data
The human protein-protein interaction (PPI) sets representing biological genes were ob- tained from the Retrieval of Interacting Genes (STRING; v 9.0) [37]. After removing self inter-actions, we ended up with 787896 PPI sets. Attractor analysis within pathways
Based on attractor theory [38], attract was used to screen differentially expressed
path-ways related to Parkinson’s disease from 294 KEGG pathways. To test data of 294 KEGG
pathways, GSEA-ANOVA was employed as a gene set enrichment algorithm, which was dif-ferent from other methods in multiple classes [23]. Obtained differences among the
expres-sion profile of samples were identified as attrac -tors. From the ANOVA model, we compute the F-statistic for gene i:
Fi MSSRSS i i
=
^ h (1) where MSSi represents the mean treatment sum of squares, and captures the amount of
variation due to group-specific effects:
1
1 r
MSS
K y y
2
i k k
k
ki i
1
=
- =
-^h ^h
6
@
/
(2) and RSSi represents the residual sum of squares:1 RSS
N K y y
2
1
K 1 jk
i i j r K i j = - = =
-^h ^h
6
@
/
/
(3) where N is the total number of samples, and the overall mean is given by:Yi 1K 1r y 1 K 1 k jk
i j r K k = = =
^h
/
c
/
^hm
differ-disease. Large values of the F-statistic mean a
strong association with Parkinson’s disease-specific expression changes.
For pathway P consisting of gp genes, the T-statistic takes the following form:
g1 1
T
g s
G S
F G F
2 2 1 1 P p p G p i i g j G j p = + -= =
^h ^h
;
E
;
E
c
m
c
m
/
/
(5)
where G represents the total number of genes with a pathway annotation and the sample vari-ances
s
p2 ands
G2 are defined as:g 1
1 1
S2 F g F
1 1 2 p p j p i i g j
gp p
-
-=
= =
^h ^h
c
/
m
/
(6)S
1
1 1
G F G F
2
1 j 1
2
G j i
i G G -
-=
= =^h ^h
c
/
m
/
(7)and the degrees of freedom are specified by
the Welch-Satterwhaite equation:
1 1 s V g g s G G s g sG
2 4
2 4
2 2 2
p p p G p p G
-=
-
+
+
^
h
^
h
c
m
(8)
Attractors were ranked according to the signifi -cance of difference.
Crosstalk analysis of inter-pathways
The pathway crosstalk network (PCN) of control group was constructed in Li et al. [24] method. The value of weight of the background PCN was
defined as the number of PPI sets.
(1) Fish Exact test was performed to evaluate gene overlap between any pair of 294 path-ways [39]. Raw P-values were adjusted by false discovery rate (FDR) [40]. Pathway pairs with adjusted P<0.05 were removed.
(2) The number of PPI sets was counted between any pair of pathways. For each path-way pair, count all interactions after removing genes shared in both pathways.
(3) Background distribution of PPI sets counted in each pair of pathways was estimated. Every pathway was randomized repeating 1000 times. When a gene in the pathway has interac-tions, it is considered that there is crosstalk between pathways. First count the number of genes it interacts with, and randomly draw a
gene from the PPI data base which interacts with similar number of genes. Then the original gene was replaced with this newly selected gene. Once both pathways were randomized, Step 2 was performed to count the number of interactions between them.
(4) The one-sided Fisher Exact test on all path-way pairs was performed using the 2 × 2 con-tingency table. P-values of Fisher exact test were adjusted using FDR BH procedure [40] and empirical P-value was calculated by count-ing the number of permutations in which the count of random interactions is higher than or equal to that of true interactions.
(5) All pathway pairs with adjusted Fisher P<0.05 were used to construct the PCN, where a node represents a pathway and an edge is crosstalk between two pathways. To clean up
the network, two types of ‘redundant’ edges were removed: (a) Edges with significant gene overlap identified in Step 1 were removed from
[image:3.612.323.521.95.375.2]the network. (b) The two edges between two overlapping pathways were considered re- dundant.
Table 1. 18 DEG identified in the Parkinson’s
disease
DEG Log FC P-value
Up-regulated
RGS2 1.0107 3.24E-14
PDK4 2.0079 7.54E-11
ARG1 2.6940 1.70E-09
IQGAP1 2.0330 9.65E-09
CRISPLD2 2.0690 5.39E-08
PADI4 2.0232 6.95E-08
MMP9 2.4304 1.36E-07
CSPG2 2.0757 4.93E-07
CA4 2.0994 3.35E-06
S100A12 2.2762 5.03E-06
ACSL1 2.0946 8.29E-06
FOLR3 2.0949 1.87E-05
AKAP7 2.1421 2.27E-05
LY96 2.1194 2.86E-05
ORM1 1.1837 0.00014
FCGR3B 1.1743 0.00066
APOBEC3A 2.1644 0.00092 Down-regulated
Network of Parkinson’s disease
Base on the original method of crosstalk [24],
the network of Parkinson’s disease can be con
-structed. In Step 3, we modified it to narrow
down the number of edges in the network. A gene in the pathway has interactions when it met one of the two conditions: (1) Spearman
correlation coefficients of every PPI set were
calculated in control and normal group. When the absolute value of different value between them >0.7, the edge was remained. Geometric
mean of the absolute value was defined as the
value of weight between the two pathways. (2). The two genes in an interaction were differen-tially expressed genes (DEG). P<0.01 and |log fold change (FC)|>1 were set as the threshold
levels for the identification of DEG.
Important crosstalk pathways
The PCN was performed in topology analysis. Pathways were ordered by the degree of nodes. The scores of pathways were calculated.
Score = degree of Parkinson’s disease/degree
of background (9) Comprehensive analysis
Impact factor was used to assess the interac-tions between a pathway with other pathways. Impact factor = outer × (1-p) (10) Outer means the degree of interactions from crosstalk analysis and p represents the P-value of the attractor.
RP-value was used to evaluate the
comprehen-sive identified ability within pathways and
bet-ween pathways [41].
RP-value = (rank inter/total) × (rank outer/ total) (11)
Rank inter represents the ranking of attractor’s
P-value and rank outer means the ranking of interactions. Total means the sum of inter and outer.
Results
DEG in the Parkinson’s disease
According to the criteria outlined (|log FC|≥2; P≤0.01), a total of 18 DEG were identified in
Parkinson’s disease, of which 17 were up-regu
-lated and 1 was down-regu-lated (Table 1). These DEG might identify molecular alterations and provided diagnostic biomarkers to the
Parkinson’s disease.
Crosstalk of the Parkinson’s disease related pathways
The PCNs of background and Parkinson’s dis
-ease were generated with gene expression
pro-filing of 39 Parkinson’s disease patients and 24
controls, respectively. The detail of PCNs was showed in the supplement material. The
cross-talk difference of background and Parkinson’s
disease was shown in Figure 1. In control group, a majority of degrees in 294 pathways
[image:4.612.91.475.77.253.2]were between 255 and 300. The Parkinson’s disease group was significantly different with
(Figure 2), which indicated these 68 attractors
were significantly different in the Parkinson’s
disease. There were some molecular altera-tions existed in pathways themselves related to
the Parkinson’s disease, which sh-owed they
[image:5.612.94.523.75.265.2]were differentially expressed pathways. In terms of interactions inter-pathways, impact factor was used to assess their contact. There were different values varied 0 to 272 showed in Figure 3, which indicated that there were differ-ent degree of interactions inter-pathways. RP-value was used to comprehensively assess 294 pathways, including within pathways and inter-pathways. There were 64 pathways with RP<0.05 and 27 pathways with RP<0.01 (Fi- gure 2). Finally screened from 39 attractors, 19 the background. This result gives evidence for
the strong relationship between these
path-ways with the Parkinson’s disease.
Bigger value of scores indicated more impor-tant crosstalk pathways. The top 3 imporimpor-tant
pathways were Pyrimidine metabolism (KEGG ID: 00240), HTLV-I infection (KEGG ID: 05166) and Epstein-Barr virus infection (KEGG ID:
05169). They provided valuable information for
the mechanism of the Parkinson’s disease.
Identification of KEGG pathways
A total of 294 KEGG pathways were evaluated comprehensively by Kauffman’ attractor,
im-pact factor and RP-value. There were 68 attrac-tors with P<0.05 and 39 attracattrac-tors with P<0.01
[image:5.612.98.520.311.475.2]Figure 2. Differentially expressed pathways in Parkinson’s disease patients.
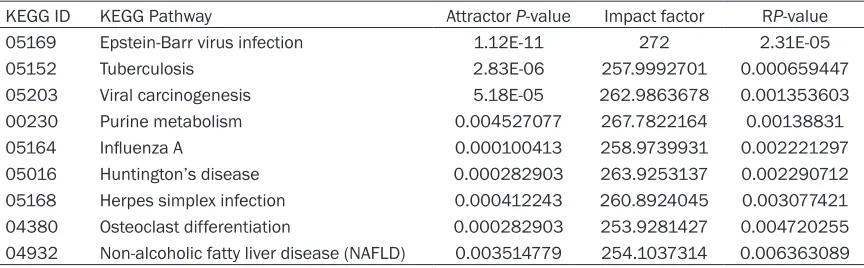
Table 2. Top 9 of significant pathways identified by Kauffman’ attractor, Impact factor and RP-value KEGG ID KEGG Pathway Attractor P-value Impact factor RP-value
05169 Epstein-Barr virus infection 1.12E-11 272 2.31E-05
05152 Tuberculosis 2.83E-06 257.9992701 0.000659447
05203 Viral carcinogenesis 5.18E-05 262.9863678 0.001353603
00230 Purine metabolism 0.004527077 267.7822164 0.00138831
05164 Influenza A 0.000100413 258.9739931 0.002221297
05016 Huntington’s disease 0.000282903 263.9253137 0.002290712
05168 Herpes simplex infection 0.000412243 260.8924045 0.003077421 04380 Osteoclast differentiation 0.000282903 253.9281427 0.004720255 04932 Non-alcoholic fatty liver disease (NAFLD) 0.003514779 254.1037314 0.006363089
pathways matched with attractor P<0.01, big value of impact factor and RP-value <0.01.
They were considered to be significantly dys -functional pathways with strong interactions
which directly related to Parkinson’s disease progression. Top 9 of significant pathways were
shown in Table 2. These pathways might play more important roles in the development of
Parkinson’s disease due to their dysfunctional
expression and strong interactions. Among
them, Epstein-Barr virus infection (KEGG ID: 05169) was the most significantly different
pathway. Discussion
Attractor theory was famous as a knowledge-driven analytical way to distinguish and anno-tate the gene-sets [38]. It was used to elevate expression across pathways in embryonic stem cells [23]. The results with pathways will be more complete instead of traditional DEG anal-ysis due to narrowing down the number of cor-related dysregulated pathways.
In this study, 68 attractors (P<0.05) with
statis-tically significant alteration were screened from 294 KEGG pathways in response to molecular
mechanism and pathology process of Parkin-
son’s disease. We found that most of them
were related to diseases, such as Tuberculosis
(KEGG ID: 05152), Alzheimer’s disease (KEGG ID: 05010), Measles (KEGG ID: 05162) and Huntington’s disease (KEGG ID: 05016). They
were differentially expressed pathways in
Parkinson’s disease patients, however, the integral influence to the system was absent.
From Figure 2, we can see that the variation trend of attractor were not absolutely consis-tent with that of RP-value. Therefore, crosstalk was employed to assess the interactions
inter-pathways. Pathways with big value of impact factor were considered to have strong contact with other pathways. Interestingly, most of 68 attractors were with big values of impact factor, but 13 pathways were not (impact factor <190). Meanwhile, the RP-values of most of the 14 pathways were >0.05. It claimed that pathways screened by attractor were not exactly
dysregu-lated and influential ones. Those pathways with
attractor P<0.05 and small values of impact factor were considered to have small effect and
should be filtered.
The results suggested attractor might fail to identify pathways effectively because of incom-plete information on inherent interdependency inter-pathways pathway. This is similar to the
challenge faced by other pathway-identification
methods that apply topological pathway infor-mation [36]. After assessing the interactions inter-pathways by crosstalk, the novel approach enhanced attractor to identify dysregulated pathways. Recently, ways to comprehensively identify dysregulated pathways have become a major focus [6]. The novel method combined attractor and crosstalk is hoped to be further applied to other diseases.
We applied RP-value to evaluate the
compre-hensive identified ability both within pathways and inter-pathways. What we want is influential
dysregulated pathways which with attractor P<0.05, big value of impact factor and RP-value <0.05. Screened from 68 attractors, 46 path-ways matched the condition. Screened from 39 attractors, 19 pathways matched with attractor P<0.01 and RP-value <0.01. We found that most of them were pathways related to
fatty liver disease (NAFLD) (KEGG ID: 04932). The pathway Epstein-Barr virus infection (KEGG
ID: 05169) owned minimum RP-value and maxi-mal impact factor among them. Meanwhile it was one of the most important crosstalk path-ways. It is well known that distinct forms of Epstein-Barr virus can cantribute to the differ-ent infectious diseases and tumors [42]. There- fore, the pathway Epstein-Barr virus infection was considered to be important in the
molecu-lar mechanism of Parkinson’s disease.
Conclusion
Based on our results, we conclude that a novel
pipeline that identified the dysregulated path
-ways in Parkinson’s disease. It is based on
attractor of within-pathway effects and cross-talk inter-pathways. We hope the constructed
process can be efficient in the upcoming era of
medicine.
Disclosure of conflict of interest
None.
Address correspondence to: Dr. Hongmei Yue, Department of Neurology, Jining No. 1 People’s Hospital, 272011, Jining, Shandong, P. R. China. Tel: +86-13963750808; E-mail: yhmthsd@163.com
References
[1] Mandel S, Grunblatt E, Riederer P, Amariglio N, Jacob-Hirsch J, Rechavi G and Youdim MB. Gene expression profiling of sporadic Parkin-son’s disease substantia nigra pars compacta reveals impairment of ubiquitin-proteasome subunits, SKP1A, aldehyde dehydrogenase, and chaperone HSC-70. Ann N Y Acad Sci 2005; 1053: 356-375.
[2] Lu L, Neff F, Alvarez Fischer D, Henze C, Xie Y, Oertel WH, Schlegel J and Hartmann A. Gene expression profiling of lewy body-bearing neu-rons in Parkinson’s disease. Exp Neurol 2005; 195: 27-39.
[3] Pierson J, Norris JL, Aerni HR, Svenningsson P, Caprioli RM and Andren PE. Molecular profiling of experimental Parkinson’s disease: direct analysis of peptides and proteins on brain tis-sue sections by MALDI mass spectrometry. J Proteome Res 2004; 3: 289-295.
[4] Luan H, Liu LF, Tang Z, Zhang M, Chua KK, Song JX, Mok VC, Li M and Cai Z. Comprehensive urinary metabolomic profiling and identification of potential noninvasive
marker for idiopathic Parkinson’s disease. Sci Rep 2015; 5: 13888.
[5] Martins M, Rosa A, Guedes LC, Fonseca BV, Gotovac K, Violante S, Mestre T, Coelho M, Rosa MM, Martin ER, Vance JM, Outeiro TF, Wang L, Borovecki F, Ferreira JJ and Oliveira SA. Convergence of miRNA expression profil-ing, alpha-synuclein interacton and GWAS in Parkinson’s disease. PLoS One 2011; 6: e25443.
[6] Han J, Li C, Yang H, Xu Y, Zhang C, Ma J, Shi X, Liu W, Shang D, Yao Q, Zhang Y, Su F, Feng L and Li X. A novel dysregulated pathway-identifi-cation analysis based on global influence of within-pathway effects and crosstalk between pathways. J R Soc Interface 2015; 12: 20140937.
[7] Moran LB, Duke DC, Deprez M, Dexter DT, Pearce RK and Graeber MB. Whole genome expression profiling of the medial and lateral substantia nigra in Parkinson’s disease. Neurogenetics 2006; 7: 1-11.
[8] Na SJ, DiLella AG, Lis EV, Jones K, Levine DM, Stone DJ and Hess JF. Molecular profiling of a 6-hydroxydopamine model of Parkinson’s dis-ease. Neurochem Res 2010; 35: 761-772. [9] Ohnuki T, Nakamura A, Okuyama S and
Nakamura S. Gene expression profiling in pro-gressively MPTP-lesioned macaques reveals molecular pathways associated with sporadic Parkinson’s disease. Brain Res 2010; 1346: 26-42.
[10] Papapetropoulos S, Ffrench-Mullen J, McCor- quodale D, Qin Y, Pablo J and Mash DC. Multiregional gene expression profiling identi-fies MRPS6 as a possible candidate gene for Parkinson’s disease. Gene Expr 2006; 13: 205-215.
[11] Papapetropoulos S, Shehadeh L and McCorquodale D. Optimizing human post-mor-tem brain tissue gene expression profiling in Parkinson’s disease and other neurodegener-ative disorders: from target “fishing” to transla-tional breakthroughs. J Neurosci Res 2007; 85: 3013-3024.
[12] Reynolds AD, Glanzer JG, Kadiu I, Ricardo-Dukelow M, Chaudhuri A, Ciborowski P, Cerny R, Gelman B, Thomas MP, Mosley RL and Gendelman HE. Nitrated alpha-synuclein-acti-vated microglial profiling for Parkinson’s dis-ease. J Neurochem 2008; 104: 1504-1525. [13] Simunovic F, Yi M, Wang Y, Macey L, Brown LT,
Krichevsky AM, Andersen SL, Stephens RM, Benes FM and Sonntag KC. Gene expression profiling of substantia nigra dopamine neu-rons: further insights into Parkinson’s disease pathology. Brain 2009; 132: 1795-1809. [14] Sinha A, Patel S, Singh MP and Shukla R. Blood
Parkinson’s disease patients in Indian popula-tion. Clin Chim Acta 2007; 380: 232-234. [15] Wang YH, Samoylenko V, Tekwani BL, Khan IA,
Miller LS, Chaurasiya ND, Rahman MM, Tripathi LM, Khan SI, Joshi VC, Wigger FT and Muhammad I. Composition, standardization and chemical profiling of banisteriopsis caapi, a plant for the treatment of neurodegenerative disorders relevant to Parkinson’s disease. J Ethnopharmacol 2010; 128: 662-671. [16] West RJ, Elliott CJ and Wade AR. Classification
of Parkinson’s disease genotypes in drosophi-la using spatiotemporal profiling of vision. Sci Rep 2015; 5: 16933.
[17] Xun Z, Sowell RA, Kaufman TC and Clemmer DE. Lifetime proteomic profiling of an A30P al-pha-synuclein drosophila model of Parkinson’s disease. J Proteome Res 2007; 6: 3729-3738. [18] Liu S, Zhang Y, Bian H and Li X. Gene expres-sion profiling predicts pathways and genes as-sociated with Parkinson’s disease. Neurol Sci 2016; 37: 73-79.
[19] Hossein-Nezhad A, Fatemi RP, Ahmad R, Peskind ER, Zabetian CP, Hu SC, Shi M, Wahlestedt C, Zhang J and Faghihi MA. Transcriptomic profiling of extracellular RNAs present in cerebrospinal fluid identifies differ-entially expressed transcripts in Parkinson’s disease. J Parkinsons Dis 2016; 6: 109-117. [20] Li L, Zhang CW, Ge J, Qian L, Chai BH, Zhu Q,
Lee JS, Lim KL and Yao SQ. A small-molecule probe for selective profiling and imaging of monoamine oxidase b activities in models of Parkinson’s disease. Angew Chem Int Ed Engl 2015; 54: 10821-10825.
[21] Cui S, Sun H, Gu X, Lv E, Zhang Y, Dong P, Fu C and Zhu C. Gene expression profiling analysis of locus coeruleus in idiopathic Parkinson’s disease by bioinformatics. Neurol Sci 2015; 36: 97-102.
[22] Chen X, Xie C, Sun L, Ding J and Cai H. Lon- gitudinal metabolomics profiling of Parkinson’s disease-related alpha-synuclein A53T trans-genic mice. PLoS One 2015; 10: e0136612. [23] Mar JC, Matigian NA, Quackenbush J and Wells
CA. Attract: a method for identifying core path-ways that define cellular phenotypes. PLoS One 2011; 6: e25445.
[24] Li Y, Agarwal P and Rajagopalan D. A global pathway crosstalk network. Bioinformatics 2008; 24: 1442-1447.
[25] Zhang AM, Ma K, Song Y, Wang B, Feng Y, Liu L and Xia X. Genetic polymorphisms of the IFNlambda genes are associated with bio-chemical features in Han Chinese with HCV in-fection from Yunnan province, China. Infect Genet Evol 2014; 21: 161-165.
[26] Zhang AM, Ma K, Song Y, Feng Y, Duan H, Zhao
DNAs decreased and correlated with clinical features in HCV patients from Yunnan, China. Mitochondrial DNA 2015; 27: 2516-9.
[27] Ma K, Guo L, Xu A, Cui S and Wang JH. Molecular mechanism for stress-induced de-pression assessed by sequencing miRNA and mRNA in medial prefrontal cortex. PLoS One 2016; 11: e0159093.
[28] Ma K, Zhang H and Baloch Z. Pathogenetic and therapeutic applications of tumor necrosis factor-alpha (TNF-alpha) in major depressive disorder: a systematic review. Int J Mol Sci 2016; 17: E733.
[29] Parkinson H, Kapushesky M, Shojatalab M, Abeygunawardena N, Coulson R, Farne A, Holloway E, Kolesnykov N, Lilja P, Lukk M, Mani R, Rayner T, Sharma A, William E, Sarkans U and Brazma A. Arrayexpress--a public data-base of microarray experiments and gene ex-pression profiles. Nucleic Acids Res 2007; 35: D747-750.
[30] Barr TL, Conley Y, Ding J, Dillman A, Warach S, Singleton A and Matarin M. Genomic biomark-ers and cellular pathways of ischemic stroke by RNA gene expression profiling. Neurology 2010; 75: 1009-1014.
[31] Gautier L, Cope L, Bolstad BM and Irizarry RA. Affy--analysis of affymetrix genechip data at the probe level. Bioinformatics 2004; 20: 307-315.
[32] Irizarry RA, Hobbs B, Collin F, Beazer-Barclay YD, Antonellis KJ, Scherf U and Speed TP. Exploration, normalization, and summaries of high density oligonucleotide array probe level data. Biostatistics 2003; 4: 249-264.
[33] Sasik R, Calvo E and Corbeil J. Statistical analy-sis of high-density oligonucleotide arrays: a multiplicative noise model. Bioinformatics 2002; 18: 1633-1640.
[34] Kanehisa M and Goto S. KEGG: kyoto encyclo-pedia of genes and genomes. Nucleic Acids Res 2000; 28: 27-30.
[35] Rahnenfuhrer J, Domingues FS, Maydt J and Lengauer T. Calculating the statistical signifi-cance of changes in pathway activity from gene expression data. Stat Appl Genet Mol Biol 2004; 3: article16.
[36] Hung JH, Whitfield TW, Yang TH, Hu Z, Weng Z and DeLisi C. Identification of functional mod-ules that correlate with phenotypic difference: the influence of network topology. Genome Biol 2010; 11: R23.
[37] Franceschini A, Szklarczyk D, Frankild S, Kuhn M, Simonovic M, Roth A, Lin J, Minguez P, Bork P, von Mering C and Jensen LJ. String v9.1: proteprotein interaction networks, with in-creased coverage and integration. Nucleic Acids Res 2013; 41: D808-815.
[39] Al-Shahrour F, Diaz-Uriarte R and Dopazo J. FatiGO: a web tool for finding significant asso-ciations of gene ontology terms with groups of genes. Bioinformatics 2004; 20: 578-580. [40] Benjamini Y, Drai D, Elmer G, Kafkafi N and
Golani I. Controlling the false discovery rate in behavior genetics research. Behav Brain Res 2001; 125: 279-284.
[41] Hong F, Breitling R, McEntee CW, Wittner BS, Nemhauser JL and Chory J. RankProd: a bio-conductor package for detecting differentially expressed genes in meta-analysis. Bioinfor- matics 2006; 22: 2825-2827.


![(E) Methyl 2 [4 (dimethylamino)benzylidene]hydrazinecarboxylate at 123 K](data:image/gif;base64,R0lGODlhAQABAIAAAP///wAAACH5BAEAAAAALAAAAAABAAEAAAICRAEAOw==)