UDLAP: Sentiment Analysis Using a Graph Based Representation
Esteban Castillo
1, Ofelia Cervantes
1, Darnes Vilari˜no
2, David B´aez
1and
Alfredo S´anchez
11
Universidad de las Am´ericas Puebla
Department of Computer Science, Electronics and Mechatronics, Mexico
{
esteban.castillojz, ofelia.cervantes
}
@udlap.mx
{
david.baez, alfredo.sanchez
}
@udlap.mx
2
Benem´erita Universidad Aut´onoma de Puebla
Faculty of Computer Science, Mexico
[email protected]
Abstract
We present an approach for tackling the Sen-timent Analysis problem in SemEval 2015. The approach is based on the use of a co-occurrence graph to represent existing rela-tionships among terms in a document with the aim of using centrality measures to extract the most representative words that express the sentiment. These words are then used in a su-pervised learning algorithm as features to ob-tain the polarity of unknown documents. The best results obtained for the different datasets are: 77.76% for positive, 100% for negative and 68.04% for neutral, showing that the pro-posed graph-based representation could be a way of extracting terms that are relevant to de-tect a sentiment.
1 Introduction
In the past decade, new forms of communication, such as microblogging and text messaging have emerged and become ubiquitous. While there is no limit to the range of information conveyed by tweets and texts, often these short messages are used to
share opinions and sentiments that people have
about what is going on in the world around them. Working with these informal text genres presents challenges for natural language processing (NLP) beyond those encountered when working with more traditional text genres. Typically this kind of texts are short and the language used is very informal. We can find creative spelling and punctuation, slang, new words, URLs, and genre-specific terminology and abbreviations that make their manipulation more challenging.
Representing that kind of text for automatically mining and understanding the opinions and senti-ments that people communicate inside them has very recently become an attractive research topic (Pang, 2008). In this sense, the experiments reported in this paper were carried out in the framework of the SemEval 20151 (Semantic Evaluation) which has
created a series of tasks for Sentiment Analysis on Twitter (Rosenthal, 2015). Among the proposed tasks we find Task 10, subtask B which was named
Message Polarity Classification and was defined
as follows: ”Given a message, classify whether the message is of positive, negative, or neutral senti-ment. For messages conveying both a positive and a negative sentiment, whichever is the stronger sen-timent should be chosen”. In order to solve this task we create an approach that uses a graph based rep-resentation to extract relevant words that are used in a supervised learning method to classify a set of unknown documents in different topics and genres provided by the SemEval team. The methodology for our approach is discussed in detail in the next sections.
The rest of the paper is structured as follows. In Section 2 we present some related work found in the literature with respect to the identification of senti-ments in text docusenti-ments. In Section 3 a graph based representation is proposed. In Section 4 the method-ology and the tools used to detect the sentiments of a set of unknown documents are explained. In Sec-tion 5, the experimental results are presented and discussed. Finally, in Section 6 the conclusions as well as further work are described.
1http://alt.qcri.org/semeval2015/
2 Related Work
There exist a number of works in literature associ-ated to the automatic identification of sentiments in documents. Some of these works have focused on the contribution of particular features, such as the use of the vocabulary to extract lexical elements as-sociated to the documents (Kim, 2006), the use of bigrams and trigrams (Dave, 2008) to capture syn-tactic features of texts associated with a sentiment, the use of dictionaries and emoticons of positive and negative words (Agarwal, 2011) as well as lexical-syntactic features or the use of Part of Speech tags (PoS) (Wilks, 1999; Whitelaw, 2005) as syntactic features that can help to disambiguate the polarity of the words in a context.
In the other hand, many contributions focused on the use of structures to represent the features asso-ciated to a document like the frequency of occur-rence vector (Wrobel, 2002; Aizawa, 2003; Serrano, 2006). Finally, linear representation of documents features combined with the use of a Support Vector Machine (SVM) has shown great performance in the tasks associated with the classification of texts (Vap-nik, 1995; Joachims, 1998).
Research works that use graph representations for texts in the context of Sentiment Analysis barely ap-pear in the literature (Pinto, 2014; Poria, 2014). It usually has been proposed the concept of n-grams with a frequency of occurrence vector to solved it (Pang, 2008). However, there is still an enormous gap between this approach and the use of more de-tailed graph structures that represent in a natural way the lexical, semantic and stylistic features.
3 Graph-Based Representation
Among different proposals for mapping texts to graphs, the co-occurrence of words (Sonawane, 2014) has become a simple but effective way to rep-resent the relationship of one term over another one in texts where there is no syntactic order (usually social media texts like Twitter or SMS). Formally the proposed co-ocurrence graph is represented by
G= (V, E, L, α), where:
• V = {vi|i = 1, ..., n}is a finite set of vertices that consists of the words contained in one or several texts.
• E ⊆ V ×V is the finite set of edges which represents that two vertices are connected by means of the co- occurrence, where:
– Two vertices are connected if their cor-responding lexical units co-occur within
a window of maximumN words, where
N can be set to any value (typically be-tween two and ten words).
• L is the edges tag set which consists of the number of times that two vertices co-occur in a text window.
• α: E→Lis a function that assigns a tag to a pair of associated vertices.
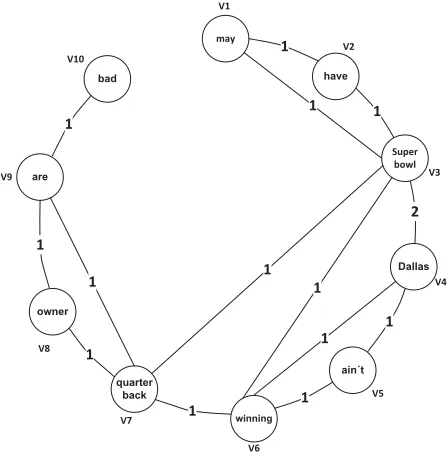
As an example, consider the following sentenceζ
extracted from a text T in the dataset: “They may have a SuperBowl in Dallas, but Dallas ain’t win-ning a SuperBowl. Not with that quarterback and owner, they are really bad.”, which after the prepro-cessing stage (see Section 4) would be as follows: “may have SuperBowl Dallas Dallas ain’t winning SuperBowl quarterback owner are bad”. Based on the proposed representation, preprocessed sentence
ζcan be mapped to the proposed co-ocurrence graph shown in Figure 1.
V1
bad
are
owner
quarter back
may
ain´t Dallas
Super bowl
have
winning
V2
V3
V4
V5
V6 V7
V8 V9
V10
1
2
1
1 1
1 1
1
1
1
[image:2.612.316.540.457.684.2]1 1 1 1
SemEval 2015 Dataset
Positive texts
Centrality measures Graph for all documents
Model
SVM polynomial kernel
Test file Training file
Training phase
Result
...
Test phase
1
2
3
Feature extraction
4 ...
5
frequency vectors of extracted features
...
Preprocess documents
Neutral texts
Negative texts
Graph representation
... ...
[image:3.612.106.500.90.333.2]Test vectors Training vectors
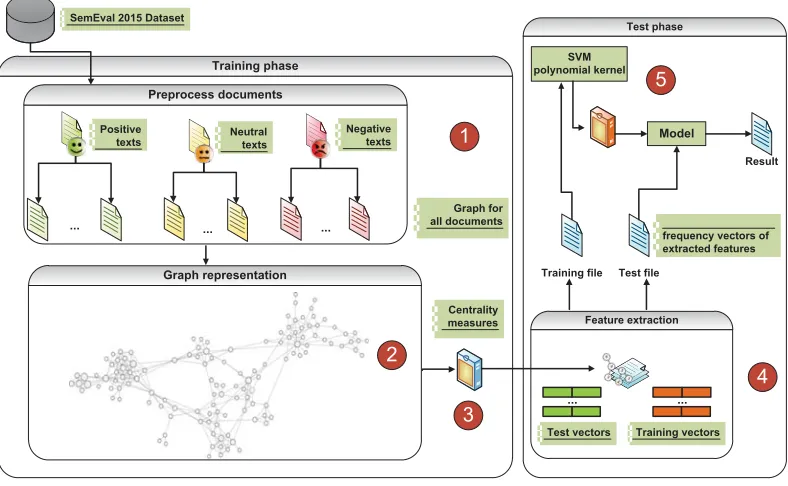
Figure 2: Sentiment Analysis Process
The co-occurrence graph shown in figure 1 has the following features:
• Terms co-occur within a window of3words. • The set of vertices consists of the preprocessed
words in sentenceζ.
• An edge between two vertices represent that both words appear in the same co-occurrence window (at least once).
• The label edge between two vertices represents the number of times that two words appear in a co-occurrence window in sentenceζ.
4 Sentiment Analysis Process Using A
Graph Representation
Figure 2 shows the methodology used to detect the sentiments associated to a set of unknown docu-ments, considering the use of graphs to extract the most relevant words associated to the documents. The methodology consists of five steps:
1. Preprocess all documents associated with the SemEval 2015 dataset. This task includes elim-ination of punctuation symbols and all the ele-ments that are not part of the ASCII encoding.
Then, each preprocessed sentence in a text is tagged with its corresponding PoS tags, for this step, the TreeTagger tool2was used.
2. Map only the nouns, verbs and adjectives of all documents in the training set to a graph repre-sentation (see section 3).
3. Apply the Degree and Closeness centrality measures (Freeman, 1979) which are indicators that identify the most important vertices within a graph, where:
• The Degree centrality is defined as the number of links incident upon a vertex in the graph and is used to find the topologi-cally representative words.
• The Closeness centrality is defined as the average sum of the shortest paths from one vertex to the others in the graph and is used to find the most accessible words in the graph which consequently are syntac-tically relevant.
4. For each document in the training and test col-lection extract thetop 100 ranked vertices(the
Table 2: Evaluation of the graph model approach using the test dataset
Test Dataset Methodology % Correct % Correct % Correct % Overall BaselineRuntime Positive Negative Neutral score
Official 2015 Test 00:04:56 70.90 43.23 52.06 42.10 30.28
LiveJournal 2014 00:05:14 63.95 59.57 48.82 50.11 29.2
SMS 2013 00:05:14 52.16 42.56 68.04 39.35 19.0
Twitter 2013 00:05:14 70.44 44.49 54.69 41.93 34.6
Twitter 2014 00:05:14 77.76 45.00 49.50 45.93 27.7
Twitter Sarcasm 00:05:14 50.00 100.00 26.32 41.04 27.2
most important words in the graph) from both centrality measures in the graph without repe-tition and use them to build a frequency of oc-currence vector (Manning, 2008).
5. Apply a SVM classifier (Harrington, 2012) with a polynomial kernel implemented in the scikit-learn3platform (Pedregosa, 2011), in
or-der to construct a classification model which is used for determining the sentiment of a given anonymous document.
5 Experimental results
The results obtained with the proposed approach are discussed in this section. First, we describe the dataset used in the experiments and, thereafter, the results obtained.
5.1 Dataset
The description of the three text collections used in the experiments for the SemEval 2015 is shown in the next table:
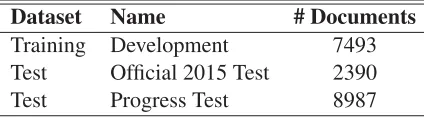
Table 1: Datasets used in the Sentiment Analysis problems
Dataset Name # Documents
Training Development 7493
Test Official 2015 Test 2390
Test Progress Test 8987
The test corpus was made up of short texts (mes-sages) categorized as: ”Progress Test” and Offi-cial 2015 Test. The Progress Test includes the fol-lowing datasets: LiveJournal2014, SMS2013, Twit-ter2013, Twitter2014 and Twitter2014Sarcasm. A
3http://scikit-learn.org/stable/
complete description of the training and test datasets can be found at the task description paper (Rosen-thal, 2015).
5.2 Obtained results
In Table 2 we present results obtained with each dataset considered in the SemEval 2015 competi-tion. The results were evaluated according to the
(F1pos+F1neg)/2measure (Rosenthal, 2014) for the overall score and the precision measure (Man-ning, 2008) for each one of the sentiments. Our approach performed in all cases above the base-line. We consider that these results were obtained even though the training corpus was very unbal-anced (there were more positive texts than others) and there was a high difference between the vocabu-lary of the training and test datasets. Further anal-ysis on the use of centrality measures and on the methodology for constructing the graph will allow us to find more accurate features that can be used in a supervised learning method for the Sentiment Analysis problem.
6 Conclusions
[image:4.612.82.294.558.617.2]sentiment instead of using traditional features like n-grams and vocabulary. As further work we propose the following:
• Experiment with other graph representations for texts that include alternative levels of lan-guage descriptions such as the use of sentence chunks, pragmatic sentences, etc.
• Apply the graph representation described in this paper to the Authorship Attribution prob-lem (Holmes, 1994), where training and test data sets are balanced and belong to the same linguistic domain.
• Explore different supervised/unsupervised classification algorithms.
Acknowledgements
This work was partially supported by the REAU-MOBILE Proyect: CONACYT-OSEO no. 192321
References
Agarwal A., Xie B., Vovsha I., Rambow O., Passonneau R. 2011. Sentiment Analysis of Twitter Data. Pro-ceedings of the Workshop on Languages in Social Me-dia. Stroudsburg, PA, USA, 30-38.
Aizawa, A. 2003. An information-theoretic perspective of tf-idf measures. Journal of Information Processing and Management, 39, 45–65.
Dave, S. L. K. and Pennock, D. M. 2003. Mining the Peanut Gallery: Opinion Extraction and Seman-tic Classification of Product Reviews, Proceedings of the 12th International Conference on World Wide Web. New York, NY, USA, 519-528.
Freeman, L.C. 1979. Centrality in Social Networks: Conceptual Clarification. Journal of Social Networks, 1, 215–239.
Harrington, P. 2012.Machine Learning in Action. Man-ning Publications Co., Greenwich, CT, USA.
Holmes, D. 1999. Authorship Attribution. Journal of Computers and the Humanities, 28, 87–106.
Joachims, T. 1998. Text Categorization with Suport Vec-tor Machines: Learning with Many Relevant Features, Proceedings of the 10th European Conference on Ma-chine Learning, London, UK, 137–142.
Kim, S.-M. and Hovy, E. 2006. Automatic Identification of Pro and Con Reasons in Online Reviews. Proceed-ings of the COLING/ACL Main Conference Poster Sessions, Stroudsburg, PA, USA, 483–490.
Manning, C. D., Raghavan, P. and Sch¨utze, H. 2008. In-troduction to Information Retrieval. Cambridge Uni-versity Press, New York, NY, USA.
Pang, Bo and Lee, Lillian. 2008. Analysis mining opin-ion sentiment. Journal of Foundatopin-ions and Trends in Information Retrieval, 2, 1–135.
Pedregosa, F. 2011. Scikit-learn: Machine Learning in Python, Journal of Machine Learning Research, 12, 2825–2830.
Pinto, D., Vilari˜no D., Leon S., Jasso M., and Lucero C. 2014. BUAP: Polarity Classification of Short Texts, Proceedings of the 8th International Workshop on Se-mantic Evaluation (SemEval 2014), Dublin, Ireland, 154–159.
Poria S., Cambria E., Winterstein G., Huang H. 2014. Sentic patterns: Dependency-based rules for concept-level sentiment analysis, Journal of Knowledge-Based Systems USA.
Rosenthal S., Nakov P., Kiritchenko S., Mohammad S., Ritter A., Stoyanov V. 2014. SemEval-2014 Task 9: Sentiment Analysis in Twitter, Proceedings of the 8th International Workshop on Semantic Evaluation, Dublin, Ireland, 73–80.
Rosenthal S., Nakov P., Kiritchenko S., Mohammad S., Ritter A., Stoyanov V. 2015. SemEval-2015 Task 10: Sentiment Analysis in Twitter, Proceedings of the 9th International Workshop on Semantic Evaluation, Den-ver, Colorado, USA.
Serrano, J. and del Castillo, M. 2006. Text Representa-tion by a ComputaRepresenta-tional Model of Reading. Journal of Neural Information Processing, 237–246.
Sonawane S and Kulkarni P. 2014. Graph based Rep-resentation and Analysis of Text Document: A Sur-vey of Techniques. Journal of Computer Applications, 96(19):1-8.
Vapnik, V. N. 1995. The Nature of Statistical Learning Theory. Springer. New York, NY, USA.
Whitelaw, C., Garg, N. and Argamon, S. 2005. Using appraisal groups for sentiment analysis. Proceedings of the ACM SIGIR Conference on Information and Knowledge, New York, NY, USA, 625–631.
Wilks, Y. and Stevenson, M. 1999. The Grammar of Sense: Using part-of-speech tags as a first step in se-mantic disambiguation. Journal of Natural Language Engineering, 4(3), 4.