Numerical modelling of the passive control of air pollution in asymmetrical urban street canyons using refined mesh discretization schemes
J. Gallagher, L.W. Gill, A. McNabola
PII: S0360-1323(12)00105-9 DOI: 10.1016/j.buildenv.2012.03.013 Reference: BAE 3121
To appear in: Building and Environment
Received Date: 16 November 2011 Revised Date: 2 March 2012 Accepted Date: 18 March 2012
Please cite this article as: Gallagher J, Gill LW, McNabola A, Numerical modelling of the passive control of air pollution in asymmetrical urban street canyons using refined mesh discretization schemes,
Building and Environment (2012), doi: 10.1016/j.buildenv.2012.03.013
M
AN
US
CR
IP
T
AC
CE
PT
ED
NUMERICAL MODELLING OF THE PASSIVE CONTROL OF AIR POLLUTION IN 1
ASYMMETRICAL URBAN STREET CANYONS USING REFINED MESH 2
DISCRETIZATION SCHEMES. 3
4
J. Gallaghera,*, L.W. Gilla and A. McNabolaa.
5
a
. Dept of Civil, Structural & Environmental Engineering, Trinity College Dublin, Ireland.
6
* Corresponding author. Tel: +353 01 896 2781
7
Email address: [email protected]
8
9
Abstract 10
This study evaluates the potential of passive controls in asymmetrical street canyons to reduce
11
personal exposure to air pollutants on footpaths. A passive control in the form of a low boundary
12
wall (LBW) may act as a baffle within a street canyon, producing modified airflow patterns and
13
increase pollutant dispersion at street level. This numerical modelling study assessed the spatial
14
distribution of concentrations of a tracer pollutant in a street canyon. Concentrations were measured
15
along the centre of both footpaths at breathing height to determine the percentage difference
16
between pollutant concentrations in canyons with and without passive controls. The investigation
17
assessed asymmetrical street canyons of different building height ratios (H1/H2 ratio ranging from 18
0.5–1.5 in 0.1 intervals) in perpendicular wind conditions. The results indicated that the H1/H2 ratio 19
affects pollutant dispersion and the implementation of a passive control can reduce the pollutant
20
concentration on the footpaths. The percentage difference in concentrations induced by the presence
21
of footpath LBWs ranged from an increase of up to 19% to a reduction of 30% on the leeward
22
footpath, with reductions between 26% and 50% on the windward footpath with varying H1/H2 23
ratios. Comparing the results to a central LBW configuration identified the creation of two distinct
M
AN
US
CR
IP
T
AC
CE
PT
ED
vortices in the street canyon. The results also identified the effect of wind speed on the development
1
of primary vortices. For urban planners, passive controls offer a method of increasing dispersion by
2
modifying normal air flow patterns and potentially improve air quality in urban street canyons.
3
4
Keywords: Air Pollution; Passive Controls; Low Boundary Walls; Asymmetrical Canyons; Personal
5
Exposure.
6
7
1. Introduction 8
A functional urban centre comprises a range of vital services to cater for its inhabitants. To maintain
9
these services, large quantities of energy are required, and this energy has associated air pollution
10
emissions. Vehicular emissions contribute to the majority of urban air pollution, despite significant
11
improvements in vehicle technology [1]. In the UK, two hundred air pollution hotspots were
12
identified that were caused by heavy volumes of traffic in urban street canyons [2]. The combination
13
of increasing global and urban populations has led to the introduction of additional public services
14
and the physical expansion of cities [3]. The construction of high rise buildings to cater for growing
15
populations has led to a deterioration in air quality in urban streets and the development of the urban
16
heat island (UHI), as canyons with high aspect ratios reduce the rate of air exchange between roof
17
and the street, leading to trapped air at street level [4-6]. Other researchers concur with these
18
findings, additionally identifying vehicular turbulence [7-10] and the layout and orientation of a
19
street [11, 12] as other influential parameters that effect pollutant dispersion in urban canyons.
20
21
The geometry of an urban street canyon is a crucial element which can influence air flow and
22
pollutant dispersion within an urban microenvironment. Studies such as that of Santiago and Martín
23
[13] identified the creation of multiple vortices in asymmetric street canyons. The spatial
M
AN
US
CR
IP
T
AC
CE
PT
ED
distribution of pollutants differs in canyons of different geometrical configurations [9]. Another
1
study similarly highlighted the governing effect of canyon geometry on the flow patterns and
2
turbulence properties [14]. Research by Oke [15] defined three different flow regimes (isolated
3
roughness, wake interference and skimming) that occur for varying two dimensional canyon aspect
4
ratios with flat roof configurations. The dependency of pollutant ventilation on the canyon geometry
5
was identified, as wider canyons promote ventilation [16]. These findings correspond with the
6
results from another modelling study of varying asymmetry aspect ratios [4], using Computational
7
Fluid Dynamic (CFD) modelling to assess the effects of varying asymmetrical building heights on
8
pollutant dispersion.
9
10
The implementation of passive controls in the urban environment is a current approach to protect
11
human health by manipulating natural air flow patterns [17]. Previous research identified common
12
physical urban features such as solid free standing walls [18], trees [19] or on-street parked cars [20]
13
that act as baffle plates, disrupting the normal distribution of air pollutants when located in street
14
canyons. In a rural context, researchers identified roadside noise barriers as a method of controlling
15
air flow and turbulent conditions, thus affecting the dispersion patterns of pollutant concentrations
16
[21-23]. Passive controls can be configured in street canyons to reduce air pollutant exposure for
17
pedestrians on footpaths through the manipulation of natural dispersion patterns. A combined
18
monitoring and numerical modelling study was carried out to highlight the role of an existing low
19
boundary wall (LBW) in an urban street in Dublin, Ireland [18]. The LBW was situated between the
20
roadway footpath and the pedestrian boardwalk; an extended walkway along the edge of the river
21
Liffey. The results of the measurement study indicated greater personal exposure to PM2.5 and 22
VOCs on the roadside footpath compared to the boardwalk by factors of approximately 2.8 and 2.0,
23
respectively. Previous investigators have also examined the influence of avenue like trees on
M
AN
US
CR
IP
T
AC
CE
PT
ED
pollutant dispersion in a typical street canyon using CFD and wind tunnel models. Overall, these
1
studies concluded that the in-canyon air quality can be significantly altered by avenue-like tree
2
planting in a canyon with a H/W of 1, which found an increase in concentrations at the leeward wall
3
and a moderate pollutant concentration decrease near the windward wall during perpendicular wind
4
conditions [19, 24]. These studies highlighted the H/W ratio as the crucial parameter of pollutant
5
dispersion compared to the density or porosity of the trees. The most recent research of passive
6
controls assessed the capabilities of on-street parked cars as a form of passive control by means of a
7
numerical modelling investigation [20]. The study examined a series of different parking layouts
8
(parallel, perpendicular and 45° parking) under different meteorological conditions (varying wind
9
speed and direction). The results identified that parallel parking provided the best overall scenario to
10
reduce pollutant concentrations on urban street canyon footpaths. The study further concluded that
11
the fraction of the parking bays occupied by vehicles influenced the results of parked cars as a
12
potential passive control [20].
13
14
Research in this area to date has focused on the effectiveness of passive controls operating in
15
symmetrical street canyons. Therefore, this study focuses on the performance of passive controls in
16
reducing personal exposure from vehicular pollutants in asymmetrical street canyons for varying
17
meteorological conditions. A numerical modelling investigation using the commercial CFD software
18
Fluent 6.3 [25] was carried out, to assess the potential percentage reductions in personal exposure to
19
air pollution on footpaths, between canyons with and without passive controls.
20
21
2. Methodology 22
2.1 Asymmetrical Canyon Models
M
AN
US
CR
IP
T
AC
CE
PT
ED
This study comprised two numerical modelling cases to estimate the effects of introducing a passive
1
control on air flow and pollutant dispersion in asymmetrical urban street canyons. The study
2
assessed a series of three dimensional models which differed from one another with the inclusion of
3
LBWs located on the footpath or in the centre of the canyon at a height of 0.5m and strategically
4
located to increase dispersion and potentially reduce pollutant concentrations at street level. The
5
cases investigated the percentage reduction in pedestrian exposure of an inert virtual tracer pollutant
6
for a range of asymmetrical canyon configurations with vehicular emissions represented as an area
7
source across the road surface. Two sets of models were constructed for each H1/H2 ratio in the first 8
case; the first set consisted of a reference model (200 metres in length (+Z direction)) without
9
passive controls and the second set consisted of a near-identical model, containing LBWs on the
10
outer edge of both footpaths. Fig. 1 illustrates examples of two of the asymmetrical street canyon
11
models with H1/H2 ratios of 0.5 and 1.5, respectively. The leeward building height (H2) was equal to 12
the width of the canyon floor (W) of 14m in all of the models, for both the reference and LBW
13
models. The windward building height, H1 was proportional to the leeward building height, H2 as 14
the H1/H2 ratio varied in the model configurations from 0.5–1.5 in 0.1 intervals to allow a detailed 15
investigation of asymmetrical canyons. Fig. 1(a) displays a cross section of a typical street canyon
16
model with a H1/H2 ratio of 0.5, consisting of two footpath LBWs, two 4m wide traffic lanes and 17
two 3m footpaths. The models were created for different H1/H2 ratios in 0.1 intervals to identify 18
precise changes in the air flow patterns due to canyon asymmetry. The pollutant concentration
19
measured in both configurations was then compared to yield the percentage difference between the
20
two models. Each model was run with an inlet wind velocity of 8 m/s to identify the different
21
formations of primary and secondary vortices in a perpendicular wind direction (-X direction) to the
22
canyon floor for models of varying H1/H2 ratios. 23
M
AN
US
CR
IP
T
AC
CE
PT
ED
Fig. 1. Cross section of three-dimensional asymmetrical canyon models (a) 0.5 H1/H2 with two 1
footpath LBWs and (b) 1.5 H1/H2 with one central LBW. 2
3
Two monitoring lines were inserted at the centre of both footpaths in each model at heights of 1.00m
4
and 1.76m, to represent the path of a child and adult walking the full length of the canyon. The data
5
output from each monitoring line recorded the average tracer concentration along each line every
6
second. A result was obtained for each model by taking an average value of the output data, once a
7
steady state was observed in the monitoring path lines. Convergence was deemed adequate when
8
model predictions reached a relatively steady state for a moving average value of approximately 50
9
time steps (seconds). The mean difference in pollutant concentration was then calculated between
10
the reference and LBW configurations and expressed as a percentage reduction of the mean
11
reference pollutant concentration. Fig. 2 shows a typical output for the measured pollutant
12
concentration of the tracer gas and the difference in pollutant concentrations between the reference
13
and LBW models. In this particular example the difference between the pollutant concentration on
14
the windward footpath between the two model configurations was negative i.e. personal exposure to
15
an air pollutant was reduced due to the presence of a passive control.
16
17
Fig. 2. Determining the percentage difference in the pollutant concentration achieved by comparing 18
a LBW model to the reference model on the windward footpath.
19
20
2.2 Footpath and Central LBW Layouts
21
A second modelling case extended the findings of the first case by modelling an additional
22
configuration with a LBW of 0.5m in height in the centre of the canyon between the two traffic
23
M
AN
US
CR
IP
T
AC
CE
PT
ED
allow a comparison between the LBW models. The pollutant concentration measured on both
1
footpaths was then compared to the equivalent models for the previous modelling case. The central
2
LBW models were run at the same inlet wind velocity as the previous case and in addition, were
3
also run for a low wind speed of 2 m/s to determine the effects of wind speed on the development of
4
vortices.
5
6
2.3 Numerical Modelling
7
The solver used to simulate the turbulent flow of air in the street canyon models was the large eddy
8
simulation (LES) turbulence model. The numerical modelling of air pollutant dispersion using CFD
9
has been carried out by previous investigators commonly using either the k-ε turbulence model [12,
10
26, 27] or the LES turbulence model [5, 20, 28]. The LES model was used in this investigation
11
rather than k-ε model due to a more complex geometry at street level in a typical street canyon [28,
12
29]. Several studies have evaluated the LES turbulence model to simulate turbulent air flow and
13
pollutant dispersion in urban canyons and found a strong agreement between the CFD models and
14
wind tunnel experiments [30, 31].
15
16
Turbulent flows are characterised by eddies with a wide range of length and time scales. The largest
17
eddies are typically comparable in size to the characteristic length of the mean flow. The smallest
18
scales are responsible for the dissipation of turbulence kinetic energy. The quantities of momentum,
19
mass, energy, and other passive scalars are transported mostly by large eddies. Large eddies are
20
more problem-dependent, they are dictated by the geometries and boundary conditions of the flow
21
involved. Small eddies are less dependent on the geometry, tend to be more isotropic, and are
22
consequently more universal. As a result in LES, large eddies are resolved directly, while small
23
eddies are modelled. LES modelling uses a filtered Navier-Stokes equation and is suitable for more
M
AN
US
CR
IP
T
AC
CE
PT
ED
complex geometries than the k-ε model but is more computationally expensive. The complete
1
system of the LES model is given in Equations (1) – (4):
2 0 ) ( = ∂ ∂ + ∂ ∂ i i u x t ρ ρ
, (1)
3
Where ρ is the density of the fluid and u is the velocity and:
4
[
]
j ij i j ij j j i j i x x x x u u x u t ∂ ∂ − ∂ Ρ ∂ − ∂ ∂ ∂ ∂ = ∂ ∂ + ∂∂ ρ ρ µ σ τ
) (
)
( , (2)
5
Where µ is the viscosity of the fluid and P is the pressure; σij is the stress tensor due to molecular 6
viscosity, given below; τij is the subgrid-scale stress given: 7 ij l l i j j i ij x u x u x u
δ
µ
µ
σ
∂ ∂ − ∂ ∂ + ∂ ∂ = 3 2 (3) 8 9 j i j iij
ρ
uuρ
uuτ
= − (4)10
11
LES turbulence modelling has been used for a series of numerical modelling investigations of
12
passive controls. This study has used similar preparation techniques for the solution of street canyon
13
models [18, 20, 32].
14
15
2.4 Model Preparation & Mesh Discretization 16
The generic canyon models were constructed using Gambit v2.3, a CFD model development and
17
meshing tool. The surfaces of the canyon floor and buildings were constructed as wall boundaries to
18
resemble the impermeable nature of their characteristic materials. Additional faces of the model
19
domain were constructed as atmospheric boundaries where air either entered or escaped from the
20
canyon model. The property of a pressure outlet was attached to all atmospheric surfaces where air
M
AN
US
CR
IP
T
AC
CE
PT
ED
escaped the canyon and a velocity inlet was attached to any face where air entered the canyon. The
1
road lane and footpath widths remained constant in all model configurations to maintain a level of
2
continuity between each model. The width of the roadway also remained constant in each model
3
configuration to maintain a similar emissions rate. A constant footpath width was also maintained to
4
allow a clear comparison of the measured pollutant concentration on the footpath in all of the
5
models. Fig. 2 illustrates the arrangement of some of the model layouts with different H1/H2 ratios 6
and LBW configurations, where H1 is the building height on the windward building side of the 7
canyon and H2 is the height of buildings on the leeward side of the canyon. 8
9
Initially, a detailed mesh discretization analysis was carried out to determine suitable mesh
10
parameters for the asymmetry study. Previous investigations have stated that a grid sensitivity study
11
is crucial for independent cases, as conditions vary depending on canyon geometry [33, 34]. A
12
typical computational domain was meshed with a series of grid density schemes combining a
13
surface mesh at canyon floor level with a proportionate volume mesh. Based on the results, a
14
tapered surface grid mesh was selected for the canyon floor with a uniform volumetric mesh. This
15
was due to converging results for larger meshes on the windward footpath than on the leeward
16
footpath as shown in Fig. 3. The canyon floor was meshed with triangular mesh elements of 0.2m on
17
the leeward footpath, 0.3m on the road surface and 0.4m on the windward footpath with the overall
18
volume meshed with a 1.0m tetrahedral mesh. The virtual tracer emissions were released from the
19
road surface at ground level (i.e. Z = 0) in the asymmetrical canyon models. The inert tracer acts as
20
an indicator pollutant to assess the dispersion of any pollutant common to an urban street canyon.
21
22
Fig. 3. Leeward and windward footpath concentrations of tracer gas for models with varying mesh
23
discretization schemes.
M
AN
US
CR
IP
T
AC
CE
PT
ED
1
A series of model configurations were also examined with extended heights above the rooftop of the
2
buildings of Hr (Hr equals to the maximum height of H1 or H2 multiplied by an extended height 3
factor, X) to allow air flow to enter or exit the canyon above the buildings. Values of Hr (see Fig. 2)
4
where X = 0.25, 0.5, 1.0 & 2 times the greater value of H1 or H2 were examined. Fig. 4 illustrates 5
the plot of the measured pollutant concentrations for each of the model configurations. Observing
6
the data output, it was identified that a reduction in the extended roof height did not affect the results
7
observed at street level within each model configuration. Therefore, 0.25H was selected for this
8
study as it minimised the volume for each model and further optimised the computational timeframe
9
requirements.
10
11
Fig. 4. Leeward and windward footpath concentration of tracer gas for models with varying
12
extension height above rooftop.
13
14
In addition, to optimise the computational time of a typical model configuration, an analysis of data
15
output of iterations per time step was carried out. The objective of this analysis was to identify the
16
point at which iteration values converged and the number of iterations could be reduced per time
17
step at different stages during the model run. The default convergence criteria in Fluent are typically
18
for absolute values for several individual residuals. The manual reduction of iterations can reduce
19
the running time of models without a loss of accuracy and provides an alternative solution to a
20
sensitivity analysis of a wide range of residuals in turbulent models. The results from the test are
21
displayed in Table 1. The results identified the allowance for a reduction in iterations over time to
22
reduce the cumulative running time of the models. A reduction in the number of iterations was
M
AN
US
CR
IP
T
AC
CE
PT
ED
considered adequate when a convergence level of over 99.99% (values less than 0.01% in Table 1)
1
was identified.
2
3
Table 1. Iteration per time step test to optimise model computational running times (displayed as
4
percentage of value of iteration divided by value of final iteration).
5
6
3. Results 7
3.1 Asymmetrical Canyon Models 8
The results of the investigation for the asymmetrical canyon models of varying H1/H2 ratios are 9
presented in Figs. 5 & 6. The results compare the pollutant concentration between the reference and
10
footpath LBW models and present the difference as a percentage for each H1/H2 ratio at heights of 11
1.00m and 1.76m, respectively. The results showed that the presence of two footpath LBWs
12
provides varied results on both footpaths.
13
14
The results varied on the leeward footpath (Fig. 5) with an initial reduction in the pollutant
15
concentration of 17% for a H1/H2 of 0.5 at a height of 1.76m. The difference reduced with increases 16
in the H1/H2 ratio up to 1.1, where an increase in the pollutant concentration of 9% was calculated 17
between the model configurations. An upward trend was identified from a H1/H2 of 1.1, reaching a 18
reduction in the pollutant concentration of 3% for a H1/H2 of 1.5. A similar pattern of reductions and 19
increases in the differences between the model configurations was noted at a child height of 1.00m.
20
The percentage reduction in pollutant concentration ranged from 24% for a H1/H2 ratio of 0.5, to an 21
increase of 2% for a H1/H2 of 1.1 and a maximum reduction of 30% for a H1/H2 of 1.5. 22
M
AN
US
CR
IP
T
AC
CE
PT
ED
Fig. 5. Plot of average percentage pollutant concentration on leeward footpath in different H1/H2 1
ratio canyons at respective heights.
2
3
On the windward footpath, the results (displayed in Fig. 6) showed reductions in the pollutant
4
concentration for all H1/H2 for all asymmetrical ratios. At adult height of 1.76m, the reductions 5
calculated ranged from a minimum of 26% for a H1/H2 ratio of 0.8 with incremental increases in the 6
reduction to 40% and 48% for a H1/H2 of 0.5 and 1.5, respectively. The percentages reduction at 7
child height of 1.00m ranged from a minimum of 30% for a H1/H2 ratio of 0.8. More significant 8
reductions were calculated for both reduced and increased H1/H2 ratios from 0.8 to 0.5 and 1.5 with 9
reductions of 50% and 48%, respectively.
10
11
Fig. 6. Plot of average percentage pollutant concentration on windward footpath in different H1/H2 12
ratio canyons at respective heights.
13
14
3.2 Footpath and Central LBW Layouts 15
The comparative results for the footpath and central LBW configurations are shown in Table 2 for a
16
high wind speed of 8 m/s and a perpendicular wind direction. The results are displayed as the
17
percentage difference between the reference model and the corresponding LBW model for H1/H2 18
ratios of 0.5, 1.0 and 1.5. The results show a reduction in almost all asymmetrical layouts on both
19
the leeward (LW) and windward (WW) footpaths. The pollutant concentration was reduced by up to
20
30% on the leeward footpath at a height of 1.00m for a H1/H2 ratio of 1.5, however, and increase 21
was observed for a H1/H2 of 1.0 on the leeward footpath of 14% with the introduction of footpath 22
LBWs at a height of 1.76m. The implementation of a central LBW provides reductions in pollutant
23
M
AN
US
CR
IP
T
AC
CE
PT
ED
from 12% (H1/H2 of 1.0 at 1.76m height) to a maximum of 50% (H1/H2 of 1.5 at 1.00m height). 1
Reductions in pollutant concentrations were calculated for all H1/H2 asymmetrical ratios in both 2
LBW layouts on the windward footpaths. The reductions ranged from 36% to 50% on the windward
3
footpath with footpath LBWs, at 1.00m heights for a H1/H2 ratio of 1.0 and 0.5, respectively. The 4
reduction in pollutant concentrations were more prominent on the windward footpath for a central
5
LBW as reductions ranged from 39% to 64%, at a height of 1.00m for a H1/H2 ratio of 1.0 and 1.5, 6
respectively.
7
8
Table 2. Percentage difference of reference model to footpath and central LBW models for a high (8
9
m/s) wind speed in a perpendicular direction to street canyon.
10
11
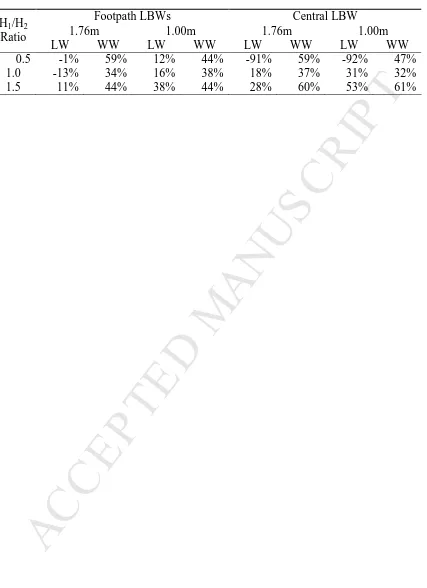
For a low wind speed of 2 m/s in a perpendicular wind direction, the comparative results for the
12
footpath and central LBW configurations are shown in Table 3. The results show a combination of
13
reductions and increases in pollutant concentrations on both the leeward (LW) and windward (WW)
14
footpaths. A small increase in the pollutant concentration of 13% (H1/H2 of 1.0 at 1.76m height) 15
occurred on the leeward footpath with the implementation of the footpath LBWs, with reductions of
16
up to 38% measured at a height of 1.00m for a H1/H2 ratio of 1.5. A significant increase in the 17
pollutant concentration of 92% was evident on the leeward footpath for a H1/H2 of 0.5 at a height of 18
1.00m with a central LBW, yet a larger reduction was evident for a H1/H2 of 1.5 at a height of 1.00m 19
of 53%. On the windward footpaths, reductions in the pollutant concentrations occurred for all
20
H1/H2 asymmetrical ratios in both the footpath and central LBW layouts. The reduction in pollutant 21
concentrations on the windward footpath with footpath LBWs ranged from 34% to 59% (at 1.76m
22
M
AN
US
CR
IP
T
AC
CE
PT
ED
central LBW ranged from 32% to 61%, at a height of 1.00m for H1/H2 ratios of 1.0 and 1.5, 1
respectively.
2
3
Table 3. Percentage difference of reference model to footpath and central LBW models for a low (2
4
m/s) wind speed in a perpendicular direction to street canyon.
5
6
Differences in pollutant concentrations are evident between the low (2 m/s) and high (8 m/s) wind
7
speeds for both LBW configurations. The differences between results for the footpath LBW models
8
for different wind speeds ranged from as little as 1%, to a maximum of 17% on the leeward
9
footpaths at a height of 1.76m for H1/H2 ratios of 1.0 and 0.5, respectively. For the central LBW 10
models, the differences were more significant, ranging from 1% to 106% on the leeward footpath for
11
H1/H2 ratios of 1.5 and 0.5, respectively. 12
13
4. Discussion 14
4.1 Asymmetrical Canyon Models 15
The implementation of passive controls in street canyons can significantly increase the dispersion
16
rate of air pollutants and potentially lead to a reduction in pollutant concentrations at street level [19,
17
32]. In this study, both reductions and increases in pollutant concentrations were found on the
18
leeward footpath at both adult and child heights due to the addition of LBWs. The results provided
19
similar evidence to previous investigations that a change in the canyon asymmetrical ratio creates
20
different air flow patterns which effects pollutant dispersion at street level [4, 35]. Fig. 7 illustrates
21
the dispersion patterns in the footpath LBW models for a range of H1/H2 ratios on the leeward 22
footpath. The plots also display the magnitude of the resultant velocity vectors for the tracer gas
23
M
AN
US
CR
IP
T
AC
CE
PT
ED
1.1 (Fig. 7(d)) in the reference and footpath LBW models, with steady concentration reductions
1
from a H1/H2 of 1.1 to 1.5 (Fig. 7(f)) at adult and child heights. The increase of the pollutant 2
concentration on the leeward footpath from a H1/H2 of 0.5 to 1.1 is due to the velocity vectors 3
entering the canyon and transporting additional pollutants to the leeward footpath. The increase of
4
the H1/H2 ratio from 1.1 to 1.5 forces increased volumes of clean air with higher magnitudes of 5
velocity which causes the development of a more prominent primary vortex and transports more
6
pollutants from street to roof level.
7
8
From a calculation of the percentage difference in pollutant concentration between the reference and
9
LBW models, a similar trend was identified between the models as the minimum percentage
10
difference occurred for a H1/H2 of 1.1 with incremental increases in the percentage difference 11
occurring for both smaller and larger H1/H2 ratios. As the H1/H2 ratio increased from 0.5 (Fig. 7(a)) 12
to 0.9 (Fig. 7(c)), a notable change was identified between a H1/H2 of 0.9 and 1.1 (Fig. 7(d)) as the 13
lateral (+Z direction) velocity vectors became less prominent and was replaced by a counter
14
clockwise rotational eddy (in XY plane) in the canyon. Between a H1/H2 ratio of 1.1 (Fig. 7(d)) and 15
1.5 (Fig. 7(f)), it can be observed that the introduction of the LBW reduced the pollutant
16
concentration on the leeward footpath and the velocity vectors became more prominent as they
17
transported an increased fraction of pollutants out of the canyon.
18
19
Fig. 7. Plots of pollutant concentrations (kmol/m3) and magnitudes of velocity vectors for H1/H2 20
ratios from (a) 0.5 to (f) 1.5 in intervals of 0.2 on the leeward footpath of the LBW models.
21
22
Fig. 8 illustrates the dispersion patterns on the windward footpath in the LBW models for H1/H2 23
ratios from 0.5 to 1.5. The pollutant concentrations followed the same patterns in both the reference
M
AN
US
CR
IP
T
AC
CE
PT
ED
and LBW models on the windward footpath, with reduced concentrations for an increasing H1/H2 1
from 0.5 (Fig. 8(a)) to 0.9 (Fig. 8(c)), followed by an increase from a H1/H2 of 0.9 to 1.1 (Fig. 8(d)) 2
and a near linear reduction in the pollutant concentration from a H1/H2 of 1.1 to 1.5 (Fig. 8(f)). The 3
reduction of the pollutant concentration on the windward footpath from a H1/H2 of 0.5 to 0.9 is due 4
to the velocity vectors transporting increased fractions of clean air to the windward footpath. The
5
development of the primary vortex in the canyon caused an increase in the pollutant concentration
6
on the windward footpath between a H1/H2 of 0.9 and 1.1. A reduction in the pollutant concentration 7
occurred between a H1/H2 ratio of 1.1 and 1.5 as the larger windward building height increased the 8
volume of clean air directed downwards towards the windward footpath and increased the
9
effectiveness of the primary vortex to transport pollutants away from the windward footpath.
10
11
The percentage difference in the pollutant concentration between the reference and LBW models
12
identified a reduction in the effectiveness of the LBW from a H1/H2 ratio of 0.5 to 0.8 and a steady 13
improvement of air quality from a H1/H2 of 0.8 to 1.5. A similar change like that observed in the 14
leeward LBW models is evident, as the H1/H2 ratio increases from 0.5 (Fig. 8(a)) to 0.8 and this is 15
evident in the plot for a H1/H2 of 0.9 (Fig. 8(d)) as the lateral (+Z direction) velocity vectors increase 16
in magnitude and direction to counter clockwise rotational vectors (in XY plane). An increased
17
fraction of clean air was directed into the canyon and downward along the face of the windward
18
building between a H1/H2 of 0.9 and 1.5. The clean air entering the canyon combined with the 19
implementation of the LBW incrementally reduced the transport of pollutants to the windward
20
footpath and retained increased fractions of clean air along the footpath.
21
22
Fig. 8. Plots of pollutant concentrations (kmol/m3) and magnitudes of velocity vectors for H1/H2 23
ratios from (a) 0.5 to (f) 1.5 in intervals of 0.2 on the windward footpath of the LBW models.
M
AN
US
CR
IP
T
AC
CE
PT
ED
1
4.2 Footpath and Central LBW Layouts 2
The results from the comparative LBW models provided evidence that the location of the boundary
3
wall can significantly affect the pattern of air flow in and urban street canyon and therefore effect
4
the dispersion of air pollutants at street level. In addition, the results aimed to identify the effect of
5
wind speed on the dispersion patterns of air pollutants in the urban canyons. After comparing the
6
data and the graphical plots of the tracer pollutants in the asymmetrical models, it was identified that
7
two very distinct patterns of air flow occur with different LBW configurations (Fig. 9). A central
8
LBW (Fig. 9(b)) creates two distinctive primary eddies as opposed to a single primary eddy created
9
in a footpath LBWs (Fig. 9(a)) model, and these vortices are responsible for the transport of
10
pollutants from street level to the roof of the canyon.
11
12
Fig. 9. Displays plots of pollutant dispersion in footpath and central LBW models for a H1/H2 ratio 13
of 1.0 for high (8 m/s) perpendicular wind conditions (pollutant concentrations in kmol/m3).
14
15
The reduction in pollutant concentrations differs between the two LBW configurations, but a general
16
trend of improved air quality is evident with an increase in the H1/H2 ratio. The reduction in the 17
pollutant concentration in the central LBW models generally exceeds the reduction in the
18
counterpart footpath LBW models. This is due to the formation of two eddies (Fig. 9(b)) in the
19
central LBW models as the H1/H2 ratio increases as pollutants are transported away from both the 20
leeward and windward footpaths before escaping the street canyon at roof level. On the leeward
21
footpath, there is a reduction in the pollutant concentration of up to 50% and an increase in the
22
transport of clean air with an increase in the H1/H2 in both LBW layouts. A reduction is more 23
prominent for the central LBW models. Reductions of approximately 24% and 17% are evident for
M
AN
US
CR
IP
T
AC
CE
PT
ED
both LBW models between H1/H2 ratios of 1.0 to 1.5 at heights of 1.00m and 1.76m, respectively. 1
This is due to an increased fraction of clean air transported into the canyon for increasing H1/H2 2
ratios, improving the magnitude and formation of primary eddies in the canyon and transporting
3
pollutant away from the leeward footpath (Fig. 9(b)). There is a large and consistent reduction in the
4
pollutants concentration of the windward footpath. The results show evidence of the lowest
5
reduction for a H1/H2 of 1.0 (36% to 42%) for all LBW configurations with small increases in the 6
rate of reduction for a H1/H2 of 0.5 (40% to 50%) and the most significant reduction (48% to 64%) 7
evident for a H1/H2 ratio of 1.5. 8
9
Examining the lower wind speed models, a broader range of percentage differences was identified
10
between the reference models and the two LBW model configurations. The most notable difference
11
in pollutant concentration between the model configurations was evident on the leeward footpath
12
with a canyon H1/H2 ratio of 0.5. A significant increase of 91% was calculated for the central LBW 13
model, due to less clean air entering the canyon and the reduced wind velocity entering downwards
14
on the windward footpath, which reduces the strength of the primary vortex and thus trap pollutants
15
in the leeward region of the canyon. This agrees with the findings by a previous study, which stated
16
that vortices are unstable in low wind speeds [36]. As the H1/H2 ratio is increased to 1.0 and 1.5, 17
reductions in the pollutant concentration become more prominent with reductions reaching up to
18
31% and 53% for their respective asymmetrical ratios. A consistent reduction in the pollutant
19
concentration was evident in all models of the windward footpath for a wind speed of 2 m/s. The
20
results ranged from a minimum reduction of 32% to a maximum of 61%. The lowest reduction
21
occurred for a H1/H2 of 1.0, with reductions ranging from 32% to 38%. Reductions of between 44% 22
and 59% were identified for a H1/H2 of 0.5 (44% to 59%) with the most significant reductions 23
M
AN
US
CR
IP
T
AC
CE
PT
ED
1
Fig. 10 illustrates the difference in the dispersion flow patterns and the pollutant concentration at
2
street level in the street canyons for a H1/H2 of 1.0 in different wind speeds. Differences in the 3
pollutant concentration are evident after comparing each of the model configurations at different
4
wind speeds. The concentration is higher at street level for a low wind speed of 2 m/s than a high
5
wind speed of 8 m/s in each of the model configurations. This identifies the influence of wind speed
6
on pollutant dispersion and the strength of the vortices created which transport pollutants out of the
7
street canyon.
8
9
Fig. 10. Displays plots of pollutant dispersion in footpath and central LBW models for a H1/H2 ratio 10
of 1.0 for (a) high (8 m/s) and (b) low (2 m/s) wind velocities (pollutant concentrations in kmol/m3).
11
12
5. Conclusions 13
The results of this investigation identified the potential of LBW passive controls acting as a baffle in
14
asymmetrical street canyons to control pollutant flow and improve air quality at street level. The
15
implementation of footpath LBWs can lead to both increases and reductions in the pollutant
16
concentration along the centre of the leeward and windward footpaths, depending on the
17
asymmetrical H1/H2 ratio of the canyon. From the results of the footpath LBW models, the 18
percentage difference in the pollutant concentration ranged from an increase of 19% to a reduction
19
of 30% for different H1/H2 asymmetrical ratios on the leeward footpath. Reductions in the pollutant 20
concentration were calculated between 26% and 50% on the windward footpath.
21
22
The results for the central LBW case were also compared to the findings from the asymmetrical
23
modelling reference case. The results identified two air flow and pollutant dispersion patterns; one
M
AN
US
CR
IP
T
AC
CE
PT
ED
primary vortex was created in the footpath LBW models, while two distinctive primary vortices
1
develop in the central LBW models. The results show that central LBW performs better for all
2
H1/H2 ratios for a high wind speed of 8 m/s. Results for both LBW configurations identified the 3
reduction in strength of the vortices for a low wind speed, specifically the lack of development of
4
one of the vortices in the central LBW model for a H1/H2 ratio of 0.5. Low wind speeds can 5
therefore reduce the fraction of pollutants that are transported from street level to roof level due to
6
the lack of development of the primary vortices.
7
8
The results of this paper informs those in urban planning and public policy makers on local street
9
canyon dispersion and the effects of introducing passive controls to urban canyons to improve air
10
quality at street level.
11
12
Acknowledgements 13
The authors would like to thank the programme for research and training in third level institutions
14
(PRTLI 4) for funding this research.
15
16
17
18
19
20
21
22
23
M
AN
US
CR
IP
T
AC
CE
PT
ED
References 1 21. Ghenu, A., J.M. Rosant, and J.F. Sini, Dispersion of pollutants and estimation of emissions
3
in a street canyon in Rouen, France. Environmental Modelling & Software, 2008. 23(3): p.
4
314-321.
5
2. Vardoulakis, S., et al., Operational air pollution modelling in the UK--Street canyon
6
applications and challenges. Atmospheric Environment, 2007. 41(22): p. 4622-4637.
7
3. United Nations, World Urbanization Prospects: The 2009 Revision, 2009, United Nations:
8
New York.
9
4. So, E.S.P., A.T.Y. Chan, and A.Y.T. Wong, Large-eddy simulations of wind flow and
10
pollutant dispersion in a street canyon. Atmospheric Environment, 2005. 39(20): p.
3573-11
3582.
12
5. Li, X.-X., C.-H. Liu, and D.Y.C. Leung, Large-eddy simulation of flow field and pollutant
13
transport inside urban street canyons with high aspect ratios, in Seventh Symposium on the 14
Urban Environment2007: AMS, San Diego, California (2007). 15
6. Mirzaei, P.A. and F. Haghighat, Approaches to Study Urban Heat Island - Abilities and
16
Limitations. Building and Environment, 2010. 45(10): p. 2192-2201.
17
7. Jicha, M., J. Pospisil, and J. Katolicky, Dispersion of Pollutants in Street Canyon under
18
Traffic Induced Flow and Turbulence. Environmental Monitoring and Assessment, 2000. 19
65(1): p. 343-351.
20
8. Pospisil, J., J. Katolicky, and M. Jicha, A comparison of measurements and CFD model
21
predictions for pollutant dispersion in cities. Science of The Total Environment, 2004. 334-22
335: p. 185-195.
23
9. Xie, X., Z. Huang, and J.-s. Wang, Impact of building configuration on air quality in street
24
canyon. Atmospheric Environment, 2005. 39(25): p. 4519-4530.
25
10. Solazzo, E., X. Cai, and S. Vardoulakis, Modelling wind flow and vehicle-induced
26
turbulence in urban streets. Atmospheric Environment, 2008. 42(20): p. 4918-4931.
27
11. Wang, X. and K.F. McNamara, Effects of street orientation on dispersion at or near urban
28
street intersections. Journal of Wind Engineering and Industrial Aerodynamics, 2007. 95
(9-29
11): p. 1526-1540.
30
12. Yassin, M., R. Kellnerová, and Z. Jaňour, Numerical simulation on pollutant dispersion from
31
vehicle exhaust in street configurations. Environmental Monitoring and Assessment, 2009. 32
156(1): p. 257-273.
33
13. Santiago, J.L. and F. Martín, SLP-2D: A new Lagrangian particle model to simulate
34
pollutant dispersion in street canyons. Atmospheric Environment, 2008. 42(17): p.
3927-35
3936.
36
14. Giuliano, M., et al., Effects of low concentrations of benzene on human lung cells in vitro.
37
Toxicology Letters, 2009. 188(2): p. 130-136.
38
15. Oke, T.R., Street design and urban canopy layer climate. Energy and Buildings, 1988. 11
(1-39
3): p. 103-113.
40
16. Chan, A.T., E.S.P. So, and S.C. Samad, Strategic guidelines for street canyon geometry to
41
achieve sustainable street air quality. Atmospheric Environment, 2001. 35(32): p.
5681-42
5691.
M
AN
US
CR
IP
T
AC
CE
PT
ED
17. McNabola, A., New Directions: Passive control of personal air pollution exposure from
1
traffic emissions in urban street canyons. Atmospheric Environment, 2010. 44(24): p.
2940-2
2941.
3
18. McNabola, A., B.M. Broderick, and L.W. Gill, Reduced exposure to air pollution on the
4
boardwalk in Dublin, Ireland. Measurement and prediction. Environment International, 5
2008. 34(1): p. 86-93.
6
19. Buccolieri, R., et al., Aerodynamic effects of trees on pollutant concentration in street
7
canyons. Science of The Total Environment, 2009. 407(19): p. 5247-5256.
8
20. Gallagher, J., L.W. Gill, and A. McNabola, Optimizing the use of on-street car parking
9
system as a passive control of air pollution exposure in street canyons by large eddy 10
simulation. Atmospheric Environment, 2011. 45(9): p. 1684-1694.
11
21. Finn, D., et al., Tracer studies to characterize the effects of roadside noise barriers on
near-12
road pollutant dispersion under varying atmospheric stability conditions. Atmospheric 13
Environment, 2010. 44(2): p. 204-214.
14
22. Ning, Z., et al., Impact of roadside noise barriers on particle size distributions and
15
pollutants concentrations near freeways. Atmospheric Environment, 2010. 44(26): p.
3118-16
3127.
17
23. Baldauf, R., et al., Impacts of noise barriers on near-road air quality. Atmospheric
18
Environment, 2008. 42(32): p. 7502-7507.
19
24. Gromke, C., et al., Dispersion study in a street canyon with tree planting by means of wind
20
tunnel and numerical investigations - Evaluation of CFD data with experimental data. 21
Atmospheric Environment, 2008. 42(37): p. 8640-8650.
22
25. Fluent. Fluent 6.3. 2008 [cited 2011 September]; Available from: http://www.fluent.com/.
23
26. Tsai, M.Y. and K.S. Chen, Measurements and three-dimensional modeling of air pollutant
24
dispersion in an Urban Street Canyon. Atmospheric Environment, 2004. 38(35): p.
5911-25
5924.
26
27. Ning, Z., et al., Experimental and numerical study of the dispersion of motor vehicle
27
pollutants under idle condition. Atmospheric Environment, 2005. 39(40): p. 7880-7893.
28
28. Hu, L.H., R. Huo, and D. Yang, Large eddy simulation of fire-induced buoyancy driven
29
plume dispersion in an urban street canyon under perpendicular wind flow. Journal of 30
Hazardous Materials, 2009. 166(1): p. 394-406.
31
29. Kondo, H., et al., Attempt to make Guideline to use CFD Model for Atmospheric
32
Environmental Assessment in Urban Area in Japan, in The seventh International Conference 33
on Urban Climate2009, ICUC-7: Yokohama, Japan. 34
30. Environmental Protection Agency, Air Quality in Ireland 2009 - Key Indicators of Ambient
35
Air Quality, 2010, Environmental Protection Agency: Wexford. 36
31. ENCom, Proposal for a Council Directive on passenger car related taxes. , 2005,
37
Commission of the European Communities.
38
32. McNabola, A., B.M. Broderick, and L.W. Gill, A numerical investigation of the impact of
39
low boundary walls on pedestrian exposure to air pollutants in urban street canyons. 40
Science of The Total Environment, 2009. 407(2): p. 760-769.
41
33. Franke, J., et al., Best Practice Guideline for the CFD Simulation of Flows in the Urban
42
Environment. COST Action 732, 2007: COST Office, Brussels. 43
34. Tominaga, Y., et al., AIJ guidelines for practical applications of CFD to pedestrian wind
44
environment around buildings. Journal of Wind Engineering and Industrial Aerodynamics, 45
2008. 96(10-11): p. 1749-1761.
M
AN
US
CR
IP
T
AC
CE
PT
ED
35. Crowther, J.M. and A.G.A.A. Hassan, Three-Dimensional Numerical Simulation of Air
1
Pollutant Dispersion in Street Canyons. Water, Air, & Soil Pollution: Focus, 2002. 2
2(5): p. 279-295.
3
36. Qin, Y. and S.C. Kot, Dispersion of vehicular emission in street canyons, Guangzhou City,
4
South China (P.R.C.). Atmospheric Environment. Part B. Urban Atmosphere, 1993. 27(3): p.
5
283-291.
6 7
List of Figures 8
[image:24.612.42.545.52.695.2]9
Fig. 1. Cross section of three-dimensional asymmetrical canyon models (a) 0.5 H1/H2 with two 10
footpath LBWs and (b) 1.5 H1/H2 with one central LBW. 11
12
Fig. 2. Determining the percentage difference in the pollutant concentration achieved by comparing
13
a LBW model to the reference model on the windward footpath.
14
15
Fig. 3. Leeward and windward footpath concentrations of tracer gas for models with varying mesh
16
discretization schemes.
17
18
Fig. 4. Leeward and windward footpath concentration of tracer gas for models with varying
19
extension height above rooftop.
20
21
Fig. 5. Plot of average percentage pollutant concentration on leeward footpath in different H1/H2 22
ratio canyons at respective heights.
23
24
Fig. 6. Plot of average percentage pollutant concentration on windward footpath in different H1/H2 25
ratio canyons at respective heights.
26
M
AN
US
CR
IP
T
AC
CE
[image:25.612.55.548.26.718.2]PT
ED
Fig. 7. Plots of pollutant concentrations (kmol/m3) and magnitudes of velocity vectors for H1/H2 1
ratios from (a) 0.5 to (f) 1.5 in intervals of 0.2 on the leeward footpath of the LBW models.
2
3
Fig. 8. Plots of pollutant concentrations (kmol/m3) and magnitudes of velocity vectors for H1/H2 4
ratios from (a) 0.5 to (f) 1.5 in intervals of 0.2 on the windward footpath of the LBW models.
5
6
Fig. 9. Displays plots of pollutant dispersion in footpath and central LBW models for a H1/H2 ratio 7
of 1.0 for high (8 m/s) perpendicular wind conditions (pollutant concentrations in kmol/m3).
8
9
Fig. 10. Displays pollutant dispersion plots of footpath and central LBWs for a H1/H2 ratio of 1.0 for 10
(a) high (8 m/s) and (b) low (2 m/s) wind velocities (pollutant concentrations in kmol/m3).
11
12
13
14
15
16
17
18
19
20
21
22
23
M
AN
US
CR
IP
T
AC
CE
PT
ED
1
2
3
List of Tables 4
5
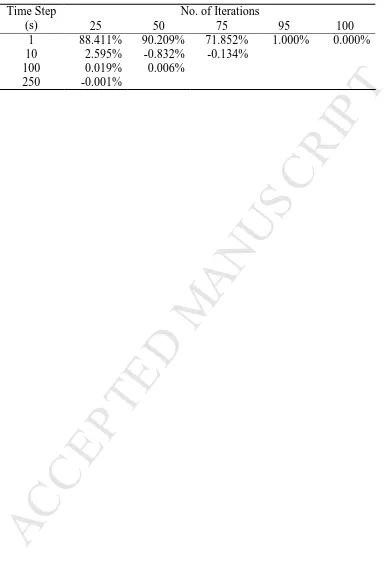
Table 1. Iteration per time step test to optimise model computational running times (displayed as
6
percentage of value of iteration divided by value of final iteration).
7
8
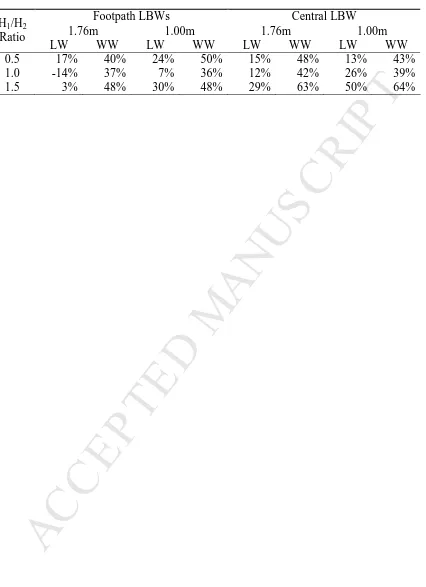
Table 2. Percentage difference of reference model to footpath and central LBW models for a high (8
9
m/s) wind speed in a perpendicular direction to street canyon.
10
[image:26.612.43.561.71.624.2]11
Table 3. Percentage difference of reference model to footpath and central LBW models for a low (2
12
m/s) wind speed in a perpendicular direction to street canyon.
[image:26.612.141.306.416.631.2]M
AN
US
CR
IP
T
AC
CE
PT
ED
Research Highlights
• Canyon asymmetry influences air flow and pollutant dispersion in an urban canyon.
• LBWs acts as a passive control to alter the natural air flow patterns in a canyon.
• Two different passive control layouts led to distinct vortex and air flow patterns.
M
AN
US
CR
IP
T
AC
CE
[image:28.612.126.511.80.658.2]PT
ED
Table 1
No. of Iterations Time Step
(s) 25 50 75 95 100
1 88.411% 90.209% 71.852% 1.000% 0.000%
10 2.595% -0.832% -0.134%
100 0.019% 0.006%
M
AN
US
CR
IP
T
AC
CE
[image:29.612.108.534.75.662.2]PT
ED
Table 2
Footpath LBWs Central LBW
1.76m 1.00m 1.76m 1.00m
H1/H2 Ratio
LW WW LW WW LW WW LW WW
0.5 17% 40% 24% 50% 15% 48% 13% 43%
1.0 -14% 37% 7% 36% 12% 42% 26% 39%
M
AN
US
CR
IP
T
AC
CE
[image:30.612.107.534.75.663.2]PT
ED
Table 3
Footpath LBWs Central LBW
1.76m 1.00m 1.76m 1.00m
H1/H2 Ratio
LW WW LW WW LW WW LW WW
0.5 -1% 59% 12% 44% -91% 59% -92% 47%
1.0 -13% 34% 16% 38% 18% 37% 31% 32%