Beef cattle have been introduced into the Czech Republic only recently. The first evaluation of breeding results was processed and published for the period 1991–1997 (Stádník et al., 1999). Since 2000, breeding values (BVs) have been routinely predicted using a multiple-trait animal model with maternal effects for the results of the field test (calving difficulty, birth weight, weight at 120, 210, and 365 days) (Přibyl et al., 2003). In 2004, the prediction of BVs for bulls’ own growth perform-ance at test stations was introduced using a single-trait animal model (Pribylova et al., 2004). Finally, a multiple-trait animal model for the prediction of
BVs for type traits was launched in 2005 (Veselá et al., 2005). Šafus et al. (2006) constructed three selection indexes for bulls of beef cattle. Vostrý et al. (2008) predicted the genetic parameters and the heterosis effect on growth traits in crossbred cattle and Vostrý et al. (2009) predicted geno-type × environment interaction in Czech beef cat-tle. Kamieniecki et al. (2009) detected a significant effect of sire breed on the growth and carcass per-formance of progeny. Simultaneously, possibilities of the carcass quality classification on live animals were evaluated by Stádník et al. (2009). And, sub-sequently, the prediction of carcass quality BVs is
Supported by the Ministry of Education, Youth, and Sports of the Czech Republic (Project No. MSM 6046070901) and by the Ministry of Agriculture of the Czech Republic (Project No. MZE 0002701404).
Stability of Aberdeen Angus breeding values
in the Czech Republic from 1997 to 2007
J. Ducháček
1, J. Přibyl
2, L. Stádník
1, L. Vostrý
1,2, J. Beran
1, L. Štolc
11Czech University of Life Sciences Prague, Faculty of Agrobiology, Food and Natural Resources, Department of Animal Husbandry, Prague, Czech Republic
2Institute of Animal Science, Prague-Uhříněves, Czech Republic
ABSTRACT: We predict the stability of breeding values (BVs) for direct effect (DE) and maternal effect (ME) for live weights at 210 days of age in the entire population of purebred Aberdeen Angus cattle in the Czech Republic according to an increase of progeny number in performance recording over a period of 11 years (1997 to 2007) and the course of BVs for DE and ME during the years of observation in animals born until 1997. Furthermore we compare genetic trends of BVs for DE and ME among animals born in different years and detect the level and significance of correlation coefficients among predictions of BVs for DE and ME performed during the years of observation. The animal model and the BLUPF90 programme were used for these predictions. The used model included the effects of animal, sex, contemporary group, dam, age of dam, and permanent environment of dam. The variance of BVs ranged from 4.96 to 10.87 depending on the year of evaluation and whether it was related to maternal or direct genetic effect. The animals were initially assigned to groups according to their BV in 1997, and this ranking was not affected by the BVs predicted in subsequent years. The existence of a negative correlation between direct and maternal effects was confirmed. The significant correlations (P < 0.0001) demonstrated a strong relationship between the BVs predicted in successive years, e.g. the correlation coefficient for the relationship between BVs for direct effect predicted in the last years of the examined period was above 0.9 and that for maternal effect was above 0.8.
an integral part of beef cattle breeding. Therefore they are soon to be introduced as routinely de-termined values (Veselá, 2010). Meat quality and nutrient profile as an additional trait of carcass value in cattle (Bartoň et al., 2010; Węglarz, 2010), pigs (Bečková and Václavková, 2010; Rybarczyk et al., 2011), chickens (Straková et al., 2010), and/or sheep and lambs (Kaczor et al., 2010; Xu et al., 2011) is currently studied as well. Animals with high functional longevity and economic weights for functional traits are required (Krupová et al., 2009; Zavadilová et al., 2009). A number of authors investigated economic weights for different traits in other farm animals (Houška et al., 2010). However, similar studies performed in beef cattle are neces-sary in the future and the growth ability is con-stantly a basic performance trait.
The BV prediction in beef cattle is affected by a number of factors. The two most important and most frequently indicated genetic factors are the BVs for direct effect (DE) and maternal effect (ME) (Vostrý et al., 2009). Young beef animals are often selected for breeding only on the basis of their own growth performance and the performance of their half-siblings. Therefore, their BVs obtained at the time of selection have only low reliabilities. Genetically evaluated sires with high reliabilities of BVs are used much less frequently. The relationship between real and predicted BVs was examined by Postma (2006), who analysed different aspects associated with the prediction of BVs in cattle, their effect on the popu-lation and subsequent genetic trends.
Breeding efforts result in breed improvement expressed by genetic gain, in the consequence of which younger animals are genetically superior to older animals born in previous years. Therefore, it is necessary to upgrade BVs continually on the basis of comparisons with younger animals (Přibyl et al., 2002).
The correlations between BVs predicted during a certain period of animal’s life ranged between 0.71 and 0.90 and depended on the trait evalu-ated and the time span. Repeevalu-ated prediction only slightly changed the rank of the best sires. Changes occurred only within the group of animals with similar BVs (above average), and thus the stability of predictions over time was demonstrated (Přibyl et al., 2002). An important factor influencing BVs is the negative genetic correlation between DE and ME. The maternal BV can be negative, if a high BV for DE is based on own growth performance records (Schaeffer, 2002).
Genetic trends and genetic parameters for differ-ent traits of dairy cows were predicted in a number of previous reports and various discrepancies in BV prediction were detected (Cañon and Muñoz, 1991; Banos et al., 1992, Němcová et al., 2011; Ptak et al. 2011; Zavadilová et al., 2011).
To test the stability of BVs and to validate the ge-netic trend in dairy cattle, three different methods were developed (Boichard et al., 1995). These meth-ods differed in the number of traits or lactations evaluated, and in the requirement for the access to raw production data, i.e. official evaluation results, which are restrictedly, usually publicly available and can be accessed by anyone. Lee and Freeman (1985) used regression techniques to determine the trends in yearly averages of cow indexes and predicted differences of bulls’ BVs for production traits. The stability rate of BVs can be expressed using the cor-relation coefficient.
However, these analyses have not been per-formed in beef cattle in the Czech Republic yet. Based on this fact, the prediction of the course and reliability of BVs in Aberdeen Angus cattle is suitable for precision evaluation of performance and next orientation of beef selection and breed-ing. We hypothesized, according to results detected on the other production types of cattle, that the significant trend of breeding values predicted in particular years will be determined in relation to a higher number of progeny, that the stability of BVs predicted in 1997 will be confirmed during the subsequent years, that the genetic trends of DE and ME will confirm expected relationships between these BVs, and that the significant cor-relation coefficients will be detected among the years evaluated.
MATERIAL AND METHODS
BVs for live weight at 210 days in the complete population of purebred Aberdeen Angus cattle were predicted using the database of the Czech Beef Breeders Association (CSCHMS, 2009).
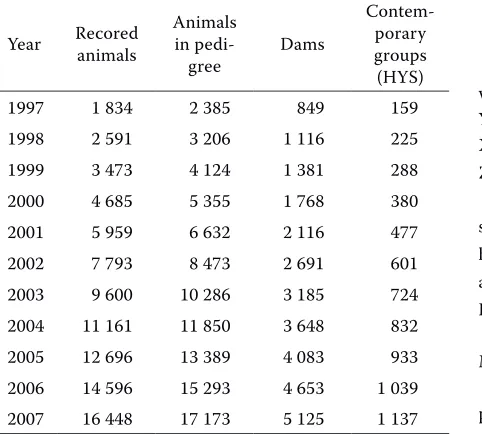
A total of 11 subsets of cumulatively increasing size were formed from the database according to the date of prediction (from 1997 to 2007). The used datasets differed in the number of animals in the pedigree, which cumulatively increased from 2385 to 17 173 over the years analysed. This was accompanied by increasing numbers of dams and contemporary groups (HYS). However, in accord-ance with changes in the entire Aberdeen Angus population which increased because of large im-ports of purebred animals, the progeny of dams with one contemporary only was deleted from the data set before prediction. Therefore the size of the contemporary groups varied from 2 to 26. The number of levels was the same for the effects of dam and permanent environment of dam. The numbers of levels for different effects in the model used are presented in Table 1.
Processing of the data set was performed using SAS (2004) with SORT, FREQ, and MEANS proce-dures. The entire cumulative database including data from previous years was estimated each year and the predictions were performed using the BLUPF290 programme (Misztal et al., 2002). The necessary
variances and co-variances for direct and maternal effects were adopted from a report by Přibyl et al. (2003) and used in data processing for the entire period estimated. This step enables to predict a nega-tive correlation between direct and maternal effects (Schaeffer, 2002) on the level r = –0.18. Matrices for the effect of sexwere4 columnsand 1834 to 16 448 rows, depending on the year ofevaluation. Matricesfor the effect ofHYShad159 to 1137 col-umns and1836 to 16 448rows, depending on the year ofevaluation.Matricesfor the effect of ma-ternal agehad 5columns and1836 to 16 448rows, depending on the year ofevaluation.The matrixfor randomeffect of animal had from 1836 to 16448 col-umnsandrows, depending on the year ofevaluation.
The randommatrix of dam’s effect had from 849 to 5125columns and1836 to 16 448 rows, depending
on the year ofevaluation. The random matrixof the effect of dam’s permanentenvironmenthad the same dimensions as thematrixfor therandomeffectof dam. Subsequently, BVs in different years were de-termined using the animal model. The BVs predicted by the BLUPF290 programme were consequently analysed using the SAS (2004) procedures SORT, FREQ, MEANS, and CORR.
Linear animal model
BVs were predicted using the BLUP-AM method with maternal effects and correlations between di-rect and maternal effects. The model used was as follows:
Y = X1sex + X2 hys + X3age + Z DE + W ME + S ped + e
where:
Y = weight at 210 days of age
X1,X2, X3 = experimental design matrices for fixed effects
Z, W, S = design matrices for the effects of animal, dam and permanent environment of dam
sex = vector of fixed effects of sex
hys = vector of fixed effects of contemporary groups age = vector of fixed effects of dam age
DE = vector of random effects of animals for direct genetic effect
ME = vector of random effects of animals for maternal genetic effect
ped = vector of random effects of permanent environ-ment of dam
[image:3.604.66.307.520.737.2]e = residual effect (error) Table 1. Number of animals included in evaluation in
different years
Year Recored animals Animals in
pedi-gree Dams
Contem-porary groups (HYS)
1997 1 834 2 385 849 159
1998 2 591 3 206 1 116 225
1999 3 473 4 124 1 381 288
2000 4 685 5 355 1 768 380
2001 5 959 6 632 2 116 477
2002 7 793 8 473 2 691 601
2003 9 600 10 286 3 185 724
2004 11 161 11 850 3 648 832
2005 12 696 13 389 4 083 933
2006 14 596 15 293 4 653 1 039
2007 16 448 17 173 5 125 1 137
The prediction results were analysed as fol-lows:
(1) Correlations between BVs for the same animal from successive years of evaluation were deter-mined.
(2) Differences in BVs between different birth years of animals were predicted.
(3) The following groups of bulls and cows were formed according to their BVs in 1997 and in accordance with the size of the particular groups:
Bulls: Group 1 – BV below 3 kg; Group 2 – BV 3 to 4 kg; Group 3 – BV 4 to 11 kg; Group 4 – BV above 11 kg.
Cows: Group 1 – BV below 4 kg; Group 2 – BV 4 to 8 kg; Group 3 – BV above 8 kg.
Then the development of BVs in different years of prediction was compared within and between groups (mainly convergence and divergence from
average BVs). The numbers in different groups of bulls and cows are shown in Table 2.
RESULTS AND DISCUSSION
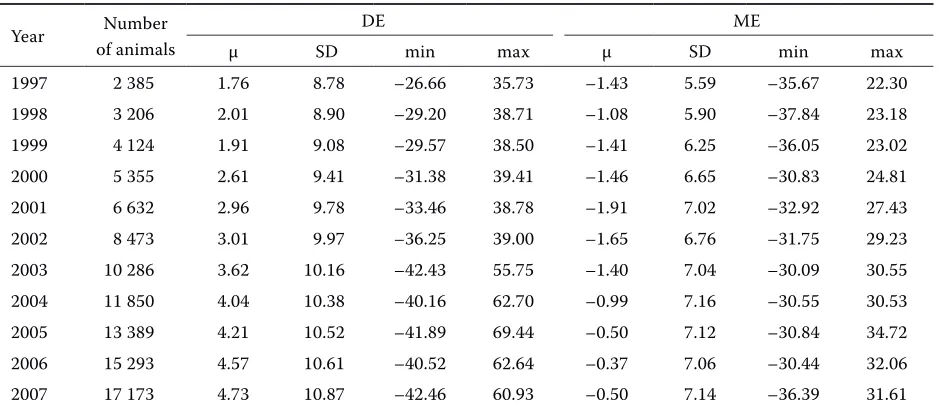
[image:4.604.69.546.100.205.2]Database involving all animals available Table 3 presents descriptive statistics of BVs [number of animals, mean BV (μ), standard devia-tion (SD), extreme BVs (min and max)] for direct (DE) and maternal (ME) effects. Over time, average BVs for DE increased as well as the range of BVs within a year. The variability expressed by standard deviations also slightly increased, indicating that the reliability of BVs was elevated with time. A more moderate ten-dency and also a lower variability were observed for ME. Similarly like DE, the variability increased over years as the size of the used database increased. The Table 2. Numbers of evaluations in accordance with breeding value in 1997
Group Bulls Cows
BV (kg) DE ME BV (kg) DE ME
1 < –3 263 245 < –4 312 401
2 –3 to 4 239 569 –4 to 8 960 1056
3 4 to 11 201 55 > 8 243 57
4 > 11 168 2
[image:4.604.73.543.533.737.2]BV = breeding value, DE = direct effect, ME = maternal effect
Table 3. Mean breeding values for direct and maternal effects over years
Year Number
of animals
DE ME
μ SD min max μ SD min max
1997 2 385 1.76 8.78 –26.66 35.73 –1.43 5.59 –35.67 22.30
1998 3 206 2.01 8.90 –29.20 38.71 –1.08 5.90 –37.84 23.18
1999 4 124 1.91 9.08 –29.57 38.50 –1.41 6.25 –36.05 23.02
2000 5 355 2.61 9.41 –31.38 39.41 –1.46 6.65 –30.83 24.81
2001 6 632 2.96 9.78 –33.46 38.78 –1.91 7.02 –32.92 27.43
2002 8 473 3.01 9.97 –36.25 39.00 –1.65 6.76 –31.75 29.23
2003 10 286 3.62 10.16 –42.43 55.75 –1.40 7.04 –30.09 30.55
2004 11 850 4.04 10.38 –40.16 62.70 –0.99 7.16 –30.55 30.53
2005 13 389 4.21 10.52 –41.89 69.44 –0.50 7.12 –30.84 34.72
2006 15 293 4.57 10.61 –40.52 62.64 –0.37 7.06 –30.44 32.06
2007 17 173 4.73 10.87 –42.46 60.93 –0.50 7.14 –36.39 31.61
comparison of average BVs for DE and ME predicted over years demonstrated that the increased number of available animals resulted in the increased values of DE. The continually increasing BVs for DE indicated that younger generations of animals were genetically superior. This improvement is much smaller for ME due to the preferential selection of breeding bulls ac-cording to DE at the expense of ME, as can be seen in the breeding programme for Aberdeen Angus (CSCHMS, 2009). In addition, this result is also as-sociated with a negative genetic correlation between DE and ME (Grotheer et al., 1997; Schaeffer, 2002).
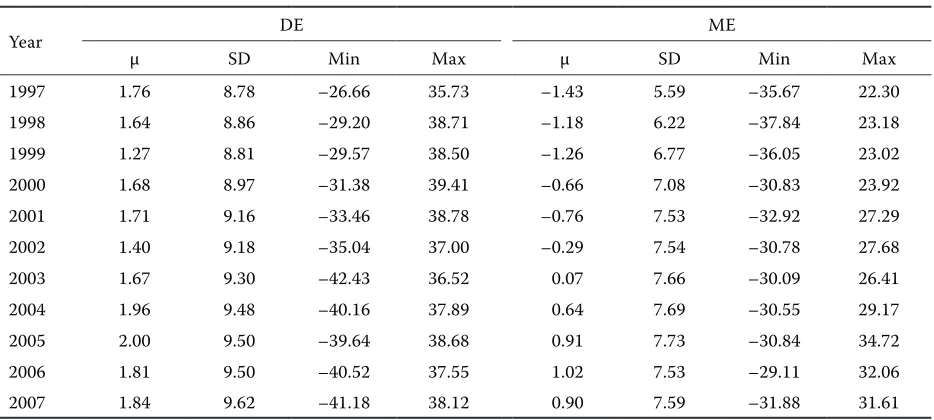
Average BVs for DE over years in animals born until 1997 are given in Table 4. The dataset in-cluded all animals born until the end of 1997 (n = 2385). The results indicate that the inclusion of new information did not result in any significant
[image:5.604.66.533.99.309.2]changes in variability and average BVs, but the re-liability of BV prediction increased. The develop-ment of BVs for DE over time was compared in all available animals and in animals born until 1997 (Tables 3 and 4). The difference is obvious and demonstrates the importance of breeding, since younger animals are on average superior to older generations due to positive selection (Přibyl et al., 2002). This comparison also confirms the stability of BVs estimated in 1997, as the BVs of animals born until 1997 remain similar in successive years of evaluation. Strabel et al. (2001) compared the reliabilities obtained from the inversion matrix for single-trait and multi-trait models. The correla-tions predicted for weaning weight were 0.94 for DE and 0.98 for ME. The reliability predicted and error covariances computed either by a multi-trait model
Table 4. Evolution of breeding values for direct and maternal effects over years in animals born until 1997 (n = 2385)
Year DE ME
μ SD Min Max μ SD Min Max
1997 1.76 8.78 –26.66 35.73 –1.43 5.59 –35.67 22.30
1998 1.64 8.86 –29.20 38.71 –1.18 6.22 –37.84 23.18
1999 1.27 8.81 –29.57 38.50 –1.26 6.77 –36.05 23.02
2000 1.68 8.97 –31.38 39.41 –0.66 7.08 –30.83 23.92
2001 1.71 9.16 –33.46 38.78 –0.76 7.53 –32.92 27.29
2002 1.40 9.18 –35.04 37.00 –0.29 7.54 –30.78 27.68
2003 1.67 9.30 –42.43 36.52 0.07 7.66 –30.09 26.41
2004 1.96 9.48 –40.16 37.89 0.64 7.69 –30.55 29.17
2005 2.00 9.50 –39.64 38.68 0.91 7.73 –30.84 34.72
2006 1.81 9.50 –40.52 37.55 1.02 7.53 –29.11 32.06
2007 1.84 9.62 –41.18 38.12 0.90 7.59 –31.88 31.61
DE = direct effect, ME = maternal effect, µ = mean of breeding value, SD = standard deviation
Figure 1. Comparison of genetic trends of breeding values (BV) for direct effect among animals born in different years
–0.4 0.1 0.6 1.1 1.6
BV
19
97
BV
19
98
BV
19
99
BV
20
00
BV
20
01
BV
20
02
BV
20
03
BV
20
04
BV
20
05
BV
20
06
BV
20
[image:5.604.69.409.593.758.2]or by a random regression model in beef cattle was also investigated (Tier and Meyer, 2004). Powell et al. (1977) already observed an increasing genetic trend for BV prediction as a result of successfully applied breeding methods. Similarly to our results, they also encountered the variation of BVs or even their slight decrease over several years.
The increasing genetic trend in beef cattle is cur-rently associated mainly with the improvement of animal evaluation, introduction of new breeding ap-proaches and methods of BV prediction (DeGroot et al., 2007). Average BVs for DE in animals born in different years are shown in Figure 1. The BVs were predicted for the latest possible year. The variation of BVs predicted in 2007 depended on the number of animals born in a given year. If a linear curve were applied to the data, a slightly decreasing trend would be obvious.
Average BVs for ME in animals born until 1997 are presented in Table 4. A total of 2385 animals were included in the dataset. There is a slight but quite clear increase of average BVs. The difference
between the trends of BVs for ME predicted for all available animals and for animals born until 1997 is demonstrated in Tables 3 and 4. In the first three years, these trends were quite similar. In subse-quent years, however, the BVs for ME predicted for animals born until 1997 increased more rap-idly compared to the BVs predicted in all avail-able animals, and the differences between the BVs of both groups gradually became constant. These differences were caused by the preferentially used selection for DE at the expense of ME, which are negatively correlated with each other (Schaeffer, 2002). More intensive selection for DE results in improved growth traits, but due to the existing negative correlation, the economically important maternal characteristics may deteriorate.
[image:6.604.75.433.77.252.2]When all animals were included, standard devia-tions of BVs for DE and ME ranged from 8.78 to 10.87 and from 5.59 to 7.16, respectively. When only animals born in 1997 were evaluated, standard deviations of BVs for DE and ME ranged from 8.78 to 9.62 and from 5.59 to 7.59, respectively. It is evident Figure 2. Comparison of genetic trends of breeding values (BV) for maternal effect among ani-mals born in different years
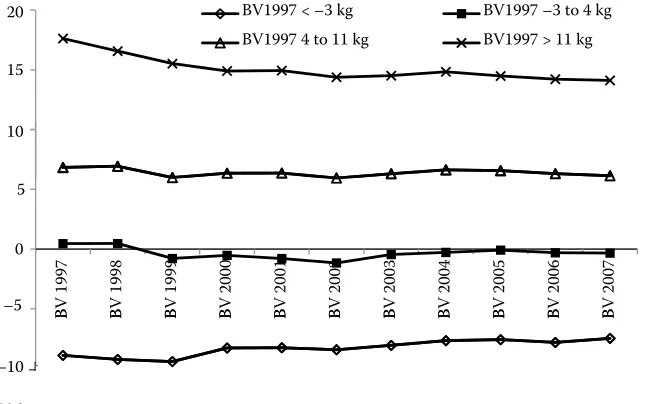
Figure 3. The evolution of breed-ing values (BV) for direct effect of bull groups with different breed-ing value estimated in 1997 –0.4
0.1 BV
19
97
BV
19
98
BV
19
99
BV
20
00
BV
20
01
BV
20
02
BV
20
03
BV
20
04
BV
20
05
BV
20
06
BV
20
07
–1.4 –0.9
10 15
20 BV1997 < –3 kg BV1997 –3 to 4 kg
BV1997 4 to 11 kg BV1997 > 11 kg
–5 0 5
BV
1
99
7
BV
1
99
8
BV
1
99
9
BV
2
00
0
BV
2
00
1
BV
2
00
2
BV
2
00
3
BV
2
00
4
BV
2
00
5
BV
2
00
6
BV
2
00
7
–10
[image:6.604.76.399.570.772.2]that the rate of within-year variation was different neither for DE nor for ME. Greater variation for DE was, however, observed between different years of evaluation. Mrode and Swanson (1996), Carlén et al. (2004) and Wolf et al. (2010) also reported variations of genetic parameters and Liu and Reents (2000) or Samoré et al. (2008) explained significant differ-ences in relation to populations, statistical models and estimation methods.
The animals born until 1997 had higher average BVs for ME compared to the total average. This was probably due to lower BVs for ME in younger animals. With respect to ME, younger animals fell below average, while older animals were superior, both according to the increase of BVs for DE.
Average BVs for ME in animals born in different years are shown in Figure 2. The BVs were predicted for the latest possible year. The average BVs for ME were relatively high at the beginning and at the end of the evaluated period compared to the years in the
middle of the period. The year of evaluation had a significant effect on the variation of BVs. The trend shown in Figure 2 can be explained by a slightly increased focus on the selection for maternal char-acteristics, or by a lower preference for DE in the breeding plan. It also confirms the efficiency of the selection currently applied within the population of Aberdeen Angus (CSCHMS, 2009).
Evaluation of animals grouped according to their BVs and sex
[image:7.604.69.396.86.267.2]The animals born until 1997 were divided into groups according to their BVs and sex. Higher range and standard deviations of BVs were recorded in bulls, and therefore they were assigned to four groups, while cows only to three groups. This al-location was necessary to obtain balanced groups with similar animal numbers.
Figure 4. The evolution of breeding values (BV) for maternal effect of bull groups with different breeding value estimated in 1997
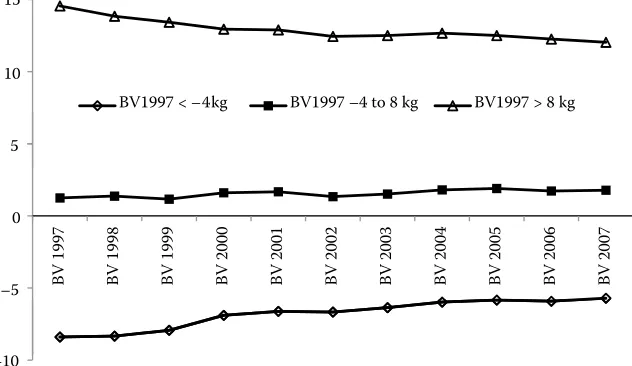
Figure 5. The development of breed-ing value (BV) for direct effect of cow groups with different breeding value estimated in 1997
10
15 BV1997 < –3 kg BV1997 –3 to 4 kg
BV1997 4 to 11 kg BV1997 > 11 kg
–5 0 5
BV
1
99
7
BV
1
99
8
BV
1
99
9
BV
2
00
0
BV
2
00
1
BV
2
00
2
BV
2
00
3
BV
2
00
4
BV
2
00
5
BV
2
00
6
BV
2
00
7
–10
5 10 15
BV1997 < –4kg BV1997 –4 to 8 kg BV1997 > 8 kg
–5 0
BV
1
99
7
BV
1
99
8
BV
1
99
9
BV
2
00
0
BV
2
00
1
BV
2
00
2
BV
2
00
3
BV
2
00
4
BV
2
00
5
BV
2
00
6
BV
2
00
7
[image:7.604.70.386.573.756.2]A high stability of BV averages within individual groups was observed. This means that the group of below average animals in 1997 was also below aver-age in the successive evaluations. Similarly, animals above average in 1997 were also above average in the following years. The development of BVs for DE of bull groups with different BVs predicted from 1997 is demonstrated in Figure 3. There was a certain vari-ation within the groups, but the level of each group remained generally constant. The average BVs for DE of the examined groups tended to converge slightly. This fact can be explained by the prediction of BVs over time and by the increasing size of the database used for BV prediction. The development of BVs for ME of bulls born until 1997 is shown in Figure 4. The tendency towards the convergence of average BVs was more explicit. It was related to a lower reliability
of BVs for ME. The two best groups of bulls even switched their order in 2006 and 2007.
The average BVs of cows born until 1997 for DE and ME are shown in Figures 5 and 6, respectively. A high stability of BVs is demonstrated by these figures. Thus, animals with low BVs in 1997 remained below average also in successive predictions. Again, the variation increased over time in accordance with findings of Liu and Reents (2000) or Samoré et al. (2008).
[image:8.604.77.398.84.270.2]The stability of BVs particularly for ME was high-er in cows compared to bulls (Figure 4 vs. Figure 6) as a biological consequence of the expression of maternal effect in females. Lassen et al. (2007) applied three different models for a modelling of genetic gain for the maternal effect of milk produc-tion over 16 years and recommended using more complicated multi-trait models.
Figure 6. The development of bree-ding values (BV) for maternal effect of cow groups with different breeding value estimated in 1997
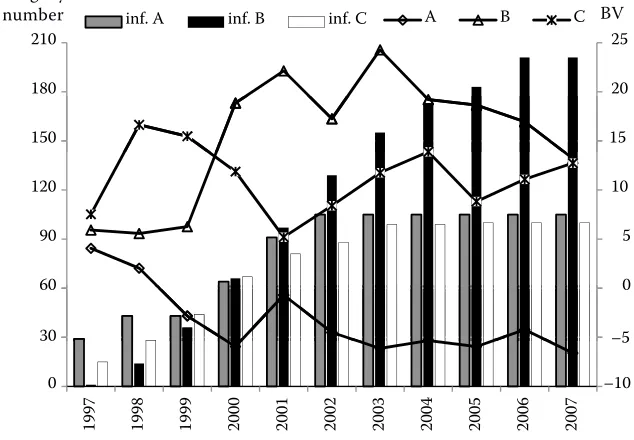
Figure 7. Breeding values (BV) for direct effect in selected bulls (A–C) as affected by the amount of information (inf.A–inf.C) 5
10 15
BV1997 < –4 kg BV1997 –4 to 8 kg BV1997 > 8 kg
–5 0 5
BV
1
99
7
BV
1
99
8
BV
1
99
9
BV
2
00
0
BV
2
00
1
BV
2
00
2
BV
2
00
3
BV
2
00
4
BV
2
00
5
BV
2
00
6
BV
2
00
7
–10
15 20 25
150 180
210 inf. A inf. B inf. C A B C
0 5 10
30 60 90 120
–10 –5
0
19
97
19
98
19
99
20
00
20
01
20
02
20
03
20
04
20
05
20
06
20
07
Progeny
[image:8.604.74.391.542.762.2]The relationship between the amount of data and BVs
The analysis revealed the existence of a relation-ship between BVs and the amount of data on the in-dividual performance of animals and the number of progeny. Figure 7 illustrates the development of BVs for DE in several bulls from 1997 to 2007. The bulls were ranked according to their BVs from the worst to the best animal. Figure 7 shows both BVs pre-dicted in each year for each animal and the amount of information in each year for each animal. Thus, for each of the 3 selected bulls 3 BVs and 3 values
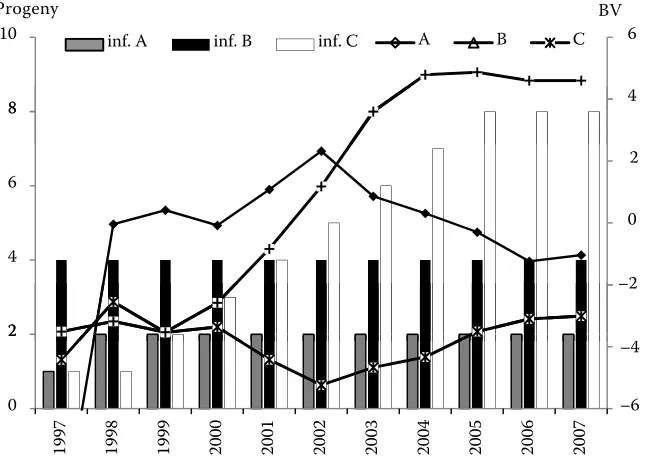
describing the amount of information are shown. The values for the amount of information were pre-dicted from the number of progeny and their own performance records. A similar analysis was also performed for BVs for ME of cows (Figure 8).
[image:9.604.67.390.88.319.2]The BVs for ME of selected cows tended to in-crease less rapidly over time. This was due to the amount of information for each cow in different years. It was evident from the comparison in Figure 7 and Figure 8 that the increasing size of the data-base and the growing amount of information had a more pronounced effect on cows, i.e. on animals with little available information. These findings Figure 8. Breeding values for maternal effect in selected cows (A–C) as affected by the amount of information (inf. A–inf. C)
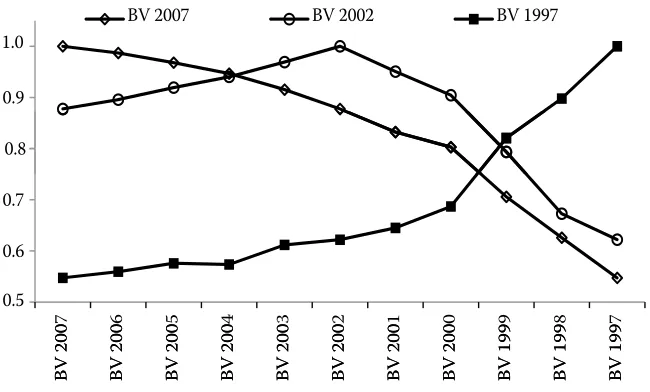
Figure 9. Correlations between breeding values (BV) for direct effect estimated in 1997, 2002, and 2007 in animals born till
1997 (n = 2385)
4 6 8 10 –2 0 2 2 4 6 8 –6 –4 0 2 19 97 19 98 19 99 20 00 20 01 20 02 20 03 20 04 20 05 20 06 20 07
inf. A inf. B inf. C A B C
Progeny BV
0.95 1.00
1.05 BV 2007 BV 2002 BV 1997
[image:9.604.68.390.572.757.2]agree with results of Přibyl et al. (2002) or Cañon and Muñoz (1991).
Relationships between BVs in different years of evaluation
In the animals born in 1997, correlation coef-ficients were predicted for their BVs predicted in different years. The correlations of BVs for DE from 1997 to 2007 are shown in Figure 9. All the corre-lations were high (r = 0.73–0.99) (P < 0.0001), and they slightly decreased with the increasing period between the years of evaluation. Correlation coef-ficients above 0.9 (P < 0.0001) were predicted for the relationship between the BVs for DE predicted over the period from 2000 to 2007. In most predictions, tendencies changed to a certain extent in 2000. The correlations between the values predicted before and after 2000 were somewhat lower, but they were above 0.7 (P < 0.0001). This threshold point was probably associated with the increasing reliabil-ity of BVs and the increasing size of the database due to the expansion of beef cattle breeds by 1997 (CMSCH, 2010) and the larger-scale introduction of beef performance recording. The highest correla-tions were determined between the adjacent years of evaluation, and they declined with the increasing period between the years of evaluation.
The correlations of BVs for ME for the animals born after 1997 are shown in Figure 10. The tenden-cies were similar to those for DE, but the correlation coefficients were lower due to lower reliabilities of BVs for ME (Schaeffer, 2002).
CONCLUSION
The increased number of Aberdeen Angus ani-mals included in performance recording in the Czech Republic resulted in increased values of BV for DE for live weights at 210 days of age and this improvement is much smaller for BV for ME due to the preferential selection of breeding bulls ac-cording to DE at the expense of ME.
A high reliability of BV averages within the par-ticular groups was observed when the group of be-low- and/or above-average animals in 1997 was also below and/or above average in the following years. The BVs particularly for DE remain approximately similar over time in different groups of animals as well as in the individual animals. The BVs for ME converge more in the groups of both bulls and cows. In spite of that, it is concluded that over the period examined the accuracy of average BVs im-proved, and only small changes between animal groups were observed. This corresponds with the predicted correlation coefficients for the last years of evaluation, which were above 0.8 (P < 0.0001).
[image:10.604.75.400.85.281.2]With respect to our results describing BVs for DE, younger animals are genetically superior to the older ones. In contrast, younger animals are infe-rior compared to the older ones in BVs for ME. This may result from the selection pressure currently applied in Aberdeen Angus in the Czech Republic when DE is given priority to ME. Prediction re-sults confirmed the negative correlation between DE and ME. This was apparent from some of the trends for DE and ME depicted in the tables with mutually opposite trends. These findings could be Figure 10. Correlations between breeding values (BV) for maternal effect estimated for 1997, 2002, and 2007 in the animals born until
1997 (n = 2385)
0.9 1.0
BV 2007 BV 2002 BV 1997
0.5 0.6 0.7 0.8
BV
2
00
7
BV
2
00
6
BV
2
00
5
BV
2
00
4
BV
2
00
3
BV
2
00
2
BV
2
00
1
BV
2
00
0
BV
1
99
9
BV
1
99
8
BV
1
99
7
BV
2
00
7
BV
2
00
6
BV
2
00
5
BV
2
00
4
BV
2
00
3
BV
2
00
2
BV
2
00
BV
2
00
0
BV
1
99
9
BV
1
99
8
BV
1
99
used subsequently in a scheme of Aberdeen Angus breeding and selection on the level of herds and population as well.
Acknowledgement
We thank Mrs. Lois Russell for her editorial help with this manuscript.
REFERENCES
Banos G., Wiggans G.R., Robinson J.A.B. (1992): Com-parison of methods to rank bulls across countries. Journal of Dairy Science, 75, 2560–2568.
Bartoň L., Bureš D., Kudrna V. (2010): Meat quality and fatty acid profile of the musculus longissimus lumbo-rum in Czech Fleckvieh, Charolais and Charolais × Czech Fleckvieh bulls fed different types of silages. Czech Journal of Animal Science, 55, 479–487. Bečková R., Václavková E. (2010): The effect of linseed
diet on carcass value traits and fatty acid composition in muscle and fat tissue of fattening pigs. Czech Jour-nal of Animal Science, 55, 313–320.
Boichard D., Bonaiti B., Barbat A., Mattalia S. (1995): Three methods to validate the estimation of genetic trend for dairy cattle. Journal of Dairy Science, 78, 431–437.
Cañon J., Muñoz A. (1991): Genetic trend for milk pro-duction in Spanish Holstein population. Journal of Animal Breeding and Genetics, 108, 41–47.
Carlén E., Strandberg E., Roth A. (2004): Genetic pa-rameters for clinical mastitis, somatic cell score, and production in the first three lactations of Swedish Holstein cows. Journal of Dairy Science, 87, 3062– 3070.
CSCHMS (2009): Czech beef breeders association [serial
online]. Available from www.cschms.cz (accessed Feb
28, 2009).
CMSCH (2010): Czech-Moravian breeders association [serial online]. Available from www.cmsch.cz/cz/
(ac-cessed Aug 24, 2010).
DeGroot B.J., Keown J.F., Van Vleck L.D., Kachman S.D. (2007): Estimates of genetic parameters for Holstein cows for test-day yield traits with a random regression cubic spline model. Genetics and Molecular Research, 6, 434–444.
Grotheer V., Rohe R., Kalm E. (1997): Development of a model for estimation of breeding values for beef
cat-tle in Germany. Züchtungskunde, 69, 349–365. (in
German)
Houška L., Wolfová M., Nagy I., Csörnyei Z., Komlósi I. (2010): Economic values for traits of pigs in Hungary. Czech Journal of Animal Science, 55, 139–148. Kaczor U., Borys B., Pustkowiak H. (2010): Effect of
in-tensive fattening of lambs with forages on the fatty acid profile of intramuscular and subcutaneous fat. Czech Journal of Animal Science, 55, 408–419. Kamieniecki H., Wójcik J., Pilarczyk R., Lachowicz K.,
Sobczak M., Grzesiak W., Błaszcyk P. (2009): Growth and carcass performance of bull calves born from He- reford, Simmental and Charolais cows sired by Car-olais bulls. Czech Journal of Animal Science, 54, 47–54.
Krupová Z., Huba J., Daňo J., Krupa E., Oravcová M., Peškovičová D. (2009): Economic weights of production and funcitional traits in dairy cattle under a direct subsidy
regime. Czech Journal of Animal Science, 54, 249–259.
Lassen J., Sørensen M.K., Madsen P., Ducrocq V. (2007):
A stochastic simulation study on validation of an ap-proximate mulitrait model using preadjusted data for prediction of breeding values. Journal of Dairy Sci-ence, 90, 3002–3011.
Lee K.L., Freeman A.E. (1985): Estimation of genetic change in the registered Holstein cattle population. Journal of Dairy Science, 68, 2629–2638.
Liu Z., Reents R. (2000): Parameter estimates of a random regression test day model for first three lactations so-matic cell scores INTERBULL Bulletin, No. 26, 61–65. Misztal I., Tsuruta S., Strabel T., Auvray B., Druet T., Lee D.
H. (2002): BLUPF90 and related programs (BGF90). In:
7th World Congr. Genetics Applied to Livestock
Produc-tion, Montpellier, France, Communication No. 28–07. Mrode R.A., Swanson G.J.T. (1996): Genetic and
statis-tical properties of somatic cell count and its suitabil-ity as an indirect means of reducing the incidence of mastitis in dairy cattle. Animal Breeding Abstracts, 64, 847–857.
Němcová E., Štípková M., Zavadilová L. (2011): Genetic parameters for linear type traits in Czech Holstein cat-tle. Czech Journal of Animal Science, 56, 157–162. Postma E. (2006): Implications of the difference between
true and predicted breeding values for the study of natural selection and micro-evolution. Journal of Evolutionary Biology, 19, 309–320.
Powell R.L., Norman H.D., Dickinson F.N. (1977): Trends in breeding value and production. Journal of Dairy Science, 60, 1316–1326.
Přibyl J., Šeba K., Misztal I., Přibylová J. (2002): Stability
of breeding values for growthin beef cattle. In: 20th
Ge-netic Days, Brno, Czech Republic, 190–192.
Czech Republic. Czech Journal of Animal Science, 48, 519–532.
Přibylová J., Vostrý L., Veselá Z., Přibyl J., Bohmanová J. (2004): Breeding value for own growth of beef bulls in
performance-test station. Animal Science Papers and
Reports,22, 97–103.
Ptak, E., Jagusiak W., Żarnecki A., Otwinowska-Mindur A. (2011): Heritabilities and genetic correlations of lactational and daily somatic cell score with conforma-tion traits in Polish Holstein cattle. Czech Journal of Animal Science, 56, 205–212
Rybarczyk A., Pietruszka A., Jacyno E., Dvořák J. (2011): Carcass and meat quality traits of pig reciprocal crosses with a share of Pietrain breed. Czech Journal of Animal Science, 56, 47–52.
Šafus P., Přibyl J., Veselá Z., Vostrý, L., Štipková M., Stád-ník L. (2006): Selection indexes for bulls of beef cattle. Czech Journal of Animal Science, 51, 285–298. Samoré A.B., Groen A.F., Boettcher P. J., Jamrozik J.,
Ca-navesi F., Bagnato A. (2008): Genetic correlation pat-terns between somatic cell score and protein yield in the Italian Holstein-Friesian population. Journal of Dairy Science, 91, 4013–4021.
SAS (2004): SAS/STAT® 9.1. User’s Guide. Cary, NC, SAS
Institute Inc. 5121 pp.
Schaeffer L. (2002): Maternal Effects Models, ANSC637 Set 13 [serial online]. Available from www.aps.uoguelph.
ca/~lrs/ANSC637/LRS13/ (accessed Oct 22, 2008).
Stádník, L., Louda, F., Dvořák, P., Šeba, K., Řehounek, V. (1999): The results of breeding measures within the population of Charolais cattle in the Czech Republic in 1991–1997. Czech Journal of Animal Science, 44, 389–396.
Stádník L., Ježková A., Louda F., Dvořáková J., Štolc, L. (2009): The relationships among lumbar region width, back muscling and musculus longissimus lumborum et thoracis area in Blonde d’Aquitaine bulls and heifers dur-ing reardur-ing period. Archiv für Tierzucht, 52, 243–254. Strabel T., Misztal I., Bertrand J. K. (2001): Approximation
of reliabilities for multiple-trait model with maternal effects. Journal of Animal Science, 79, 833–839. Straková E., Suchý P., Herzig I., Hudečková P., Ivanko Š.
(2010): Variation in fatty acids in chicken meat as a result of a lupin-containing diet. Czech Journal of Animal Science, 55, 75–82.
Tier B., Meyer K. (2004): Approximating prediction error covariances among additive genetic effects within animal in multiple-trait and random regression models. Journal
of Animal Breeding and Genetics, 121, 77–89.
Veselá Z., Přibyl J., Šafus P., Vostrý L., Šeba K., Štolc L. (2005): Breeding value for type traits in beef cattle in the
Czech Republic. Czech Journal of Animal Science, 50,
385–393.
Veselá Z. (2010): Genetics parameters for evaluation car-cass system SEUROP in beef cattle. Our breeding, 8/2010, LXX, 34–35.
Vostrý L., Jakubec V., Schlote W., Bjelka M., Bezdíček J., Majzlík I. (2008):Analysis of population and heterosis effects in crossbred cattle of Czech Fleckvieh and Beef Simmental parentage for growth traits. Archiv für Tier-zucht, 51, 207–215.
Vostrý L., Přibyl J. Schlote W., Veselá Z., Jakubec V., Majzlík I., Mach K. (2009): Estimation of animal × en-vironment interaction in Czech beef cattle. Archiv für Tierzucht, 52, 15–22.
Węglarz A. (2010): Meat quality defined based on pH and colour depending on cattle category and slaughter sea-son. Czech Journal of Animal Science, 55, 548–556. Wolf J., Wolfová M., Štípková, M. (2010): A model for
the genetic evaluation of number of clinical mastitis cases per lactation in Czech Holstein cows. Journal of Dairy Science, 93, 1193–1204.
Xu Q.L., Tang G.W., Zhang Q.L., Huang Y.K., Liu Y.X.,
Quan K., Zhu K.Y., Zhang C.X. (2011): The FABP4 gene
polymorphism is associated with meat tenderness in three Chinese native sheep breeds. Czech Journal of Animal Science, 56, 1–6.
Zavadilová L., Štípková M., Němcová E., Bouška J., Matějíčková J. (2009): Analysis of the phenotypic rela-tionships between type traits and functional survival
in Czech Fleckvieh cows. Czech Journal of Animal
Sci-ence, 54, 521–531.
Zavadilová L., Wolf J., Štípková M., Němcová E., Jamro-zik J. (2011): Genetic parameters for somatic cell score in the first three lactations of Czech Holstein and Fleck-vieh breeds using a random regression model. Czech Journal of Animal Science, 56, 251–260.
Received: 2011–08–03 Accepted after corrections: 2011–09–01
Corresponding Author
Doc. Ing. Luděk Stádník, Ph.D., Czech University of Life Sciences Prague, Faculty of Agrobiology, Food and Natural Resources, Department of Animal Husbandry, Kamýcká 129, 165 21 Prague 6-Suchdol, Czech Republic