Mining Frequent Patterns in
Software Risk Mitigation Factors:
Frequent Pattern-Tree Algorithm Tracing
Muhammad Asif, Member, IAENG, Jamil Ahmed
Abstract—Frequent-Pattern Tree (FP-Tree) algorithm plays a vital role in mining associations, patterns and other data mining related jobs. Currently a software risk mitigation intelligent decision network engine using rule based technique has been designed against software risk factors. A novel idea of finding the associations between different software risk mitigation factors using FP-Tree algorithm has been proposed in this research work. Huge volumes of software risk factors and software risk mitigation factors exist in software development industry. That’s why data mining researchers have been attracted towards it to find something to explore. Software risk mitigation frequent patterns will be helpful for the project managers and software developers to make decisions against the software risk factors.
Index Terms—Data Mining, Association Rules Mining, Frequent-Pattern Tree, Data Mining in Software Engineering, Artificial Intelligence and Data Mining.
I. INTRODUCTION
OFTWARE development industry has been progressing by leaps and bounds. Due to this change software risks are also growing rapidly. Software risk management needs software risk mitigation factors to overcome these risks. This critical problem can be solved by using Artificial Intelligence and Data Mining techniques. Researchers are now focusing on the integration of data mining techniques to populate the knowledge into artificial intelligent systems such as Expert Systems, Knowledge Based Systems and Rule Based Systems etc.
Association Rule mining is one of the promising technique of data mining. Association rule mining was proposed by Agrawal in [2]. Apriori algorithm is one of the upmost significant techniques of association rule mining and it has been adapted in medical billing by Abdullah in [3]. But Apriori algorithm has some disadvantages in large databases [1]. There are two major drawbacks of apriori algorithm. Large number of candidate generation sets and scanning of database again and again have made this algorithm inefficient for pattern matching in large databases [1]. But frequent pattern tree algorithm has the capacity to overcome these disadvantages of apriori algorithm.
Manuscript received July 02, 2014.
Mr. Muhammad Asif is the corresponding author who is a PhD Scholar of Abasyn University, Islamabad, Pakistan. (Phone: +923235133123; fax: +92518438325; e-mail: masifkhan_2055 @yahoo.com, [email protected])
Dr. Jamil Ahmed is the Vice Chancellor of Abasyn University, Islamabad, Pakistan. (email: [email protected], [email protected]).
Frequent–Pattern Tree algorithm, generally known as FP-Tree was first introduced by Han in [1]. This research has focused on the FP-Tree structure to be adopted for finding frequent patterns in software risk mitigation factors. Intelligent software risk mitigation network using rule based technique has been designed by Asif in [5]. Rule Based System has also been proposed by Abdullah in [6] and Asif in [5]. Project managers find it as a decision support system by Asif in [4].
II. TRACING OF FP-TREE ALGORITHM The new proposed work has been embedded in the engine designed by Asif [5] and shown in Fig.1 as dotted rectangle.
Fig.1. An Intelligent Decision Network Engine
S
No
Yes
Prioritized Risk Factors and stored in Working Memory (WM)
Create Relationship of Risks Factors with Risk Mitigation
Enter the Relationships in the form of Rules into Knowledge Base
Start
Rule exists? Input Risk Factors
Select rule(s) in the form of Risk Factors with Mitigation from Knowledge Base
(KB)
Apply Rules with frequent patterns
Generate Risk Mitigation Decision Network
Exit
A modified Rule Based System engine takes input in terms of software risk factors as shown in Fig.1. Knowledge Base (KB) has been searched for existing rules as a relationship of software risk factors and software risk mitigation. If search is successful then it will apply applicable rules and intelligent risk mitigation decision network is generated. If rules are not there then it will focus on the following six steps. 1) Assign priority to the risk factors. 2) Create new associations or relationships of risk mitigations and its factors using probability. 3) Rules have been created and stored in Rule Base or Knowledge Base. 4) Frequent-Pattern Tree algorithm has been embedded for the mining of frequent patterns in KB. 5) Apply rules with frequent patterns. 6) Finally hierarchy of nodes has been created to form an intelligent software risk mitigation network.
For the tracing and illustration of FP-Tree algorithm, Software risk factors and software risk mitigation factors have been taken from Asif [5] and assigned abbreviation accordingly.
Software risk factors such as Lack of resources (LOR), Inappropriate technology (IT), Improper budget (IB), Inappropriate design (ID), Unrealistic deadlines (UD), Personnel hiring (PH), Lack of motivation (LOM), Cultural diversity (CDR), Implementation (IMP), Government factors (GF), Lack of experience of project manager (LOEPM), Improper scope definition (ISD), Improper planning (IP), Understanding problem of developers (UPOD), Understanding problems of customers (UPOC), Higher management decisions (HMD), Improper feasibility report (IF), Market demand obsolete (MDO), Improper marketing techniques (IMT), Size of the project (SOTP).
Software risk mitigation factors such as Clear Idea of the requirements (M1), Proper Feasibility Report making (M2), Requirements Specification (M3), IT Consultants (M4), Proper Communication Channel (M5), Retaining and preservation of Good Employees (M6), Bonuses (M7), Attractive packages (M8), Developers Faithfulness (M9), Proper Team Structure (M10), Proper backup plan (M11), Define Goals and Objectives (M12), Ensure Communications and Milestones (M13), Leadership (M14), Past Experience (M15), Proper use of methodologies and Software process models (M16), Work Unit Culture (M17), On the job and off the job training (M18), Respect and Honour of Employees (M19), Employee Attitude (M20), Employee Skill (M21), Employee Awareness (M22), Continuous Review (M23), Project Scheduling (M24), Prototyping (M25), User Involvement (M26), Use Statistical Methods (M27), Choice of technology after thorough research of available tools and technologies (M28), Human Resource Role (M29), Proper Testing Techniques (M30), Proper Sales Marketing Team (M31), Identification of Success Criteria (M32), Policy Setting and Enforcement (M33), Scrub able requirements (M34), Top Management Commitment (M35), Facilitated Application Specification Technique (M36), Centralization (M37), Intuitive and Creative (M38), Positive behaviour and problem solving skills (M39), Security Checklist and Authentication Process (M40), Set Key Performance Indicator (M41), Stress testing (M42), Regular Updates (M43), Assess Past Communications (M44), Contingency Plan (M45), Trouble
Shooting (M46), Reusability (M47), Project Tracking and Control (M48), Impact Assessment (M49), Consistent Commitment (M50).
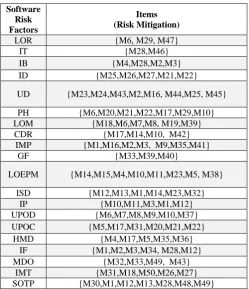
[image:2.595.306.556.204.494.2]The problem statement is the discovery of entire frequent patterns or item sets in the database of Table I. using FP-growth algorithm. Minimum support should be taken as 20%. It can be different but we are taking 20%. Relationships in the form of rules of software risk factors and software risk mitigation items in Table I. have been taken from Asif [5].
TABLE I. MAIN DATABASE
Following are the six steps of FP-tree algorithm for the generation the frequent patterns using Table I.
1. Calculate minimum support
As per given data minimum support is 20%, therefore it has been calculated using the formula given below.
Formula: 20(Minimum Support)/100*20(Items) = 04
Now select those items that have the number of occurrences greater than or equals to four (04). According to the algorithm if minimum support returns the value in a decimal number than ceiling value should be considered. For example, 3.4 => 04, 3.6 => 04, 4.5 => 05etc.
2. Find frequency of occurrence
Frequencies of occurrence of each risk mitigation items from Table I. have been given below in parenthesis. For example, the frequency of occurrence of item ‘M1’ is ‘5’ from Row 1 to Row 20 in Table I.
M1(5), M2(4), M3(4), M4(3), M5(3), M6(4), M7(2),
M8(2), M9(2), M10(5), M11(2), M12(4), M13(2), M14(3), M15(1), M16(2), M17(4), M18(2), M19(1), M20(2), M21(3), M22(3), M23(3), M24(1), M25(2), M26(2), M27(2), M28(4), M29(2), M30(1), M31(2), M32(2),
Software Risk Factors
Items (Risk Mitigation)
LOR {M6, M29, M47}
IT {M28,M46}
IB {M4,M28,M2,M3}
ID {M25,M26,M27,M21,M22}
UD {M23,M24,M43,M2,M16, M44,M25, M45}
PH {M6,M20,M21,M22,M17,M29,M10} LOM {M18,M6,M7,M8, M19,M39}
CDR {M17,M14,M10, M42}
IMP {M1,M16,M2,M3, M9,M35,M41}
GF {M33,M39,M40}
LOEPM {M14,M15,M4,M10,M11,M23,M5, M38}
ISD {M12,M13,M1,M14,M23,M32} IP {M10,M11,M3,M1,M12}
UPOD {M6,M7,M8,M9,M10,M37} UPOC {M5,M17,M31,M20,M21,M22}
HMD {M4,M17,M5,M35,M36} IF {M1,M2,M3,M34, M28,M12}
MDO {M32,M33,M49, M43}
IMT {M31,M18,M50,M26,M27}
M33(2), M34(1), M35(2), M36(1), M37(1), M38(1), M39(2), M40(1), M41(1), M42(1), M43(2), M44(1), M45(1), M46(1), M47(1), M48(1), M49(2), M50(1).
3. Prioritize the items
Items that have minimum support occurrence of 04 have been given below in curly brackets. Priority has been given to the selected items after applying the minimum support. Drop the items that have the frequency that does not meet the count of minimum support. For example, M4: 3, M5: 3, M16: 2, M47: 1 etc.
{M1:5, M10:5, M2:4, M3:4, M6:4, M12:4, M17:4, M28:4}
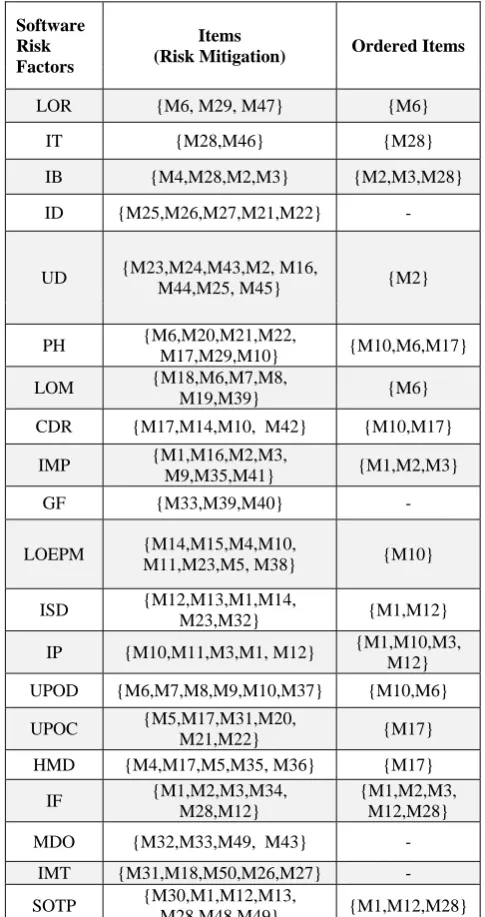
4. Order the items according to the priority
A new column has been added in Table I. named as ‘Ordered Items’. In Table II, Ordered Items column is listed according to priority. Items have been ordered after assigning the priority to the items as given below such as M1 then M10, M2, M3, M6, M12, M17 and M28.
[image:3.595.47.290.325.784.2]{M1, M10, M2, M3, M6, M12, M17, M28}
TABLE II. ORDERED ITEMS
Software Risk Factors
Items
(Risk Mitigation) Ordered Items
LOR {M6, M29, M47} {M6}
IT {M28,M46} {M28}
IB {M4,M28,M2,M3} {M2,M3,M28}
ID {M25,M26,M27,M21,M22} ‐
UD {M23,M24,M43,M2, M16,
M44,M25, M45} {M2}
PH {M6,M20,M21,M22,
M17,M29,M10} {M10,M6,M17}
LOM {M18,M6,M7,M8,
M19,M39} {M6}
CDR {M17,M14,M10, M42} {M10,M17}
IMP {M1,M16,M2,M3,
M9,M35,M41} {M1,M2,M3}
GF {M33,M39,M40} ‐
LOEPM {M14,M15,M4,M10,
M11,M23,M5, M38} {M10}
ISD {M12,M13,M1,M14,
M23,M32} {M1,M12}
IP {M10,M11,M3,M1, M12} {M1,M10,M3, M12}
UPOD {M6,M7,M8,M9,M10,M37} {M10,M6}
UPOC {M5,M17,M31,M20,
M21,M22} {M17}
HMD {M4,M17,M5,M35, M36} {M17}
IF {M1,M2,M3,M34, M28,M12}
{M1,M2,M3, M12,M28}
MDO {M32,M33,M49, M43} ‐
IMT {M31,M18,M50,M26,M27} ‐
SOTP {M30,M1,M12,M13,
M28,M48,M49} {M1,M12,M28}
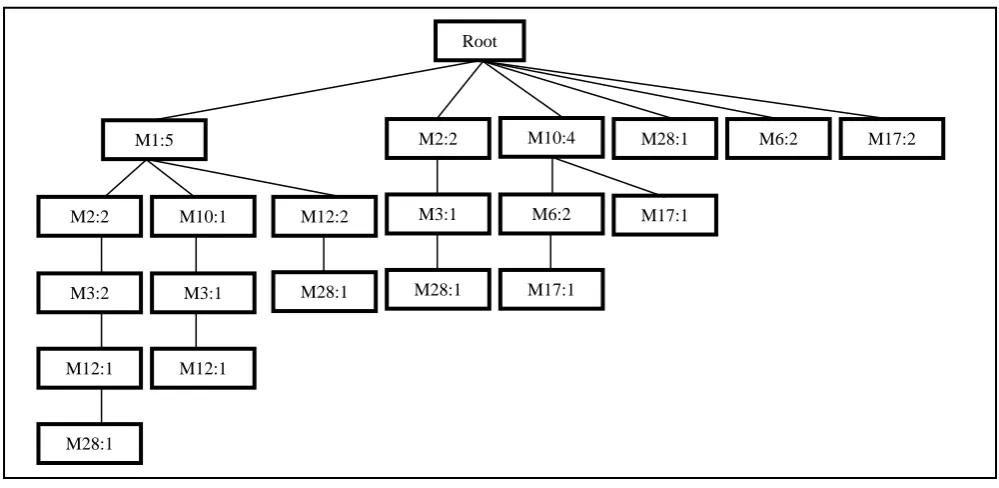
5. Draw the fp-tree
Now we have the ordered items Table II after the execution of above four steps of algorithm. We are in a position to see the construction of a tree row by row. See the row by row execution of Table II in terms of ordered items. All the fp-trees have NULL node as Root node at the start. All other nodes are connected through this node. Every node has the number of occurrences written in front of them. For example, M1:5, M12:2 etc. There is no concept of jumps over the nodes of the tree. You have to travel through node by node and overwrite the count of frequency when you use the nodes again and again. The complete software risk mitigation FP-Tree has been constructed in Fig.2. In association rules consequent of rule is item set such as Antecedent => Consequent. Antecedent is the condition part of the rule and Consequent is the action part of the rule.
Row 1: M6:1
LOR {M6}
Row 2: M28:1
IT {M28}
Row 3: M2:1, M3:1, M28:1
IB {M2,M3,M28}
Row 4: Empty
ID ‐
Row 5: M2:2
UD {M2}
Row 6: M10:1, M6:1, M17:1
PH {M10,M6,M17}
Row 7: M6:2
LOM {M6}
Row 8: M10:2, M17:1
CDR {M10,M17}
Row 9: M1:1, M2:1, M3:1
IMP {M1,M2,M3}
Row 10: Empty
GF ‐
Row 11: M10:3
LOEPM {M10}
Row 12: M1:2, M12:1
ISD {M1,M12}
Row 13: M1:3, M10:1, M3:1, M12:1
IP {M1,M10,M3, M12}
Row 14: M10:4, M6:2
UPOD {M10,M6}
Row 15: M17:1
UPOC {M17}
Row 16: M17:2
HMD {M17}
Row 17: M1:4, M2:2, M3:3, M12:1, M28:1
IF {M1,M2,M3, M12,M28}
Row 18: Empty
MDO ‐
Row 19: Empty
IMT ‐
Row 20: M1:5, M12:2, M28:1
Fig. 2: Software Risk Mitigation FP-Tree
6. Validation
Validation should take place at the last step of the algorithm. For the accomplishment of this task, count the number of occurrences of each node in the FP-tree and then match the result with subsection 3 of section II. If both the frequencies are equal in numbers then the tree is correct otherwise it is incorrect. There are three steps of Fp-Tree. A) Construct a conditional Pattern Base. B) Construct conditional FP-Tree. C) Recursively mine conditional Fp-Tree and generate Frequent Pattern.
A) Conditional Pattern Base:
a. For M28: {(M1M2M3M12:1), (M1M12:1), (M2M3:1)}
b. For M17: {(M10M6:1), (M10:1)}
c. For M12: {(M1M2M3:2), (M1M10M3:1), (M1:1)}
d. For M6: {(M10:2)}
e. For M3: {(M1M2:2), (M1M10:1), (M2:1)}
f. For M2: {(M1:2)}
g. For M10: Empty
h. For M1: Empty
B) Conditional Fp-Tree: a. For M28: Empty
b. For M17: Empty
c. For M12: {(M1:4)} d. For M6: Empty e. For M3: Empty f. For M2: Empty
g. For M10: Empty
h. For M1: Empty
C) Frequent Pattern: a. For M28: Empty
b. For M17: Empty
c. For M12: {(M1M12:4)}
d. For M6: Empty e. For M3: Empty f. For M2: Empty
g. For M10: Empty
h. For M1: Empty
III. RESULTS
(M1M12) is the resultant frequent pattern generated after using Fp-Tree algorithm on the given dataset. M1 is the “Clear Idea of the requirements” and M12 is “Define Goals and Objectives”. We have also figure out the other two dependencies using this algorithm. These dependencies are given below.
i) Software risk mitigation dependency
Following are the software risk mitigations dependencies against software risk factors. These dependencies of ordered items of risk mitigations and risk factors have been taken from Table II of section II.
a)
b)
c)
d)
Root
M2:2 M6:2
M28:1
M10:4
M1:5 M28:1
M12:1
M3:2 M28:1
M6:2 M17:2
M17:1
M10:1 M3:1
M28:1
M12:1 M3:1
M2:2
M12:2 M17:1
M1
IMP
ISD
IF
SOTP IP
M2
IB
UD
IF IMP
M3
IB
IMP
IF IP
M6
LOR
PH
e)
f)
g)
h)
ii) Software risk factors dependency
Following are the software risk factors dependencies against software risk mitigations. These dependencies of risk factors and ordered items of risk mitigations have been taken from Table II of section II.
a)
b)
c)
d)
e)
f)
g)
h)
i)
j)
k)
l)
m)
n)
o)
p) M10
PH
CDR
IP
UPOD LOEPM
M12
ISD
IP
SOTP IF
M17
PH
CDR
HMD UPOC
M28
IT
IB
SOTP IF
LOM M6
M6
M17
M10 PH
M6
M10 UPOD
LOR
M6
IT M28
M28
M3
M2 IB
IF
M28
M3
M2
M12
M1
M3
M2
M1 IMP
IP
M3
M10
M12
M1
UPOC M17
HMD
M17
UD M2
LOEPM M10
M1
M12 ISD
M1
M12
M28 SOTP
M17
IV. DISCUSSION AND CONCLUSION
FP-Tree algorithm has been widely used for finding associations or frequent patterns. This research work has been focused on the adaptation of FP-Tree algorithm of data mining. The novelty behind this work is the introduction of data mining technique in the field of software engineering. During the development of software, software risks are creating problems for software developers and software project managers. The software risks are obvious in nature and the main problem area is the handling or mitigation of them. Software development industry has been suffering from it. To overcome this problem we have proposed to use data mining in this area. Better results have been found in terms of frequent-patterns of software risk mitigation factors after the adaptation of FP-Tree in section II. There are many advantages that allowed us to adapt this technique. Firstly, it generates a quite smaller tree than the original database. Secondly, it reduces the cost of heavy and frequent database scans. Thirdly, there is no concept of candidate generation. Fourthly, divide-and-conquer method decomposes the large tasks into smaller sub tasks. Therefore artificial intelligence and data mining techniques can bring about dramatic results in software engineering or software development field. These frequent pattern rules are beneficial for software project managers and software developers because they are directly responsible for software project success and failure.
ACKNOWLEDGMENTS
I acknowledge the encouragement and firm support of my parents (Mr. & Mrs. Sher Afzal) during this research work. I also acknowledge the support and encouragement of Dr. Jamil Ahmed Vice Chancellor Abasyn University, Pakistan.
REFERENCES
[1] Han, J., Pei, J., and Yin, Y. “Mining Frequent Patterns without Candidate Generation”, ACM SIGMOD 2000, Dallas, TX, U. S. A. 148, 149, 155.
[2] R. Agrawal, T. Imielinski, and A. N. Swami. “Mining association rules between sets of items in large databases”, In Peter Buneman and Sushil Jajodia, editors, Proceedings of the 1993 ACM SIGMOD Intl. Conference on Management of Data, pages 207–216, Washington, D.C., 26–28 1993.
[3] Abdullah, U., Ahmed, J., and Ahmed, A. 2008. “Analysis of effectiveness of apriori algorithm in medical billing data mining”, Proceedings of 4th IEEE International Conference on Emerging Technologies, Rawalpindi, Pakistan. pp 327-331, DOI: 10.1109/ICET.2008.4777523.
[4] Asif, M., Sawar, J. and Abdullah, U. “Design of Decision Support System in Electronic Medical Record Using Structured Query Language”, International Conference of Management and Artificial Intelligence, Bangkok, Thailand, April 8-9. DOI:10.7763/IPEDR.V63.3 2013.
[5] Asif, M., Ahmed, J. and Hannan, A. “Software Risk Factors: A Survey and Software Risk Mitigation Intelligent Decision Network Using Rule Based Technique”, An International Conference on Artificial Intelligence and Applications, The International MultiConference of Engineers and Computer Scientists (IMECS), IAENG, Hong Kong, March 12-14, Vol. I, pp 25-39, 2014.