1
Journal of the Statistical and Social Inquiry Society of Ireland Vol. XL
From Data to Policy Analysis: Tax-Benefit Modelling using SILC 2008
Tim Callan, Claire Keane, John R. Walsh, and Marguerita Lane
Economic and Social Research Institute
(read before the Society, 30 September 2010)
Abstract: Tax-benefit models are used to explore alternative policy reforms, providing evidence which
can guide policy choices. A database representing the national situation in terms of the income tax base and beneficiaries of social welfare schemes is critically important for such models. This paper describes how the database for SWITCH, the ESRI tax-benefit model, has been constructed from the CSO's 2008 Survey on Income and Living Conditions (SILC). The validation of the model database with respect to a range of external sources, and procedures used to adjust the database with respect to recent or anticipated changes are also discussed.
Keywords: Tax benefit models, income tax, databases, policy analysis JELs:C81, H23, H24, I32, I38
1. INTRODUCTION
Policy makers and the body politic have a strong interest in ensuring that the tax transfer system functions well. This common interest in policies that are efficient in achieving their objectives – including economic efficiency and fairness – is heightened by the scarcity of resources during the current crisis. The effects of tax and welfare policy changes are wide-ranging and complex, varying with the characteristics of individuals and their family and household situation. Changes in income tax and social welfare can alter the distribution of income and the incidence of poverty (whether measured in terms of income alone (“risk of poverty”) or in terms of income and material deprivation (consistent poverty)). Tax and welfare changes can also have significant impacts on financial incentives to work, potentially affecting decisions about labour market participation and hours of work.
Tax-benefit models have been widely used as tools for the analysis of potential policy reforms – (for a recent review see Bourguignon and Spadaro, 2009). Microsimulation modelling has been widely used in the UK and the US for many years in order to explore policy choices and the impact of potential or actual policy changes. In Ireland, a tax-benefit model was developed at the ESRI to undertake a similar role. The SWITCH model (Simulating Welfare and Income Tax CHanges) was initially based on the ESRI’s 1987 Survey of Income Distribution, Poverty and Usage of State Services, and later was re-based to use data from the Living in Ireland Surveys. In more recent years, the model has been redeveloped to use data from the CSO’s Survey on Income and Living Conditions (SILC) – first based on data for the year 2005, and now based on the most recent year currently available, 2008.
2
2. MODELLING TAX AND WELFARE POLICY OPTIONS
Very often policy changes are considered in terms of their effects on a number of “hypothetical families”. This approach has severe limitations. For example, less than one family in 20 falls into the category of “one-earner couple with 2 children” which attracts so much attention at budget time. Furthermore families within this category differ in terms of income, housing tenure, and other characteristics that affect their tax-benefit position. More fundamentally, analysis of hypothetical families - no matter how well chosen - simply cannot give an overall picture of the impact of a policy change on incomes and work incentives.
Up until 2007 SWITCH was based on data from the Living in Ireland (LII) Surveys. In 2007 the model was rebased using data from the 2005 wave of the CSO’s Survey on Income and Living Conditions (SILC). One advantage of the SILC data over that of the LII is the size of the sample interviewed, with the SILC sample size being about 50% greater than that for the earlier surveys. By the final year of the LII Survey (2001) the sample size stood at 2,865 households with 6,518 individuals. The 2005 wave of SILC consisted of 6,085 households with 15,539 individuals. The current model has been rebased using data from the 2008 SILC containing households with 12,551 individuals.
It is not currently feasible to update the model with the most recent data available each year due to time and financial constraints. Therefore, for the purpose of budgetary analysis, these data are adjusted and uprated to represent the situation in the current budgetary year. Even if it were possible to update the data in the model annually there would always be a need to adjust and uprate the data as data is never available for the current year. As the model is based on a large-scale nationally representative sample of households this ensures that the model represents as fully as possible the great diversity of household circumstances relevant to tax and social welfare.
At the heart of the SWITCH package is a suite of programs that simulate the disposable income each family would obtain under the current set of income tax and social welfare policies, and under an alternative policy of interest. The results are tabulated to show the patterns of gains and losses over the income distribution, or by family type, and to give an indication of the incidence of relative income poverty. The policy change under consideration could be a simple change in one tax rate; or a complex programme of tax and welfare reform. The model is used each year to assess the impact of the budget. The model can be used to explore long-term packages of reforms, and then examine alternative paths towards the selected long-term objective.
As well as evaluating possible and actual policy changes SWITCH can be used to examine counterfactual situations, specifically the computation of replacement rates and marginal tax rates.
3. DATA REQUIREMENTS
Simulating the welfare entitlements and income tax liabilities of a given individual or family requires quite detailed information on a wide range of variables, including
• ages of family members • marital status
• family and household composition • labour force status of the individual
• detailed information on the components of income received by the individual and his or her spouse/partner
• information on mortgage interest payments and other housing costs
Much of the required information is gathered by SILC as part of the process of measuring disposable income, for the purposes of measuring indicators of poverty and social exclusion.
3
The CSO’s SILC forms part of a set of harmonized surveys used by Eurostat to analyse issues relating to poverty, social inclusion and other issues. The income concept adopted at European level is measured in annual terms. e.g., total employee and self employed income received during the last year etc. As a result, annual incomes are the core concern of the Irish implementation of SILC. While there are good reasons to be interested in this measure of income, it is not a suitable measure for the purpose of simulating welfare entitlement. In order to be able to analyse policy changes, it is essential to be able to simulate welfare entitlements both under the current system and under the proposed reforms. Welfare entitlements depend in the main on current income and labour market status. In the transition from the use of the Living in Ireland surveys to SILC for purposes of monitoring poverty in Ireland, CSO included a number of questions designed to ensure that the Irish version of SILC would capture key elements of the current income measure as well as annual income. Further detail on specific issues related to current income will be given in the next section: in what follows here we give a flavour of some of the issues involved.
Given the need to simulate current entitlements, it is clear that annual income measures would not suffice. Think, for example, of a person who was in employment, became unemployed and received Jobseeker’s Benefit. The individual might then have returned to work, or been transferred to Jobseeker’s Assistance before ultimately returning to work. But when simulating the individual’s welfare entitlement, we would need to take into account his or her current situation and income. In order to do this, we construct variables relating to current employment, current income and current receipt of social welfare benefits, based on the additional detail now available in SILC 2008.
Therefore, we need to construct variables such as the current wage and current receipt of each of the social welfare schemes. This proved difficult to do with the data gathered in SILC 2005, but some key additional variables are included in the Research Microdata File for SILC 2008.1 More generally, the value of the SILC strategy for collection of information on receipt of social welfare benefits must be acknowledged. Respondents to the survey – which is entirely voluntary and dependent on public cooperation – are offered a choice of how to provide information on their receipt of social welfare benefits. They can, in the traditional way, respond directly to a series of questions on welfare benefits. But the vast majority of respondents take up the other option, which is to provide the interviewer with their PPSN (personal public services number) and permission for CSO to use this to obtain the relevant information via the records of the Department of Social Protection. This strategy has a number of benefits:
• For respondents, it reduces the time-cost of cooperating with the survey – and the fact that upwards of 80 per cent of respondents chose this option indicates that this was preferred by most.
• It is an efficient method of data collection, using a pre-existing source.
• It provides high quality information, not distorted by problems of recall or misclassification of benefits.
In our earlier experience with the direct collection of information on welfare receipt (for example, in the Living in Ireland surveys), it was clear that while many individuals gave accurate information, there were some particular benefits where respondents tended to be unclear as to which benefit was received. For example, some widows might claim to be in receipt of an old age pension when in fact they received a widow’s pension. Similarly, there could be confusion as between State Contributory and Non-Contributory Pensions. When the information is provided via the administrative database, such problems are minimised.
4. CONSTRUCTING A MODEL DATABASE FROM SILC
As mentioned in Section 2 family units are created based on the information contained in the SILC survey. The basic unit of analysis in the model is either a tax unit or an income-sharing unit. A tax unit represents a married couple or single person, together with all children aged under 15, and children aged less than 18 who are in full time education. An income sharing unit is a broader family-based concept which also includes students of any age living with their parents. The difference between income-sharing units and tax-sharing units is that third-level students living with their parents are counted as separate tax units, but are included part of the same income-sharing unit as their parents.
4
While tax and welfare policies tend to operate, in the main, at either individual or family unit level, policy also has a keen interest in the outcomes at household level. For example, analysis of those falling below relative income poverty lines or “at risk of poverty” is based on income per adult equivalent at household level, but with each individual (adult or child) counting separately. This is the procedure most often adopted in, for example, the EU Joint Social Inclusion Report and the monitoring poverty reports produced by the ESRI for the DSFA. Similarly, the national measure of “consistent poverty” is one which is defined at household level.
Once tax and income sharing units have been created the model then goes on to simulate tax liabilities and social welfare receipt. For social insurance (contributory) benefits, we model the amount of the payment, which depends on family circumstances including the earnings of a spouse. For social assistance (non-contributory) benefits, the model uses information from the survey to establish whether the individual falls into a category covered by a particular scheme; and then whether the individual is entitled to any payment, based on the means test applicable to that scheme or broad group of schemes. Similarly, information gathered in the survey is used to estimate the income tax liabilities and PRSI contributions for each individual and/or tax unit. As well as simulating income tax and PRSI under existing rules, the model allows for policy reforms, such as the introduction of a Universal Social Charge, to be analysed. (See Callan et al., 2010)
5. CALIBRATION AND VALIDATION
The CSO weighting procedure2 used to create household cross-sectional weights begins with household design weights, which are in inverse proportion to the probability of selection. A further adjustment is made to take account of non-response among longitudinal households, but no such adjustment is made for cross-sectional or “wave 1” households, as substitutions were made for non-responding households. Benchmark information or “control totals” are then used to estimate weights which gross up the data to population estimates. This approach is a well known one internationally, and is part of EUROSTAT’s specification for SILC. Broadly speaking, the weighting estimates are derived finding the smallest adjustment to the weights which ensures that the weighted estimates reproduce the control totals or “benchmarks”. The control totals or benchmarks used by CSO are:
• population estimates by sex and age group (0-14, 15-34, 35-64, 65 and over). These are based on population projections, which draw on Census data.
• Household population estimates at regional level using the eight NUTS3 regions. These are generated from the Quarterly National Household Survey (QNHS)
• Household composition controls (6 categories, depending on numbers of adults and numbers of children) which are also drawn from the QNHS.
These controls help to ensure that SILC is broadly representative of the Irish household population in terms of key demographics (age group, sex, household composition and region). There is, however, no guarantee that this set of controls will ensure that the survey data represent the social welfare client population and/or the income tax base. These are key requirements for a tax-benefit model: the value added by the model will be greatly enhanced if the input database provides a good representation of the welfare client population and the income tax base. In what follows, we explore this issue.
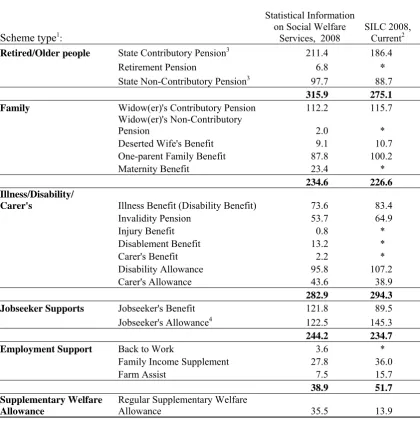
We begin by considering the estimates of the social welfare client population based on SILC with the official statistics on numbers of recipients of social welfare schemes. Table 1 shows the estimated numbers of social welfare recipients by scheme type for 2008. The first column of figures shows the number of recipients by scheme as documented by the Department of Social Protections annual statistical report, Statistical Information on Social Welfare Services (SISWS) for 2008. These figures are based on the numbers in receipt of benefit as at 31 December 2008 (and the same end-December date is used for each year of the report). Thus, they provide a snapshot picture of the welfare population. In order to provide a comparable picture, the second column of figures shows the (grossed-up) number of persons currently in receipt of social welfare benefits as of the date of interview for the SILC. As noted earlier, this involves specially constructed variables for current receipt of benefit; figures on the numbers receiving benefits at some time during the year would not be comparable with the snapshot picture provided by the administrative statistics, though they are of course of interest for other purposes.
2 The description given here is a summary of the information in Appendix 2, Background Notes, of CSO (2009),
5
[image:5.595.90.511.101.523.2]The SILC ‘current’ figures refer to the number of people who state that they are currently in receipt under a particular scheme at the date of interview. The figures are not directly comparable with the end-December figures from SISWS, as the SILC interviews take place throughout the year. Data collection for SILC 2008 began in November 2007 and continued until December 2008. While there are some payments with a seasonal element (e.g., back to school, Christmas bonus and fuel allowance) these do not have a major impact on the comparison. Trends in unemployment have the potential to make a more serious impact, and the differences between unemployment averaged over November 2007 to December 2008, and the end-December figure need to be taken into account in making the comparison.
Table 1: Numbers of recipients by social welfare scheme: Estimates based on SILC 2008 compared with administrative statistics at 31 December 2008
Scheme type1:
Statistical Information on Social Welfare
Services, 2008 SILC 2008, Current2
Retired/Older people State Contributory Pension3 211.4 186.4
Retirement Pension 6.8 *
State Non-Contributory Pension3 97.7 88.7
315.9 275.1
Family Widow(er)'s Contributory Pension 112.2 115.7
Widow(er)'s Non-Contributory
Pension 2.0 *
Deserted Wife's Benefit 9.1 10.7
One-parent Family Benefit 87.8 100.2
Maternity Benefit 23.4 *
234.6 226.6
Illness/Disability/
Carer's Illness Benefit (Disability Benefit) 73.6 83.4
Invalidity Pension 53.7 64.9
Injury Benefit 0.8 *
Disablement Benefit 13.2 *
Carer's Benefit 2.2 *
Disability Allowance 95.8 107.2
Carer's Allowance 43.6 38.9
282.9 294.3
Jobseeker Supports Jobseeker's Benefit 121.8 89.5
Jobseeker's Allowance4 122.5 145.3
244.2 234.7
Employment Support Back to Work 3.6 *
Family Income Supplement 27.8 36.0
Farm Assist 7.5 15.7
38.9 51.7
Supplementary Welfare Allowance
Regular Supplementary Welfare
Allowance 35.5 13.9
1 Figures for Deserted Wife's Allowance, Blind Pension, Health and Safety Benefit, Adoptive Benefit, Guardians Payment Contributory, Guardians Payment Non-Contributory Pension, Part-time Job Incentive Scheme, Back to Enterprise and Back to Education schemes are excluded due to low numbers in the population and hence low or zero numbers in the sample.
2 The weight used in this analysis is the one described in CSO (2009) Survey on Income and Living Conditions (SILC) 2008 i.e, it is based on demographics (4 age groups by sex), household location (8 NUTS3 regions) and household composition.
3 SISWS 2008 figures adjusted to exclude recipients living outside the state, who would be outside the scope of the SILC. (See Table B8 of Statistical Information on Social Welfare Services 2008, category 'other').
6
Here are the key points that emerge from the table:• SILC coverage of each of the groups of schemes is excellent.
• Major schemes within each group of schemes are also well represented. For schemes with more than 40,000 recipients, the coverage ratio (numbers estimated from SILC as a proportion of numbers reported in SISWS) ranges from 87 per cent to 121 per cent.
• For schemes relating to old age, we should note also that about 10 per cent of those aged 65 and over are living in non-private households – mainly nursing homes and hospitals.3 When this is taken into account the coverage ratio for the State Contributory and Non-Contributory Pensions is close to 100 per cent.
• For smaller schemes, the sample size is sometimes insufficient to allow an estimate to be published, and coverage is more variable in the cases where an estimate can be provided.
• The total in receipt of unemployment compensation is close to that recorded at December 2008 by SISWS, but the composition is rather different. At December 2008 there were more persons in receipt of Jobseeker’s Benefit, and fewer in receipt of Jobseeker’s Allowance. This reflects the fact that the onset of the recession brought new inflows onto the Live Register who had previously been in employment, and had an entitlement to the insurance-based Jobseeker’s Benefit.
Overall then, SILC can be seen as providing a very good representation of the social welfare client population, making it a good base from which to conduct policy analysis and modelling.
We now turn to a comparison of the SILC survey with the income tax base, as measured by the Revenue Commissioners. Table 2 below shows that about a quarter of income tax payments come from tax units with incomes below €60,000 per annum. Over 40 per cent comes from those with incomes between €60,000 and €150,000, and a further 30 per cent from the small number of tax units with incomes above €150,000. When we compare the SILC-based estimate of numbers of tax units in these income ranges with the numbers reported by Revenue, we find that SILC has somewhat higher numbers in the lowest income band. This is not unexpected as Revenue coverage of the lowest incomes is unlikely to be complete. However, at higher income levels this consideration does not apply, and SILC appears to underrepresent the population of those with incomes above €60,000 and in particular, those with the highest incomes, above €150,000.
Table 2: Distribution of Aggregate Income Tax Payments and SILC Coverage of Taxpayers by Income Range, 2008
Gross annual income range (From – To)
% of aggregate income tax
payments Ratio between SILC-based estimate of no. of tax units and Revenue estimate
0 60,000 26 107%
60,000 150,000 44 81%
Over 150,000 30 71%
It would be unrealistic to expect a perfect match between SILC-based estimates and Revenue figures. First, this comparison is based on annualised current income, as used in the SWITCH model. Revenue statistics, on the other hand, use income in the calendar year. Second, married couples opting for separate assessment may appear as two separate tax units in the Revenue figures, but as a single tax unit in the SILC based figures. Nevertheless, we expect that the underrepresentation of higher incomes, and in particular of the highest incomes, would be robust to corrections for these factors. Indeed, underrepresentation of higher incomes in surveys is not an uncommon finding in the international literature. There have been similar problems in surveys in other countries, and in previous surveys of income in Ireland – including the predecessors of the SILC, the ESRI’s Living in Ireland Surveys (1994-2001) and the Survey of Income Distribution, Poverty and Usage of State Services (1987).
7
The most important factor contributing to this phenomenon is not, as is sometimes thought, the underreporting of incomes. (This tends to be more of a problem where a single income question or a small number of questions are used. SILC looks for a great deal of detail on income components – thereby prompting respondents to recall items that might be forgotten if asked a single question). Underrepresentation of higher incomes in the survey tends instead to come mainly from lower response rates from those with higher incomes – which may be linked, among other things, to a higher value placed on time. Given that this is so, a strategy which can be used to correct for differential response rates is to calibrate the weights using external information, such as that from the Revenue statistics. As tax-benefit models seek to represent both the income tax base and the social welfare client population, this is an important issue to which we now turn.
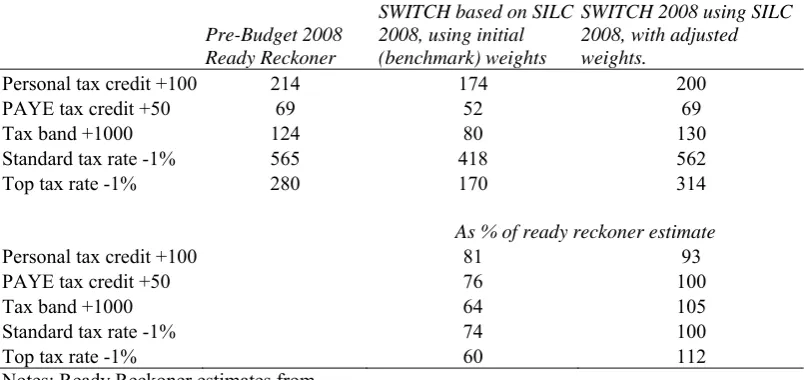
[image:7.595.89.494.481.671.2]Essentially the procedure used is the same as that employed by CSO in constructing the benchmark weights. The difference is that some additional control totals are used, chief among these being control totals or benchmarks relating to the distribution of income taxpayers by income band.4 Similar approaches have been employed for many years in UK tax-benefit models (Atkinson et al., 1988) and in Germany (Merz, 1991). The CSO benchmark weights are treated as the initial weights in our procedure, and new weights are estimated using the CALMAR software5, which gross up the population both to the new control totals, and to the controls applied by CSO. While these weights, by design, differ as little as possible from the input weights, the differences are substantial. Part of the price for the inclusion of additonal controls is that the dispersion of the weights is increased. In our application to 2008, 80 per cent of the cases receive a weight which is between 37% and 230% of the initial weight. This means that two cases which started out with the same weight could see their final weights differ by a factor of 6; and greater differences are found for the remaining 20 per cent of cases. Given that our procedure involves re-applying the control totals from the CSO benchmarks, results on these domains tend to be similar. However, there are substantial differences in terms of the implications of the alternative weighting choices for the analysis of tax policy. Table 3 reports costings of tax policy changes from the Department of Finance/Revenue pre-Budget 2008 “Ready Reckoner”. These are compared with two costings based on SWITCH: one using SILC with the CSO’s benchmark weights, and the other using SILC with the adjusted weights involving calibration to the income distribution among taxpayers. It is clear that when the CSO’s benchmark weights are used, the costs of tax policy changes are substantially underestimated – “coverage” of the cost ranging from about 60 per cent (for a top rate tax cut) to 80 per cent (for a change in the personal tax credit). This is to be expected given the comparison of income distributions in Table 2. Using the adjusted weights, on the other hand, the costs are well represented, with the “coverage ratio” varying between 93 and 112 per cent.
Table 3: Costing of tax policy changes, 2008
Pre-Budget 2008 Ready Reckoner
SWITCH based on SILC 2008, using initial (benchmark) weights
SWITCH 2008 using SILC 2008, with adjusted weights.
Personal tax credit +100 214 174 200
PAYE tax credit +50 69 52 69
Tax band +1000 124 80 130
Standard tax rate -1% 565 418 562
Top tax rate -1% 280 170 314
As % of ready reckoner estimate
Personal tax credit +100 81 93
PAYE tax credit +50 76 100
Tax band +1000 64 105
Standard tax rate -1% 74 100
Top tax rate -1% 60 112
Notes: Ready Reckoner estimates from
http://www.finance.gov.ie/documents/publications/taxation/Ready_Reckonerpre2008.pdf
4 There is also one additional demographic control, giving further detail on the numbers above and below 18. Without this it is possible that the numbers in the key age group for labour market participation may not be fully captured.
8
What implication do the adjusted weights have, if any, for the estimates of “risk of poverty” based on SILC? This depends on two conflicting influences. On the one hand, the additional income captured by this method tends to raise the poverty line. Of itself, this would tend to raise the numbers falling below the income line. But the adjusted figures also imply that a smaller proportion of the population falls into low income categories, and more into the higher income categories. This works in the opposite direction, tending to reduce the incidence of poverty. The net effect cannot be determined a priori. A full simulation of the alternative scenario, with adjusted weights, is needed to resolve the issue of whether this will raise or lower the head count of poverty. This has been done using SWITCH.
Before we turn to these results, we must note that SILC 2008 reports an “at risk of poverty” rate of 14.4 per cent in 2008. Simulation using the SWITCH model, with the benchmark weight provided by CSO, arrives at a slightly lower figure, 13.3 per cent. Of necessity, the simulation is based on the premise that all individuals obtain their maximum welfare entitlements. Simulated poverty measures tend, therefore, to be somewhat lower than the actual – but provide a good basis for simulating the impact of policy changes on risks of poverty.
What happens to the “at risk of poverty” measure when using the adjusted weight, taking into account the distribution of income among taxpayers as measured by the Revenue? Our results indicate that the head count would fall slightly to 12.4 per cent. Thus, the impact of the reweighting on the composition of the population as between low and high incomes dominates the impact of the reweighting on the level of median income and hence the cut-off for “at risk of poverty”.
6. CONCLUSION
Tax-benefit modelling is now part of the infrastructure for policy making and policy debate in Ireland, as in many other countries (see for example the work of the Institute for Fiscal Studies in the UK, and the Tax Policy Center in the US). The use of the model to analyse current tax and welfare policy issues means there is a need for data to represent both the social welfare client base and the income tax base. SILC data provides a key input in this regard. The SILC database for tax benefit modelling has been improved by a small number of additional or more detailed questions, and by linkages to administrative data – which fully respect the requirements of anonymized data in the Research Microdata File (RMF). There are, however, issues surrounding the coverage of the income tax base; in our view, re-calibration of the data is needed to deal with this, when analysing tax-benefit policies using a microsimulation model.
9
ReferencesA.B. Atkinson, J. Gomulka, H. Sutherland (1988), "Grossing-up FES data for tax-benefit models", in A.B. Atkinson, H. Sutherland (Eds) Tax-Benefit Models, London: STICERD Occasional Paper No. 10.
Bourguignon, F. and A. Spadaro (2006) “Microsimulation as a tool for evaluating redistribution policies” Journal of Economic Inequality (2006) 4: 77–106
DOI: 10.1007/s10888-005-9012-6
Central Statistics Office, 2009. Survey on Income and Living Conditions (SILC) 2008, Cork: Central Statistics Office
Citro, Constance F. and Eric A. Hanushek (eds), Improving Information for Social Policy Decisions: The Uses of Microsimulation Modelling Vol. I: Review and Recommendations and Vol. II: Technical Papers, National Research Council, National Academy Press, Washington DC, 1991.
Immervoll, H., Kleven, H. J., Kreiner, C. T. and Saez, E. (2007), Welfare reform in European countries: a microsimulation analysis. The Economic Journal, 117: 1–44.
Merz, J., (1991) “Microsimulation -- A survey of principles, developments and applications”, International Journal of Forecasting, Volume 7, Issue 1, May, pp.77-104.
10
VOTEOFTHANKSPROPOSEDBYTOMMCMAHON,CENTRALSTATISTICSOFFICE
I thank Tim and his co-authors for his very interesting paper dealing with the use of CSO SILC data in the construction of SWITCH, the ESRI tax-benefit model. It is a good example of how published statistical data can have value added to it by analysis by specialist users. This enhances its usefulness for policymakers.
The CSO has over the years emphasised that the data it collects is not just best described simply as data but also as information for users. Our organisation’s mission statement refers to the efficient and timely provision of high quality information for a changing society. We try to achieve that in our own publications through substantive meaningful commentary on and interpretation of the results. Along with this we try to provide quality reports on our publications to give users a sense of the strengths and limitations of the data they are using.
Many in the audience here will be aware that the CSO also facilitates the use by researchers of microdata. This is done in a number of ways e.g. by the supply of RMFs (research microdata files) directly to the researcher or (the preferred option) by the researcher being granted access to the ISSDA. This is done under the provisions of the Statistics Act, 1993. Of course, the paramount thing in these arrangements is the preservation of confidentiality of the data and thus rigorous formal procedures are involved in the supply of such RMFs. The data for this paper was supplied to Tim and his team as an RMF.
Moving on to the content of the paper there are interesting comparisons shown in Section 5. In Table 1, the match between the administrative data numbers of recipients and the SILC numbers is reasonable and the explanations put forward where large differences arise are indeed credible. On the comparison of numbers of tax units by gross income band between SILC and Revenue data the match is rather less good particularly in the higher income ranges.
I would agree certainly that ideally the SILC sample data grossing procedure should involve some sort of income weight. An income survey without some form of income weight is uncommon. This is something that we have been reflecting on but there are some difficulties. The obvious source might be the current year’s Revenue income tax data. This, however, is normally not available on a timescale similar to the SILC data. It may be worth investigating whether the income tax weights change much from year to year. If they do not it might constitute an improvement to the weighting process to use the Revenue data one year in arrears. Another approach which would be based on more up to date information might be to use as a quasi income weight the social group of the head of household. This approach is currently used in the HBS. A final cautionary word on that issue. Introducing an additional dimension into the grossing process would probably give rise to a lot of cells where there are insufficient observations to allow them to be used with confidence as weights.
Finally, in his conclusions Tim mentions the desirability of larger sample size in order to increase accuracy and I suppose also to allow for additional detailed analyses. He does, though, answer his own point by noting the cost of larger sample sizes and this is something that is not likely to happen in current economic circumstances. Indeed it is, if anything, getting harder to achieve and maintain good response rates and all our efforts are going into that.
Again I thank Tim and his colleagues for a very interesting and relevant paper.
DISCUSSION
Kieran Walsh:- Are there significant demands of SWITCH being made by policy makers? For
example, Jim Walsh had mentioned the possibility of trying to model the effect of carbon taxes. Another possibility was of a geographic nature (e.g. would different measures have disproportionate effects on different regions). While the SILC and thus SWITCH would not necessarily support such analysis I'm interested in whether such demand is being expressed. As an alternative does the ESRI find itself having to push the benefits of SWITCH based analysis?