Journal of the Statistical and Social Inquiry Society of Ireland Vol. XXVII, Part III
FINANCIAL DEREGULATION AND IRISH CONSUMPTION BEHAVIOUR*
SIOBHAN LUCEY
Department of Economics, University College Cork (read before the Society, 12 October 1995)
___________________________________________________________________ This lecture is delivered under the auspices of the Barrington Trust (founded by the bequest of John Barrington, Esq.) with the collaboration of the Journal of the Statistical and Social Inquiry Society of Ireland.
Abstract: The objective of this study is to assess whether financial deregulation has had a statistically significant effect on Irish consumption behaviour. Specifically, the study asks whether financial deregulation has affected consumption behaviour by reducing liquidity constraints. Formal stability tests are used to test for diminished liquidity constraints as indicated by a decrease in the excess sensitivity of consumption to current income. Some evidence is presented to suggest that Irish liquidity constraints diminished in the 1980s compared with the 1960-70s, but the decline is small and is not (as yet) statistically significant.
1. INTRODUCTION
The objective of this study is to assess whether financial deregulation has had a statistically significant effect on Irish consumption behaviour. Specifically, the study asks whether financial deregulation has affected consumption behaviour by reducing liquidity constraints. Diminished liquidity constraints would be indicated by a decrease in the excess of observed sensitivity of changes in consumption to changes in current income, over the sensitivity predicted by the Life-Cycle Permanent Income hypothesis of consumption. The analysis will have particular significance for policy makers because a decrease in excess sensitivity implies that systematic countercyclical fiscal policy will be less effective in influencing levels of economic activity. The transmission of countercyclical policy relies on consumption expenditure responding to temporary changes in income. A decrease in excess sensitivity would imply that consumption expenditure will be less responsive to income changes induced by policy.
This paper deals with the issues of the Rational Expectations-Life Cycle Permanent Income Hypothesis (RE-LCPIH) and liquidity constraints. It tests the RE-LCPIH by explicitly testing for excess sensitivity using the method of instrumental variables; it also seeks to test for the existence of diminished liquidity constraints using formal stability tests. The type of liquidity constraints examined are credit controls. The argument put forward in the paper is that their removal in 1984 should have contributed to diminished liquidity constraints during the 1980s. Additional informal evidence to support the case of diminished liquidity constraints is also provided, for example, the significant growth of personal sector credit during the 1980s and the decline of the personal savings ratio. Roche (1995) examined some of the same issues but important differences exist in the techniques used and the type of liquidity constraints examined, with important implications for both the results and their policy implications.
The plan of the paper is as follows. Section 2. provides a review of the Rational Expectations-Life Cycle Permanent Income Hypothesis and the corresponding excess sensitivity puzzle. The section concludes with a brief review of Irish consumption studies. Section 3. outlines the likely consequences of financial deregulation for the consumer and examines the existing evidence on the significance of these consequences for Irish consumers. Section 4. outlines the specification of the model used to test the hypothesis of diminished liquidity constraints. Section 5. presents and analyses the empirical results obtained from the model outlined in the previous section. The conclusion provides a summary of the research.
2. CONSUMPTION
Substantial effort has been devoted to the study of consumption behaviour. Consumption expenditure is important because it accounts for two-thirds of real GNP. This is a significant factor for policy makers who need to know of the possible consequences of changes in fiscal and monetary regimes and policies for consumption and GNP.
The consumer’s view of current consumption expenditure from a lifetime perspective suggests that current expenditure need not equal current income, but that the present discounted value of lifetime consumption must equal the present discounted value of lifetime resources. This view implies that a change in current income will be reflected in a change in consumption through its effect on a consumer’s lifetime resources or alternatively through its effect on permanent income.
Obtaining an estimate of future income prospects requires explicit assumptions about how consumers form their expectations. Hall (1978) incorporated the explicit assumption of rational expectations into the Life Cycle Permanent Income Hypothesis. The Rational Expectations Hypothesis states that consumers will incorporate all information available to them to predict income as accurately as is possible. For consumption behaviour it means the expectation of lifetime resources in the current period would reflect all the information that was available to the consumer up to the current period. Hall argued that any difference between the expectation of lifetime resources in the current period and the expectation of lifetime resources in the previous period is not forecastable, from the viewpoint of the last period. If it were forecastable, then the consumer would have already incorporated such information into her expectation of lifetime resources in the previous period. Hall extended the analogy to changes in consumption between the current and previous period. Since consumption depends on expected lifetime resources, changes in consumption should simply reflect new information (that is, news) on expected lifetime resources and should not respond to information such as past income which was already known in prior periods. Since news is inherently unpredictable, changes in consumption are unpredictable. Consumption therefore follows a random walk.1 Once lagged consumption is included in determining current consumption expenditure, all other economic variables, especially lagged values of income, should have no explanatory power with respect to consumption spending behaviour (Hall, 1978:972-3).
This implication of the Rational Expectations-Life Cycle Permanent Income Hypothesis is important but it is not supported by empirical analysis. More specifically, studies commonly find that current consumption is more sensitive to current income than would be the case if the RE-LCPIH held (Flavin, 1981; Hall and Mishkin, 1982; Hayashi, 1982; and for Ireland, Roche, 1995). Furthermore, the studies showed that this excess sensitivity is not due to the unanticipated change in income (that is, news), but to the anticipated component of income, which under rational expectations should already be incorporated into lagged consumption. It is known as the excess sensitivity puzzle.
fluctuations. The primary aim of countercyclical policy is to dampen the business cycle. For example, income tax rates would be cut during recessions and increased during booms. The operation of the policy relies upon a temporary but subsequently reversed fiscal boost (reduction), raising (lowering) current income and thereby consumption. If consumers are of the forward looking, consumption smoothing type (RE-LCPIH), they will realise that the policy induced increase in income will subsequently be reversed. It will therefore have no effect on their expected lifetime resources and thereby no effect on current consumption expenditure. Hence the transmission of countercyclical policy relies on consumption expenditure responding to temporary changes in income induced by policy, rather than on consumption smoothing. To the extent that the proportion of forward looking consumption smoothing type consumers increases, countercyclical fiscal policy will become less effective in influencing levels of economic activity.
A substantial body of empirical work has evolved in an attempt to understand the excess sensitivity puzzle (for example, Flavin, 1985; Hayashi, 1985a, 1985b; and Zeldes, 1989). One of the main conclusions that has arisen from this work is that the empirical failings of the RE-LCPIH may be attributable to the violation of one of its underlying assumptions: the assumption that capital markets are perfect. This assumption implies that consumers can borrow and lend to smooth their lifetime consumption expenditure path. For example, as the Life-Cycle Hypothesis outlines, in the early years of the consumer’s life-cycle (as a student or a first-time employee), consumption will exceed income and the consumer may borrow to finance consumption. Capital market imperfections will prevent the consumer from borrowing and hence will prevent the consumer from realising her desired consumption expenditure path. The most common representation of these capital market imperfections, which is cited as a reason for the rejection of the RE-LCPIH, is liquidity constraints (Flavin,1985; Hayashi, 1985a, 1985b; and Zeldes, 1989). Consumers are liquidity constrained if “they face quantity constraints on the amount of borrowing (credit rationing) or if the loan rates available to them are higher than the rate at which they could lend (differential interest rates)” (Hayashi, 1985a:92). Hayashi (1985a) contended that liquidity constraints are sufficient to constrain consumers from obtaining their desired consumption spending target, which subsequently results in a departure of consumption behaviour from a random walk. Jappelli and Pagano (1989) concluded that “the low levels of consumer debt observed in countries where the excess sensitivity is high can be interpreted as evidence that liquidity constraints are at the root of the empirical failures of the [RE-LCPIH]” (1989:1101).
decisions would therefore depend less on current income and consumer behaviour should be more like that described by the RE-LCPIH. A decrease in the excess sensitivity of current consumption to current income would therefore be consistent with diminished liquidity constraints arising as a consequence of financial deregulation.
Prior to examining the effects of financial deregulation for Irish consumers, a brief review of Irish consumption studies will be outlined in the next section.
Irish Consumption Studies
There have been many studies of aggregate Irish consumption spending since the early 1970s.2 Of the earlier studies, many attempted to explain the developments in the savings ratio during the recessionary period of the mid-1970s.3 Some examples are Kelleher (1977), Honohan (1979), and Boyle (1982). Bradley (1979) classified personal consumer expenditure into three groups: durables, non-durables and services. He concluded that the inflation rate, the growth rate of real income, and the unemployment rate were significant determinants of Irish consumption. Similar results were obtained by Honohan (1982) who undertook a Bayesian approach to consumption. McCarthy (1979) found evidence that the unemployment rate had a significant effect on consumption. His finding that as unemployment rises consumption falls was subsequently given more support by Honohan (1982), Bradley (1979) and Moore (1987). Moore tested the Ricardian Equivalence Hypothesis using Irish data and found that evidence existed in favour of tax discounting. Whelan (1991) subsequently re-estimated this consumption function, but in contrast, failed to find evidence in favour of the Ricardian Equivalence Hypothesis.
O’Reilly (1983) produced the first quarterly study of Irish consumption behaviour. Based on previous Irish studies, he included real disposable income, real liquid assets, the inflation rate and the unemployment rate in his model. His empirical results found that these variables were significant. His model fitted the data well with the exception of 1975.4 The most recent study on the determinants of consumption, Frain et al. (1995) concluded that personal disposable income, the unemployment rate and lagged values of consumption itself are significant determinants of consumption expenditure in Ireland.
out of transitory income is dramatically affected in both magnitude and statistical significance, by the inclusion of a proxy for liquidity constraints” (1985:135). This finding suggests that liquidity constraints may be an important part of the explanation of the observed excess sensitivity of consumption to current income. The significance of the unemployment rate in previous Irish consumption studies may be interpreted in this way.
Roche (1995) explicitly tested whether the RE-LCPIH was consistent with Irish data. He tested it by “asking whether consumption is too smooth to be consistent with the [hypothesis]” (1995:284). Employing methods used by Campbell and Deaton (1989) and Gali (1991), he rejected the pure RE-LCPIH and concluded that only 50 per cent of Irish consumers behave according to the RE-LCPIH (1995:285).
This study proposes to test the RE-LCPIH and examine if the financial deregulation that has occurred in the Irish financial markets during the 1980s, has affected Irish consumption behaviour. Prior to empirically testing this proposition, the consequences of financial deregulation for Irish consumption expenditure will be examined in the next section.
3. FINANCIAL DEREGULATION AND ITS CONSEQUENCES
The principal aim of financial deregulation was to create an unrestrictive and competitive environment for all financial institutions in domestic markets and between international markets. The principal features of the deregulation movement included reducing price and quantity restrictions (for example, interest-rate ceilings and credit controls), easing restrictions on international capital mobility, increasing access to foreign financial markets, and easing restrictions on certain other activities (for example, by allowing institutions to offer a wider range of services and to deal in more diversified portfolios).
Innovation has aided the deregulation process in the financial markets revolution. Van Horne described financial innovation as “one of the bedrocks of our financial system... the life blood of efficient and responsive capital markets”(1985:621). He defined a financial innovation as either a new process or a new product which arises in response to profit opportunities created by market inefficiencies and incompleteness. He stated that the basic foundation of financial innovation is to make markets more efficient and complete. This goes hand in hand with the aims of deregulation. The combined effects of both financial deregulation and innovation have resulted in the increasing integration of international financial centres. As Time magazine aptly described it “the world’s financial markets are so intertwined that when one itches, the others scratch” (August 3, 1992:21).
countries.5 Deregulatory measures have also been implemented in Ireland, particularly during the 1980s. For example, the government implemented specific measures in the Finance Act, 1986,6 the Building Societies Act, 1986 and the Trustee Savings Act, 1990, all of which served to move Irish financial institutions towards competitive equality.7
Consequences of Financial Deregulation for the Consumer
On the international level, a number of consequences of financial deregulation for consumer behaviour have been identified. This section will outline these consequences and examine whether they are evident for Ireland. This will indicate whether or not financial deregulation has significantly affected Irish consumption expenditure.
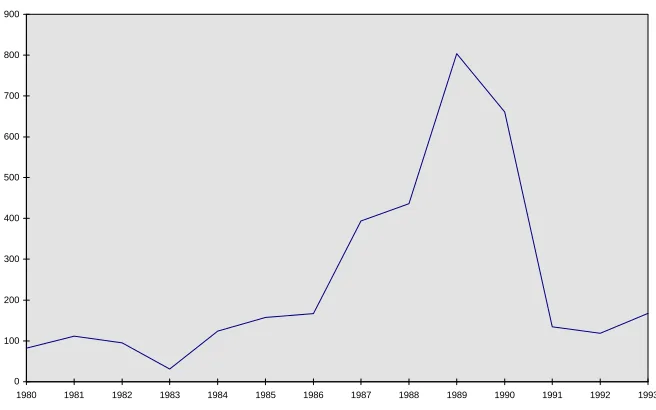
Internationally, one of the significant consequences of financial deregulation was the increased availability of credit. Several of the major world economies, notably the U.S., the U.K. and Australia, experienced booms during the 1980s, which were widely acknowledged to be fuelled by increased availability of credit. With the deregulation of their financial services, it became much easier for consumers to borrow money. Browne et al. argued that “if ‘financial repression’ involves forced saving, the amount of which accumulates with time, then sudden complete [deregulation] could release a wave of pent-up demand” (1991:19-20), an additional factor contributing to the consumption booms.
Figure 1 Annual change in Personal Sector Credit (£m), 1980-1992
0 100 200 300 400 500 600 700 800 900
1980 1981 1982 1983 1984 1985 1986 1987 1988 1989 1990 1991 1992 1993
Source: Central Bank Bulletin (various)
An important element of the deregulation movement that possibly contributed to this increase in personal sector credit was the elimination of credit controls. Credit controls were used periodically by the Central bank between 1965 and 1986. The formal credit guideline for licensed banks’ lending to the private sector was terminated in 1984. This was succeeded for a brief period by an “indicative” guideline which was discontinued in 1986. The objective of credit controls is to curtail the growth in bank credit. Credit controls are important for this study as they constitute a liquidity constraint (Hayashi, 1985a:92). Their removal should imply that liquidity constraints facing Irish consumers have been reduced as a result of deregulation and, subsequently, that the pattern of Irish consumption is smoothed. This argument obviously depends on the effectiveness of credit controls when they were in use.
Equations explaining Associated Banks’ personal loans, non-Associated Banks’ instalment credit, and real consumer expenditures were estimated using quarterly data for both the pre-guideline and guideline enforced time periods (1986:50-51). Further equations explaining the Associated Banks’ productive lending and real fixed investment were also estimated (1986:53). Leddin concluded that personal lending was restricted during the period of 1978-1982 and that as a result consumer durable expenditure and retail sales were affected (1986:55-56), but that productive loans and thereby fixed investment were unaffected by the guidelines.
Leddin’s results suggest that Irish consumers were credit constrained and his findings on investment are consistent with the Central Bank’s discriminatory application of guidelines. The Central Bank used an overall guideline for private sector credit with a sectoral guideline for personal sector credit during this time-period. The sectoral guidelines were discriminatory in their imposition as “banks were also exhorted to review lending to other sectors with a view to ensuring that, within the overall guideline, the maximum amount of credit is reserved for the most productive purposes” (Davy et al, 1984:74). The Central Bank recognised and publicly acknowledged that this approach was discriminatory, but held that it was “justified by the need to finance production and investment rather than personal consumption” (Murray, 1979:114).
current consumption to current income. It is an important implication for this study. Empirical results indicating a decline in the excess sensitivity would be consistent with an increase (decrease) in the proportion of forward-looking (liquidity constrained) consumers in Ireland. It would suggest that financial deregulation has had an effect on Irish consumer spending behaviour.
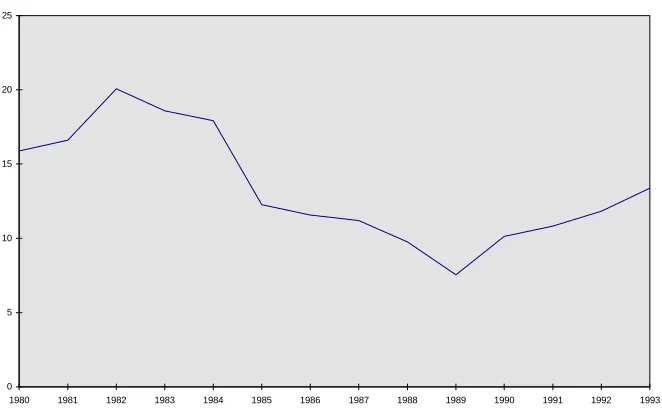
Figure 2 Real Personal Savings Ratio (%), 1980-1993
0 5 10 15 20 25
1980 1981 1982 1983 1984 1985 1986 1987 1988 1989 1990 1991 1992 1993
Source: CSO National Income and Expenditure Accounts
Focusing on credit controls and their abolishment in 1984, the subsequent growth in personal sector credit in the mid-to-late 1980s, and Leddin’s (1986) work suggest that quantity rationing was prevalent in Ireland. As liquidity constraints are cited as one of the main explanations of the excess sensitivity puzzle, a reduction in their coverage (removal of credit controls) should be reflected in a reduction in excess sensitivity. The next section specifies a model which will be used to empirically test this proposition.
4. SPECIFICATION OF THE MODEL
The genesis of “excess sensitivity” models is Hall (1978). He argued that if consumers optimise their lifetime utility subject to the lifetime budget constraint, then as an approximation, consumption should follow a random walk with drift (Hall, 1978:974-6):
Ct = µ + Ct-1 + εt (1)
∆Ct = µ + εt (2)
Equation 1 states that current consumption Ct is equal to consumption in the previous
period Ct-1 plus εt which represents new information about expected lifetime
resources which cannot be predicted from the previous period,9 plus a drift term µ. Expressed alternatively in equation 2, where ∆ is the first difference term, changes in consumption are due to innovations or news about current income, that is εt.
A number of studies were published after Hall’s study that used variants of his random walk model for testing the RE-LCPIH (Flavin, 1981; and Hayashi, 1982). The most common procedure for evaluating the RE-LCPIH is to derive a general model which accounts for two types of consumers:
a) those who consume out of their permanent income (RE-LCPI Hypothesis); and
b) those who consume their current income, that is rule-of-thumb (ROT) consumers.
Rule-of-thumb consumers are an extreme case of the basic Keynesian Hypothesis about consumer spending. It is assumed that consumers follow the simple rule Ct =
Yt, where Yt is current income. In contrast, the RE-LCPIH holds that consumption is
The Campbell and Mankiw (1989) approach to testing the RE-LCPIH is adopted in this study to test the hypothesis of declining excess sensitivity. Any such finding would be consistent with diminished liquidity constraints which could result from deregulation. They nest the RE-LCPIH in a more general model, in which it is assumed that a fraction λ of total income, Yt, accrues to rule-of-thumb consumers
with the remainder (1-λ) to permanent income-type consumers (1989:187-188). If the income of the two groups is Yrt and Ypt, total income is given by Yt = Yrt + Ypt.
The disposable income of the rule-of-thumb consumers Yrt equals λYt; as they
consume their current income, their current consumption Crt will change by the same
percentage as their current income, that is, ∆Crt = ∆Yrt = λ∆Yt. The disposable
income of those consumers who behave according to the RE-LCPIH Ypt equals
(1-λ)Yt; the change in their current consumption is ∆Cpt = (1-λ)(µ+εt). The change in
total consumption Ct can therefore be expressed as:
∆Ct = ∆Cpt + ∆Crt (3)
Substituting for ∆Cpt and ∆Crt, the modified model is then as follows
∆Ct = (1-λ)(µ+εt) + λ∆Yt (4a)
∆Ct = û + λ∆Yt + ωt (4b)
where
û = (1-λ)µ C = Consumption
Y = Personal Disposable Income
λ = the degree of “excess consumption sensitivity” ωt = the disturbance term (1-λ)εt;
∆ = first difference term
This equation reduces to the RE-LCPIH when λ=0 and to the rule-of-thumb situation when λ=1. Campbell and Mankiw (1989) test the RE-LCPIH by estimating λ and testing the null hypothesis that λ=0. Browne et al. used this model to test whether the size and significance of λ diminished over the period of time when significant deregulation took place within eight OECD countries,10 particularly in the OECD financial markets that deregulated earlier and more thoroughly.11 In this study, equation 4b is being used to test whether the size and significance of λ has diminished for Ireland over recent years.
Specifically, three questions are posed to assess whether financial deregulation has significantly affected consumption expenditure in Ireland, during the 1980s:
Results indicating a significant λ, when equation 4b is estimated, would imply a rejection of the pure RE-LCPIH. It would suggest that there is a significant fraction of rule-of-thumb consumers within the population. A decrease in the size of λ is consistent with a reduced incidence of liquidity constraints. If the results indicate that the λ coefficient has declined during the deregulatory period of the 1980s, then it is still necessary to determine whether this decline is significant. A significant decline provides evidence that financial deregulation in Ireland has reduced liquidity constraints facing Irish consumers.
The dependent variable in equation 4b is real consumption per capita and the explanatory variable is real disposable income per capita. All variables are scaled by lagged real disposable income. The reason for scaling follows Campbell and Mankiw (1989) who state that in practice it is likely that the mean change and the variance in consumption and income grow with the level of consumption or income (Campbell and Mankiw, 1989:190). Without scaling there is the possibility that a heteroscedasticity problem might arise.
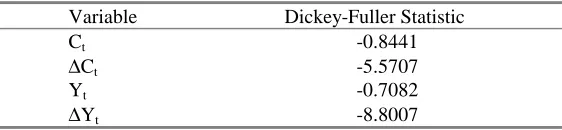
Both consumption and income are expressed in first differences. First differences of consumption and income are used to deal with the nature of aggregate time-series data. The Augmented Dickey-Fuller (ADF) test and the Johansen procedure were used to test for the stationarity and co-integration respectively of consumption and income.12 The number of lags used in each estimation was determined by the number of lags required for the absence of serial correlation. Table 1a suggests that the levels of consumption and income are difference stationary, that is I(1).13 The Johansen procedure is then used to test for the co-integration of consumption and income. If the variables are co-integrated then model 4b is mis-specified. Table 1b demonstrates that at the 5 per cent significance level, the null hypothesis of non co-integration cannot be rejected.14 Non co-integration shows that modelling the series in differences implies that there is no loss of important levels of information in the estimated equation. Both Roche (1995) and Frain et al. (1995) obtained similar results for their consumption and disposable income data. However, the results should be treated with caution, as the tests are based on asymptotic theory, and hence require a large number of observations.
All the Irish data are obtained from the National Income and Expenditure Accounts, on an annual basis for the period 1954-93 (Central Statistics Office, various). A brief explanation of each variable is given in Appendix 1.
5. EMPIRICAL EVALUATION
capita, the lagged change in real consumer expenditure per capita, the change in real exports per capita, and lagged real disposable income per capita. All instruments are scaled by lagged real disposable income, for reasons outlined earlier. Instrumental variables are used firstly to account for the role of current income in signalling changes in permanent income. Secondly, instrumental variable estimation is used as a cautionary measure: the assumption that income is weakly exogenous is potentially invalid and could manifest itself into simultaneity bias and parameter instability. Using IV avoids this potential problem.
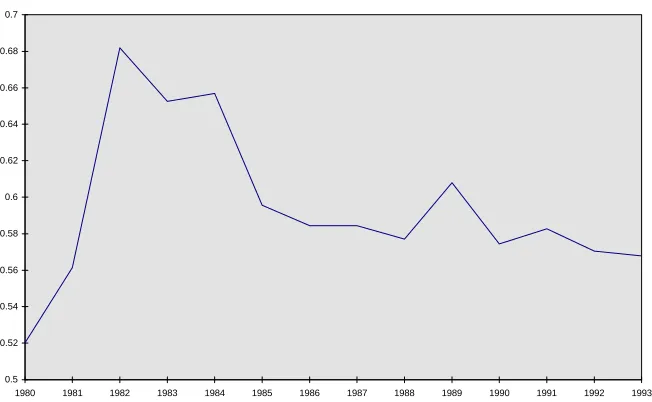
Tables 2a and 2b presents the results of the IV estimation of equation 4b. The Sargan test for instrument validity is not significant, hence the joint hypothesis of instrument validity and valid specification cannot be rejected. The results indicate that the λ coefficient of 0.57 is statistically significant. The significant estimate of λ indicates a rejection of the pure RE-LCPIH, and provides evidence of the existence of rule-of-thumb consumers. The value of λ can be interpreted as the fraction of rule-of-thumb consumers, that is those who consume their current income (Campbell and Mankiw, 1989:192). Therefore, 57 per cent of Irish consumers are rule-of-thumb consumers or alternatively expressed, 43 per cent of Irish consumers behave according to the RE-LCPIH. The estimate is consistent with Roche (1995) who estimated that the fraction of rule-of-thumb consumers is about 0.5-0.6 (Roche, 1995:294).
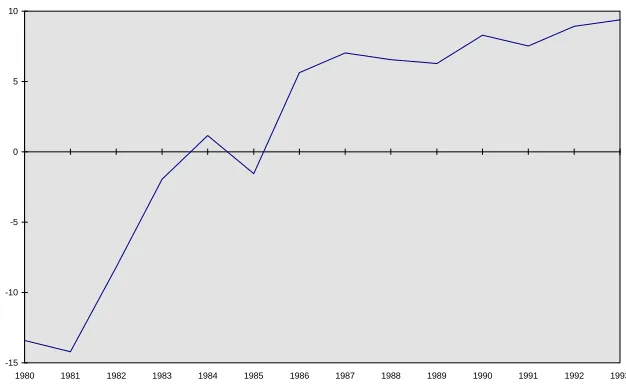
Figure 3 Pattern of Recursive Coefficients, 1980-1993
0.5 0.52 0.54 0.56 0.58 0.6 0.62 0.64 0.66 0.68 0.7
1980 1981 1982 1983 1984 1985 1986 1987 1988 1989 1990 1991 1992 1993
To test if the decline is significant, a number of formal stability tests will be applied. Stability tests are used to determine whether the coefficients of a model are the same in two or more different sample periods. They are tests of parameter (in)stability or alternatively tests of structural change. The sample periods could correspond to different economic environments, such as different policy regimes. In this study the tests are used to determine whether the coefficient λ is the same between the earlier regulated period - when quantity rationing was prevalent - and the later deregulated period of the 1980s. If the tests suggest that λ is not the same in the two time periods, it would indicate that the observed decline in λ is significant.
The best known and most widely used stability tests are the Chow tests. Both of these tests are based on F-distributions. With instrumental variables, however, such F-tests are invalid. An alternative method which is valid, is to use dummy based analogues of the Chow tests, in which the tests reduce to Wald tests based on zero restrictions on the dummies. The Chow I analogue, the Wald version, was popularised by Gujarati (1970). The analogue of the Chow predictive test was proposed by Salkever (1976). Details of both tests are provided in Godfrey (1989). Chow I Analogue - Wald Version17
This test is based on the following equation which allows for differential intercept and slope coefficients.
The Wald statistic tests the joint hypothesis of b1 and b2 = 0. If the joint hypothesis
cannot be rejected, this indicates that there is no evidence of structural change or parameter instability over the time period concerned. For this study, it would indicate that the decline in λ during the 1980s is not significant.
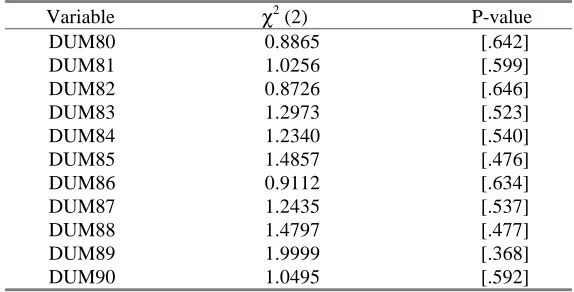
The dummy variable DUM is defined to be zero from 1955 up to a specified year during the 1980s and 1 from the specified year to 1993. The test is applied recursively with the dummy variable rolled forward one period, successively. The results of the Wald statistic with the corresponding p-values are reported in Table 3. In each case, the joint hypothesis cannot be rejected, that is the results indicate that there is no significant structural change during the period 1980 to 1990. In addition, for each respective regression, the parameters attached to the dummy variables DUMt and DUM.∆Yt were individually statistically insignificant, confirming the results of the Wald statistic.
Chow II Analogue - Predictive Test
An intuitive way to test the hypothesis of coefficient stability is by prediction. If the predicted values provided by a particular model are sufficiently different from the observed data, then evidence exists to suggest that the model specification is not adequate or that an underlying change which is not being accounted for by the existing model has occurred (for example, a move from a regulated to a less regulated regime). Salkever (1976) proposed an alternative method to calculating the Chow predictive test. This test is based on the estimation of the following equation
∆Ct = û + λ∆Yt + ΣbiDUMMYi + ωt (6)
where DUMMYi equals one in period i and zero elsewhere. This set of dummies is
added to the equation for j sub-periods. A joint test of the significance of the set of dummies is then used to test for a structural change over the j sub-periods. In this case the structural change or parameter instability will be indicated by predictive failure of the model. Again the sub-periods under test concern the pre 1980s and subsequent periods, as the focus is on the period of deregulation in Ireland. The test is done recursively predicting i periods ahead.18 The estimated coefficient on each dummy (bi) represents the prediction error and the t-statistics on each coefficient
indicate those periods of significant prediction error.
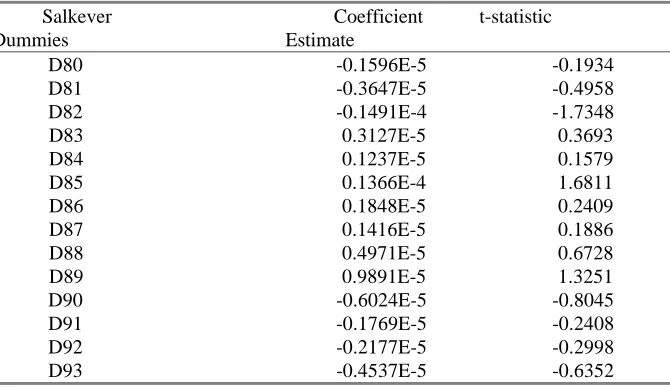
An additional test of stability for the λ parameter is the one step ahead prediction test. This method begins by estimating the model over a specified sample period (smaller the than full sample size) plus one observation and includes a Salkever dummy variable taking on the value of 1 in the final period and zero elsewhere. The first test in the sequence is a t-test on the significance of this dummy variable. The sample period is then increased by one and the dummy variable moved to the new final period, and a second t-test is calculated; the sample period continues to increase by one, and the last test is applied over the entire sample period, with the dummy variable equal to 1 in the last period that is, 1993 in this study and 0 elsewhere. For each regression a significant t-ratio on the respective Salkever dummy would indicate predictive failure, again suggestive of a significant change in λ. The coefficient estimates and respective t-ratios for the dummy variables are presented in Table 5. The results indicate that each Salkever dummy is insignificant, thus providing no evidence of significant predictive failure. These results confirm the findings of the Wald statistics.
Summary of Results
The RE-LCPIH was rejected using Irish data on the finding of a large and significant λ. This result is consistent with Roche (1995) and suggests that 57 per cent of Irish consumers behave as rule-of-thumb consumers, that is those who consume their current income. One can visually identify some decline in the λ coefficient using recursive estimation. None of the stability tests suggest that the decline is significant. Possible explanations for the insignificance of the decline of λ during the 1980s would include:
• that there is insufficient data within the sample set to highlight a significant decline in the excess sensitivity coefficient. Most of the financial deregulation that has occurred in Ireland has taken place during the late 1980s. Possibly more observations are required before the significant decline can be observed;
• in other studies, other factors have been included to account for the excess sensitivity. For example potential wealth effects and consumers expectations could play a role in this model;
• liquidity constraints may be reflected more through interest rate spreads. Roche (1995) argued that there were capital market imperfections in the form of interest rate spreads in the Irish economy during the late 1980s (1995:302).
• instrumental variable estimation relies on asymptotic theory and hence requires a large number of observations. The small size of the available sample could also contribute to the insignificance of the results.19
It has been argued that liquidity constraints facing consumers may become less important as financial deregulation has reduced imperfections in financial markets during the 1980s. One likely consequence of this is that consumers are now more forward looking. The objective of the study was to assess whether financial deregulation had a statistically significant effect on consumer behaviour. Specifically tests of one consequence of liquidity constraints (the diminishing excess sensitivity of current consumption to current income) were presented using Irish data over the 1980s. Some evidence was found for a decline in the excess sensitivity of consumption to current changes in income, but the decline was not found to be statistically significant. A variety of stability tests fail to find significant evidence of a change in the proportion of population who can be characterised as rule-of-thumb or extreme Keynesian consumers. In short, the combined results indicate that financial deregulation has not (yet) had a significant effect on Irish consumers. The evidence in this paper seems to disagree with that produced by Leddin (1986) but may be consistent with Roche (1995). Leddin argued that the credit controls imposed by the Central Bank during 1978-1984 reduced real consumer expenditure. His results suggest that liquidity constraints in the form of quantity rationing were prevalent in Ireland during this time period. The removal of credit controls in the mid 1980s should therefore be reflected in a decline of λ. Roche argued that interest rates were an increasingly prominent cause of liquidity constrained behaviour in the 1980s.
In principle excess sensitivity should show up in response to either price (interest rate spreads) or quantity (credit) rationing. The argument could be made that price rationing replaced credit rationing during the 1980s, and therefore may contribute to the insignificance of the decline in λ. One possibility for future research is to examine whether financial deregulation has simply led to a substitution of price rationing for quantity rationing in Ireland. If price constraints simply substituted for quantity constraints, then the change in λ would not be significant, which is consistent with the results of this study. Alternatively the substitution may lead to an increase in λ during the 1980s. This is not observed in Figure 3.
An alternative argument which could account for the results presented here is that most of the financial deregulation that has occurred in Ireland has taken place during the late 1980s, and it may still be too early to observe the effects of financial deregulation for the Irish consumer.
TABLES
Table 1a: Unit root tests for Consumption and Income - Augmented Dickey-Fuller test
Variable Dickey-Fuller Statistic
Ct -0.8441
∆Ct -5.5707
Yt -0.7082
∆Yt -8.8007
Note: The null hypothesis is that the variable in question is I(1); the ADF test includes a constant and the 5 per cent rejection region is -2.93. The number of lags employed was 1.
Table 1b: Tests for Co-integration - Johansen procedure
Null Hypothesis Likelihood ratio 5% critical value statistic
r=0 v. r=1 11.2762 14.9
r=1 v. r=2 2.1419 8.18
Note: the number of co-integrating vectors is r. The number of lags employed was 1.
Table 2a: Instrumental Variable Estimation of Equation 4b; Estimation Period 1955-1993
∆Ct = 0.2170E-5 + 0.5678∆Yt
(1.209) (3.362) R2 = 0.377
Table 2b: Diagnostic Tests of the Instrumental Variable; Estimation of Equation 4b, 1955-1993
Test
1. Sargan’s Instrument Validity test
CHI-SQ(3) = 0.9591 P-value = 0.811 2. Lagrange Multiplier test of Serial Correlation
CHI-SQ(1) = 2.0848 P-value = 0.149
3. Ramsey’s RESET test of Correct Functional Form CHI-SQ(1) = 0.4258 P-value = 0.514
4. Bera and Jarque test of Normality
[image:21.595.153.440.364.510.2]CHI-SQ(1) = 0.8004 P-value = 0.670 5. Breusch-Pagan test of Heteroscedasticity CHI-SQ(1) = 0.0061 P-value = 0.937
Table 3: Instrumental Variable Estimation of Equation 5, Variable Deletion Tests - Wald Statistic χχ2(2) presented; Estimation Period 1955-1993
Variable χ2 (2) P-value
DUM80 0.8865 [.642]
DUM81 1.0256 [.599]
DUM82 0.8726 [.646]
DUM83 1.2973 [.523]
DUM84 1.2340 [.540]
DUM85 1.4857 [.476]
DUM86 0.9112 [.634]
DUM87 1.2435 [.537]
DUM88 1.4797 [.477]
DUM89 1.9999 [.368]
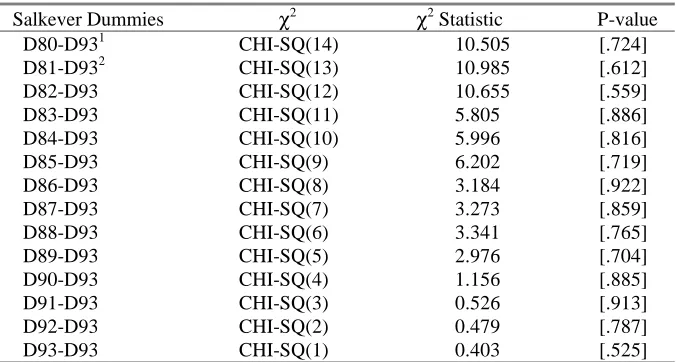
Table 4: Instrumental Variable Estimation of Equation 6, Successive Salkever Tests - Wald Statistic χχ2 presented; Estimation Period 1955-1993
Salkever Dummies χ2 χ2 Statistic P-value
D80-D931 CHI-SQ(14) 10.505 [.724]
D81-D932 CHI-SQ(13) 10.985 [.612]
D82-D93 CHI-SQ(12) 10.655 [.559]
D83-D93 CHI-SQ(11) 5.805 [.886]
D84-D93 CHI-SQ(10) 5.996 [.816]
D85-D93 CHI-SQ(9) 6.202 [.719]
D86-D93 CHI-SQ(8) 3.184 [.922]
D87-D93 CHI-SQ(7) 3.273 [.859]
D88-D93 CHI-SQ(6) 3.341 [.765]
D89-D93 CHI-SQ(5) 2.976 [.704]
D90-D93 CHI-SQ(4) 1.156 [.885]
D91-D93 CHI-SQ(3) 0.526 [.913]
D92-D93 CHI-SQ(2) 0.479 [.787]
D93-D93 CHI-SQ(1) 0.403 [.525]
Note 1: This is the joint significance test of the Salkever dummies in the following regression:
∆Ct = û + λ∆Yt + b0D80 + b1D81 + b2D82 + b3D83 + b4D84 + b5D85 + b6D86 +
b7D87+ b8D88 + b9D89 + b10D90 + b11D91 + b12D92 + b13D93+ ωt
Note 2: This is the joint significance test of the Salkever dummies in the following regression:
∆Ct = û + λ∆Yt + b1D81 + b2D82 + b3D83 + b4D84 + b5D85 + b6D86 + b7D87+
Table 5: Successive One-Step Salkever Predictive Tests Prediction error and t-statistic presented; Estimation Period: Min 1955-1980, Max 1955-1993
Salkever Coefficient t-statistic Dummies Estimate
D80 -0.1596E-5 -0.1934
D81 -0.3647E-5 -0.4958
D82 -0.1491E-4 -1.7348
D83 0.3127E-5 0.3693
D84 0.1237E-5 0.1579
D85 0.1366E-4 1.6811
D86 0.1848E-5 0.2409
D87 0.1416E-5 0.1886
D88 0.4971E-5 0.6728
D89 0.9891E-5 1.3251
D90 -0.6024E-5 -0.8045
D91 -0.1769E-5 -0.2408
D92 -0.2177E-5 -0.2998
Footnotes
1. A random walk is an AR(1) process, specified as follows: Ct = Ct-1 + et; et is a
white noise term, that is distributed identically and independently over time with zero mean and constant variance.
2. A comprehensive review of these studies is provided in Bradley and Fanning (1984), Moore (1987) and Frain et al. (1995).
3. There were sharp increases in the savings ratio in 1972 and 1973; it declined in 1974, but rose sharply again in 1975.
4. See footnote 3.
5. Detailed analyses of the international financial deregulation process are given in White (1986) for Australia, Llewellyn (1986) for Britain, Gart (1984) and Kaufman (1986) for the United States and Englund (1990) for Sweden.
6. In the 1986 Budget, measures were undertaken to create a more competitive environment between the Associated Banks and other financial institutions, in particular the building societies. These measures included the introduction of the withholding tax on interest earnings, the Deposit Interest Retention Tax (DIRT) and the extension of non-disclosure to the Revenue Authorities of interest on deposits. 7. Detailed analyses of the Irish financial deregulation process are given in Bardon
(1991), Bourke and Kinsella (1988), McGowan (1986), and O’Shaughnessy (1987).
8. Roche tested a model with liquidity constrained consumers who face a schedule of loan interest rates which are an increasing function of the amount of the loan. 9. et is a white noise term, that is distributed identically and independently over time
with mean zero and variance σ2.
10. United States, Japan, Germany, France, Italy, United Kingdom, Canada and Australia.
12. Consumption and income scaled by lagged real disposable income are used in the ADF and Johansen estimations. Similar results were obtained for the unscaled version of the variables.
13. A series is said to be integrated of order 1 (I(1)) if, although it is itself non-stationary, the changes in the series form a stationary series (Hendry et al., 1993:6). 14. This result was confirmed by the co-integrating Dickey-Fuller (CRDF) test.
15. Both consumption and income are measured as annual averages rather than at points in time. A solution to the potential time aggregation problem of induced serial correlation is to use lags of more than one period as instruments for the change in personal disposable income. However as the diagnostic tests suggest no evidence of serial correlation, lags of one period were used as instruments in this case.
16. See Appendix 2.
17. The validity of this test is conditional on the assumption of homoscedasticity. 18. The tests are based on IV estimates and to ensure the validity of the tests the same
set of instruments is used under both the null and alternative hypotheses.
Appendix 1 - Data
The sources used in this study were the CSO National Income and Expenditure (NIE) accounts (various) and the Central Bank of Ireland annual and quarterly bulletins (various). All series are annual and the time period concerned is 1954-1993. Personal Consumption (C) is defined as “Personal Expenditure on Consumer Goods and Services” at current market prices, in the NIE accounts. The income variable (Y) is personal disposable income and is calculated as personal consumption plus personal savings (S), the latter is obtained from the NIE. All series, C, Y, and S are divided by the implicit price deflator for personal consumption and total population.
[image:26.595.131.444.456.649.2]The measure used for Government expenditure (G) is “net Expenditure by Public Authorities on current goods and services” at current market prices, from the NIE accounts. It is divided by its own implicit price deflator and total population. Exports (EX) is defined as “Exports of goods and services” at current market prices, from the NIE accounts. It is divided by its own implicit price deflator and total population. The interest rates used as proxies for the borrowing and lending rates (Figure 4) are sourced from the Central Bank bulletins (various). The borrowing rate used is the overdraft rate charged by the Associated Banks to category “A” borrowers. The lending rate is the deposit rate offered by the Associated Banks on demand deposits of size £5,000-£25,000. Both rates are converted to real rates using the percentage change in the implicit price deflator for personal consumption.
Figure 4 Lending Rate (%) minus Borrowing Rate (%) (adjusted for inflation)
-15 -10 -5 0 5 10
1980 1981 1982 1983 1984 1985 1986 1987 1988 1989 1990 1991 1992 1993
Appendix 2 - Econometric Techniques
(i) ORDINARY LEAST SQUARES Consider the general linear regression model
Yt = ß1X1t + ß2X2t+ ß3X3t +...+ßkXkt + µt
where the ßs are unknown parameters. The model states that the data generating process of Yt is a combination of k explanatory variables, Xt for t=1..k, plus a
stochastic disturbance term ut. The model can be estimated by Ordinary Least
Squares (OLS) if the following conditions are satisfied: 1. The disturbances have zero mean and finite variance:
E(ui|Xi) = 0, and Var(ui|Xi) = σ2;
2. The disturbances are uncorrelated with one another and are uncorrelated with the explanatory variables:
Cov(ui,uj) = 0, and Cov(ui,Xi) = 0; and
3. The model is correctly specified.
Given these assumptions, the OLS estimates of the unknown parameters ßs, in the class of unbiased linear estimates, have minimum variance, that is, they are the best, linear, unbiased estimators (BLUE).
(ii) INSTRUMENTAL VARIABLES
In a simultaneous equation system, some explanatory variables are correlated with the disturbances that is, the assumption Cov(ui,Xi) = 0 is violated. Frequently for
simultaneous equation systems, a researcher is only interested in estimating one of the structural equations within the system. In this case the method of OLS is inappropriate as it gives biased and inconsistent parameter estimates. An appropriate method for the estimation of a single structural equation is instrumental variables (IV). The idea of instrumental variables relies on finding a set of variables (called instruments) that are uncorrelated with the disturbances and that can be used to construct a “proxy” for the variable that is endogenous.
(iii) RECURSIVE ESTIMATION
References
Bardon, J., 1991. “1992: Some Banking Impacts”, Irish Banking Review, Spring, pps. 44-56.
Bayoumi, T. and Koujianou, P., 1989. Financial Deregulation and Consumption, IMF Departmental Memorandum.
Bayoumi, T., 1990. Financial Innovation and Consumption in the United Kingdom, IMF Working Paper No. 95.
Bayoumi, T., 1993. “Financial Deregulation and Household Saving”, Economic Journal, Vol. 103, No. 421, November, pps. 1432-1443.
Bourke, P. and Kinsella, R.P., 1988. The Financial Services Revolution - An Irish Perspective, Dublin: Gill & McMillian.
Boyle, G.E., 1982. Inflation and Consumption in Ireland Once Again, Central Bank of Ireland, Technical Paper No. 3/RT/82.
Bradley, J. and Fanning, C., 1984. Aggregate Supply, Aggregate Demand and Income Distribution in Ireland: A Macrosectoral Analysis, Economic and Social Research Institute, Paper No. 115, June.
Bradley, J., 1979. A Note on the Estimation of Disaggregated Consumption Functions, Central Bank of Ireland, Technical Paper No. 8/RT/79.
Browne, F., Blundell-Wignall, A. and Cavaglia, S., 1991. Financial Liberalisation and Consumption Behaviour, OECD Department of Economics and Statistics (International), Working Paper No. 81, March.
Campbell, J. and Deaton, A., 1989. “Why is Consumption So Smooth”, Review of Economic Studies, Vol. 56, pps. 357-374.
Campbell, J. and Mankiw, N.G., 1989. Consumption, Income and Interest Rates: Re-interpreting the Time-Series Evidence, National Bureau of Economic Research, Working Paper No. 2924, April.
Campbell, J. and Mankiw, N.G., 1991. “The Response of Consumption to Income: A Cross-Country Investigation”, European Economic Review, Vol. 35, No. 4, May, pps. 723-767.
Central Statistics Office. National Income and Expenditure (various), Stationery Office, Dublin.
Darby, J. and Ireland, I., 1993. Consumption, Forward Looking Behaviour and Financial Deregulation, Dept. of Economics, University of Strathclyde, Working Paper, July.
Davy, Kelleher and McCarthy, 1984. The Control of Banking in the Republic of Ireland, DKM Economic Consultants.
Deaton, A., 1992. Understanding Consumption, Oxford: Claredon Press.
Englund. P., 1990. “Financial Deregulation in Sweden”, European Economic Review, Vol. 34, No. 2/3, May, pps. 385-393.
Flavin, M., 1981. “The Adjustment of Consumption to Changing Expectations about Future Income”, Journal of Political Economy, Vol. 89, No. 5, October, pps. 974-1009.
Flavin, M., 1985. “Excess Sensitivity of Consumption to Current Income: Liquidity Constraints or Myopia”, Canadian Journal of Economics, Vol. 18, No. 1, February, pps. 117-136.
Frain, J., Howlett, D. and McGuire, M., 1995. A Note on the Estimation of the Consumption Function Within a Small-scale Econometric Model of the Irish Economy, Central Bank of Ireland, Technical Paper No. 4/RT/95.
Friedman, M., 1957. A Theory of the Consumption Function, Princeton NJ: Princeton University Press.
Gali, J., 1991. “Budget Constraints and Time-Series Evidence on Consumption”, American Economic Review, Vol. 81, No. 5, December, pps. 1238-1253.
Gart, A., 1984. The Insider’s Guide to the Financial Services Revolution, New York: McGraw-Hill.
Godfrey, L.G., 1989. Misspecification Tests in Econometrics, Cambridge: Cambridge University Press.
Hall, R.E., 1978. “Stochastic Implications of the Life Cycle-Permanent Income Hypothesis: Theory and Evidence”, Journal of Political Economy, Vol. 86, No. 6, December, pps. 971-987.
Hall, R.E. and Mishkin, F.S., 1982. “The Sensitivity of Consumption to Transitory Income: Estimates from Panel Data on Households”, Econometrica, Vol. 50, No. 2, March, pps. 461-481.
Hayashi, F., 1982. “The Permanent Income Hypothesis: Estimation and Testing by Instrumental Variables”, Journal of Political Economy, Vol. 90, No. 5, October, pps. 895-916.
Hayashi, F., 1985a. “Tests for Liquidity Constraints: A Critical Survey and Some New Observations”. Paper presented at the Fifth World Congress of the Econometric Society, Cambridge, Mass., August 18-24th.
Hayashi, F., 1985b. “The Effect of Liquidity Constraints on Consumption: A Cross-Sectional Analysis”, Quarterly Journal of Economics, Vol. 100, No. 1, February, pps. 183-206.
Hendry, D.F., Banerjee, A., Dolado, J. and Galbraith, J.W., 1993. Co-integration, Error-Correction, and the Econometric Analysis of Non-Stationary Data, New York: Oxford University Press.
Honohan, P., 1979. “Inflation and Consumption in Ireland”, Economic and Social Review, Vol. 10, No. 2, January, pps. 175-179.
Honohan, P., 1982. “A Bayesian look at Consumption”, Economic and Social Review, Vol. 13, No. 4, July, pps. 233-249.
Jappelli, T. and Pagano, M. 1989. “Consumption and Capital Market Imperfections: An International Comparison”, American Economic Review, Vol. 79, No. 5, December, pps. 1088-1105.
Kaufman, G., 1986. “Banking Deregulation in the United States”, Irish Banking Review, Autumn, pps. 66-85.
Kelleher, R., 1977. “The Influence of Liquid Assets and the Sectoral Distribution of Income on Aggregate Consumers’ Behaviour in Ireland”, Economic and Social Review, Vol. 8, No. 3, April, pps. 187-200.
Leddin, A. and Walsh, B.M., 1995. The Macro-Economy of Ireland, (3rd edition), Dublin: Gill & McMillian.
Llewellyn, D.T., 1986. “Financial Deregulation - The British Experience”, Irish Banking Review, Autumn, pps. 55-65.
McCarthy, C., 1979. A Study of Aggregate Consumers’ Behaviour in Ireland, Central Bank of Ireland, mimeo.
McGowan, P., 1986. “Competition in Irish Banking”, Irish Banking Review, Autumn, pps. 27-40.
Modigliani, F. and Brumberg, R., 1954. “Utility Analysis and the Consumption Function: An Interpretation of the Cross-section Data”, Post-Keynesian Economics, New Brunswick, NJ: Rutgers University Press.
Moore, M., 1987. “The Irish Consumption Function and Ricardian Equivalence”, Economic and Social Review, Vol. 19, No. 1, October, pps. 43-60.
Muellbauer, J. and Murphy, A., 1989. Why has UK Personal Saving Collapsed?, London: Credit Suisse First Boston Research Paper.
Murray, C.H., 1979. “Monetary Policy”, Central Bank of Ireland Quarterly Bulletin, Winter, pps. 71-76.
O’Reilly, L., 1983. “Quarterly Consumption Behaviour”, Central Bank of Ireland Quarterly Bulletin, Winter, pps. 84-100.
O’Shaughnessy, K., 1987. “Changes in the Financial Services Market”, Irish Banking Review, Winter, pps. 12-25.
Roche, M., 1995. “Testing the Permanent Income Hypothesis: The Irish Evidence”, Economic and Social Review, Vol. 26, No. 3, April, pps. 283-305.
Salkever, D.S., 1976. “The Use of Dummy Variables to Compute Predictions, Prediction Errors, and Confidence Intervals”, Journal of Econometrics, Vol. 4, No. 4, November, pps. 393-397.
Time Magazine, 1992. Japan’s Stock Woes Batter Other Markets, Time, August 3, pp. 21.
Whelan, K., 1991. “Ricardian Equivalence and the Irish Consumption Function: The Evidence Re-examined”, Economic and Social Review, Vol. 22, No. 3, April, pps. 229-238.
White, R.J., 1986. “Deregulation of the Australian Financial System”, Irish Banking Review, Autumn, pps. 5-14.
DISCUSSION
Patrick Honohan: I would like to congratulate Siobhan Lucey on a thorough econometric examination of an issue which is of considerable importance. She has focused on a manageable topic, applied an established and credible behavioural model to define a clearly stated hypothesis, and tested this hypothesis with an up-to-date and sophisticated statistical methodology.
Members of the society will have been struck by the contrast between the model of consumption behaviour used by the author and those with which we used to be familiar in years gone by. Absent are the standard list of explanatory variables - unemployment, inflation, the ratio of agriculture-to-non-agricultural incomes, the stock of liquid assets. In its place, a disarmingly simple variable: the rate of change of income.
What has happened, of course, is that this new(ish) approach to consumption asks a more limited question than the old studies. They were concerned with knowing what affected the level of consumption, or the rate of saving out of income. The new approach finesses much of the difficulty of that question by just asking “what affects the rate of growth of consumption”. Some authors who have used this new approach have derided earlier work for its ad hoc nature; fair enough, but although much of the newer work is based on a rigorous micro-economic foundation, where optimal household behaviour is derived using stochastic dynamic calculus, much of its predictions are limited to questions about rate of change. Solving the rigorous theory fully for the level of consumption has proved to be intractable except under very strong and over-simplified assumptions.
Provided consumers are endowed with both the foresight and the resources to do so, they will smooth their consumption over time, so that only unforeseen developments will influences the change in consumption. That is the nub of Lucey’s approach: if changes in consumption are correlated with partly predictable changes in income, then some consumers must be either short-sighted or liquidity constrained. Her preferred conclusion is that they are liquidity constrained, though she observes some weakening of the dependence of consumption changes on income changes, a trend which she interprets as a decline in liquidity constraints caused by financial deregulation.
I would have liked to see a bit more about the fit of the equations estimated. If we don’t pay attention to issues of fit and specification, there is a risk that tests of the alternative hypothesis will be contaminated by an under-specified or mis-specified basic equation. In this case the basic equation is shown in Table 2a: only one explanatory variable, with an R-squared of less than 0.4. Clearly a potential problem is that of omitted variables which are correlated with the included variable. For example, a less restrictive version of the model being employed by Lucey predicts that change in consumption will be correlated with interest rates. Any attempt to detect a shifting coefficient on the included explanatory variable could be greatly complicated by omitting the interest rates (even with the use of instrumental variables estimation). Besides, if some consumers are liquidity constrained, the determinants of the change in their consumption may include all sorts of things that could be correlated with income change. One major cross-country study of developing countries (Raut and Virmani 1989) found that including interest rates made the coefficient on income change insignificant.
In other countries, researchers have had access to micro-data allowing them to compare the consumption behaviour of those more and less likely to be liquidity constrained. Some surveys have asked whether the respondent has ever been refused credit; less directly one can infer that respondents holding substantial liquid assets are not liquidity constrained. Unfortunately the data needed to do that kind of micro analysis properly is not really available here.
Turning to the substance of the question at issue, namely whether consumers have been less liquidity constrained in recent years, I would agree with Ms. Lucey’s observation that a widening of interest rate margins need not necessarily reflect an increase in liquidity constraints - rather the contrary: deregulation of interest rates may be expected to result in a removal of rationing but at higher interest rates for certain categories of borrower. Incidentally, I could not match the rapid rise in interest rate spreads from 1986 plotted in Figure 4. My impression is that the recent rise in interest rate spreads was a lot more recent than. Anyway, the matrix of posted rates that is the basis for the official interest rate series quoted by the Central Bank has become increasingly unrepresentative, with a widening of quoted margins being accompanied by increasing price discrimination through off-matrix interest rates. I am afraid that these official rates are not reliable indicators of movements in the cost of credit or in bank margins. I believe that the Central Bank should follow the practice of other Central Banks in obtaining and publishing more detailed distributional data on interest rates showing the proportion of lending at different rates. Computerised information systems used by each bank should mean that the reporting of such data is not too burdensome. There is a legitimate public concern about such matters, and a public responsibility to find out the facts.
triggered by financial liberalisation? So far as the volumes of credit are concerned there is no doubt about the huge surge in personal sector bank credit during 1988-90, even for non-mortgage credit. This has been shown by Lucey in her Figure 1; not that the stock of such credit reached a new plateau at end 1990, at least until 1994. This paralleled developments elsewhere, and certainly could not have been accomplished had credit ceilings been binding in the period. But the 1988-90 surge should probably not be attributed to an immediate stock adjustment of private sector indebtedness triggered by liberalisation. For one thing the timing is wrong: the main liberalisations occurred well before 1988. I think that it would be safer to interpret the timing of the surge in borrowing (and associated decline in household saving rate) in terms of the public finance recovery, the turnaround in the economy, and also the cash pressure on the personal sector resulting from payments in respect of the tax amnesty.
Besides, the timing of the upturn in the major components of domestic spending follows the sequence: 1987-89 Exports; 1988-89 Consumption; 1989-90 Investment. The role of the consumption boom, partly financed by borrowing in a more liberal financial market, was supportive rather than an initiating factor.
Is liberalisation of consumer credit a good thing? My guess is yes, but bearing in mind the fact that surveys uncover many elderly people who have not made adequate saving provision for old age, and considering the role of fixed investment in generating growth, there is a remaining doubt. Jappelli and Pagano (1994, 1995) in a series of papers, assert that (despite the static distortions they create) liquidity constraints for households may be welfare improving at a world level, essentially because of their growth promoting characteristics. However, even their model acknowledges that any attempt to maintain household liquidity constraints by one country in a world of capital mobility is self-defeating.
References
Hayashi, F., 1987. “Tests for Liquidity Constraints: A Critical Survey and Some New Observations”, in T.F. Bewley, ed. Advances in Econometrics: Fifth World Congress (Cambridge: University Press), 2, 91-120.
Jappelli, T. and M. Pagano, 1994. “Saving, Growth and Liquidity Constraints”, Quarterly Journal of Economics, 109, 83-109.
Jappelli, T. and M. Pagano, 1995. “The Welfare Effects of Liquidity Constraints”, CEPR Discussion Paper.
***
Michael Casey: I am glad to have the opportunity to respond to this excellent paper by Ms. Lucey. I would like to make a few very general points at the outset.
1. The subject matter of this paper is very important indeed since it goes beyond financial deregulation to the heart of economic policy. What are the main determinants of consumer behaviour and to what extent, if any, can these determinants be influenced by macro policy? Needless to say, this gets us very quickly into the area of Ricardian Equivalence and expansionary fiscal contraction.
2. It is heartening to see a bit of good old-fashioned hypothesis testing again. It seemed for a while as if the high priests of econometrics (Hendry et al) had so “raised the ante” of verifiability that they scared off many would-be empiricists. Fortunately, Ms. Lucey was not scared off.
3. To a large extent the paper deals with rational expectations (RE) - a theorem which some regard as rather colourful. However, I believe that RE will not go away. It may ultimately “settle down” as “modified” RE. The reason it won’t go away is because, unlike the hard sciences where the molecules don’t talk back, in the social sciences the molecules i.e. individual human beings and groups, certainly do talk back. The best-laid central plans of Governments have often been confounded by the sheer recalcitrance of human beings!
Now, to the paper itself: The central question being asked is whether Irish consumers respond on the spur of the moment to changes in income or whether they take a more reflective, long-term view of their after-tax income stream. This is an important question because if it is found that consumers are mainly of the reflective type (i.e. rational expectations/ permanent income etc.) then they are going to see through a fiscal stimulus (say) and reduce consumption on the grounds that they will have to pay the piper later on. Thus Government policy will fail and Keynesian manipulation will be negated.
Ms. Lucey finds that 43 per cent of Irish consumers are thoughtful and reflective and that 57 per cent are spur of the moment or “rule of thumb” types as she describes them. I find this conclusion entirely plausible although a little disappointing since it means that most people allow themselves to be fooled most of the time! In fact, given the standard error of the Lambda coefficient, the rule-of-thumb types could be as high as 80 per cent plus.
words if people receive an increase in income they may be so poor that they have to spend it today even if they sense it may be taxed off them tomorrow. Perhaps, more rationality or thoughtfulness can be afforded where discretionary expenditure in concerned. I wonder if the author has given thought to the effect of overall living standards and/or the distinction between essential spending and the more discretionary kinds of spending. Could we assume, for example, that consumer durables would be a good proxy for discretionary spending? Would more people be more rational where durables were concerned?
Another reason; for many people in secure salaried jobs actual income may be much the same as permanent income. This could also help to explain the excess sensitivity puzzle. But one important question arises here: how will the pattern of consumption change in future in response to casualisation of the labour force. If the latter becomes pervasive then one might expect more consumers to become more “thoughtful” about the future as their income becomes more “transitory”.
The other main question which the author attempts to answer is whether the period of credit controls in some way prevented consumers from behaving rationally. Specifically, did the lifting of these controls allow the consumer more freedom e.g. by easier access to borrowing, to optimise his or her consumption. The author finds no significant evidence for this.
Again, I find this a plausible result for the following reasons:
First, I’m not sure that credit controls were all that effective. Bigger borrowers could go abroad for credit. Smaller borrowers could go to other non-bank institutions or to the affiliates of the banks themselves. This could have meant price rationing of course. Hire purchase was quite popular in that period too, although partly constrained.
Second, credit guidelines themselves changed throughout the period in terms both of coverage and intensity. For example, in 1965 they applied only to the associated banks and were later extended to the non-associated banks. Moral suasion was employed up to 1978 when special deposits were introduced. Specific personal lending guidelines were introduced in 1970. Formal guidelines were replaced by indicative ones in 1984, and so on. [In passing I was interested to note that A. Leddin found selective credit controls to have been effective in stimulating investment at the expense of consumption. At the time, the academic community told us that, because of fungibility of money etc., this policy could not work.]
argued that that splurge in consumption in the UK was almost entirely caused by rule-of-thumb behaviour hyped-up by an advertising campaign on the part of financial institutions. Thus it could be quite wrong to assume that financial deregulation helps consumers to be more rational, take a longer view etc. In principle it can work that way but in practice it may not. As capital markets improve and as the consumer can more readily liquidate his or her capital assets we should see some consumption-smoothing but if the process happens suddenly we might see discrete jumps in consumption.
Fourth, Irish people have a relatively high savings-ratio. These savings would be reasonably liquid for the most part. Consequently the long-term smoothing of consumption can be done by using the savings cushion rather than by borrowing (say). The poor of course don’t have savings but then they have little or no borrowing ability either. It is no surprise that unemployed people are rule-of-thumb consumers.
Some minor points:
• I think the personal credit series shown includes mortgage credit. It might have been better to exclude the mortgage component.
• Figure 4 on bank margins “Borrowing rate minus lending rate”: Presumably this should be “Lending rate minus deposit rate”? More substantively however, it is not clear how the adjustment for inflation was carried out. It is hard to imagine this margin being slightly positive in the early 80s when inflation was running at around 15 per cent.
• I could not find the standard error of the regression equation but all the other tests seemed OK - apart from the R2.
Reply by Siobhan Lucey: I would like to thank the Statistical and Social Inquiry of Ireland for giving me the opportunity to present this paper. I would also like to thank the discussants of the paper, Patrick Honohan and Michael Casey, for reading my paper and providing valuable comments. Finally I would like to thank the Barrington audience for their attention and their constructive comments.
I ended my presentation by suggesting the various areas in which I intended to extend my research. While this was excluded from my paper, it is useful to have the opportunity to state these here. First, I intend to further examine the robustness of the results and in particular the inference on financial deregulation to disaggregating consumption into durables, non-durables and services. Second, it may be informative to carry out some analysis of the sensitivity of the results to alternative instruments. The choice of instruments used in the IV estimation of equation 4b is primarily based on previous international research, for example Browne et al. (1991). Finally, a major extension which I am now working on is how changes in the composition of income streams accruing to the personal sector might affect consumption behaviour. This final strand has to some extent been explored in the context of agricultural and non-agricultural incomes as Patrick Honohan notes. However, more recently the sometimes erratic behaviour of financial assets and perhaps the increasing casualisation of the labour force (as noted by Michael Casey) pose new questions on the transitory versus permanent nature of income. I am hopeful that a number of the comments made by the audience and by the discussants may be addressed by looking at these areas.
Miriam Hederman commented on reregulation and its potential consequences for consumers. With deregulation and its consequent removal of regulations and guidelines, the soundness of financial markets and the solvency of financial institutions was called into question. A number of international markets that undertook significant deregulation measures experienced failures of financial institutions in th