Filtering and Scalability in the ECO Distributed Event Model
Mads Haahr and Ren´e Meier and Paddy Nixon and Vinny Cahill
Distributed Systems Group
Department of Computer Science
Trinity College Dublin, Ireland
fMads.Haahr, Rene.Meier, Paddy.Nixon, [email protected]
http://www.dsg.cs.tcd.ie/
Eric Jul
Distributed Systems Laboratory
Department of Computer Science
University of Copenhagen, Denmark
http://www.diku.dk/distlab/
Abstract
Event-based communication is useful in many applica-tion domains, ranging from small, centralised applicaapplica-tions to large, distributed systems. Many different event models have been developed to address the requirements of dif-ferent application domains. One such model is the ECO model which was designed to support distributed virtual world applications. Like many other event models, ECO has event filtering capabilities meant to improve scalability by decreasing network traffic in a distributed implementa-tion. Our recent work in event-based systems has included building a fully distributed version of the ECO model, in-cluding event filtering capabilities. This paper describes the results of our evaluation of filters as a means of achiev-ing increased scalability in the ECO model. The evalu-ation is empirical and real data gathered from an actual event-based system is used. The findings show filters to be highly valuable in making distributed implementations of the model scale, that multicast contributes to the scalabil-ity and, perhaps most signifcantly, that multicast groups can be dynamically generated from filters using local (per node) rather global knowledge of the distributed application.
1. Introduction
Event-based communication is appropriate for many ap-plication domains, ranging from small, centralised
appli-cations such as GUIs to large, distributed systems such as telecommunications, network monitoring, and virtual world support systems. Many different event models have been put forward, some designed for small-scale systems and others for large-scale systems. One such model is the ECO model which was designed to support distributed virtual world applications in the Moonlight ([6]) project. Like many other event models ([9, 5]), ECO was designed to be scalable by including filtering capabilities that were in-tended to decrease network traffic in a distributed imple-mentation.
Our recent work in event-based systems has included building a fully distributed version of the ECO model, including filtering capabilities. This paper describes the model and our implementation of it, as well as the experi-ments conducted to evaluate filtering as a means of increas-ing scalability. The experiments are based on empirical data from an actual event-based system. This data is used to per-form three simulations of the original system to evaluate the performance implications of using filtering and the impact of using unicast or multicast communications. The results show that filtering coupled with multicast communications can substantially decrease network traffic and thus enhance scalability. Significantly, we also demonstrate that multicast groups can be constructured from filters without need for global knowledge about the distributed application, demon-strating a further programming level benefit from filters.
2. The ECO Model
As event models go, the ECO model is relatively sim-ple. It has only three central concepts and its application programmer interface (API) contains only three operations. The intent of the model is that it is applied to a given host language and extends that language’s syntax and facilities as to support the ECO concepts. This section describes the ECO concepts and operations, paying special attention to notify constraints which are the model’s event filters.
As mentioned, the ECO model was originally designed for use in virtual world support systems. This is reflected in the terminology used to describe ECO. Thus, the term an ECO world means whatever collection of entities constitute the application in which the model is being used. For a detailed description of the model, please refer to [12, 7].
2.1. Concepts
The acronym ECO stands for events, constraints, and objects—the three central concepts in the event model:
Objects in the ECO model are much like objects in a
stan-dard object-oriented language. However, instead of in-voking other objects for communication ECO objects communicate with other ECO objects via events and constraints as explained below. ECO objects are of-ten implemented as programming language objects but not all programming language objects are necessarily ECO objects. In order to distinguish the two, ECO objects are often referred to as entities. Entities have identifiers that are unique within an ECO world and they may contain threads of control.
Events are the only means of communication in the model.
Entities do not invoke each other’s methods directly but instead raise events which may, or may not, lead to other entities’ methods being invoked. Any entity can raise an event. Events are typed and have parameters, and they are propagated asynchronously and anony-mously to the receiving entities in no particular order. The type of events is usually specified using the type system of the underlying language.
Constraints make it possible for entities to impose
restric-tions upon which events they actually receive. The ECO model specifies several types of constraints of which the central one in a scalability context is notify constraints. Notify constraints can be used by an entity to specify what events it is interested in receiving no-tification about. Notify constraints effectively consti-tute filters as they are known from other event models ([9, 5]). Other types of ECO constraints are pre, post, and synchronisation constraints. However, they are not
interesting for event filtering and will not be discussed further in this paper.
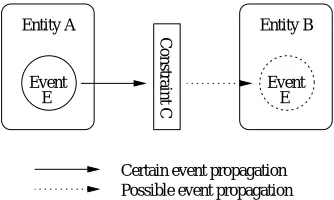
The three concepts are shown in relation in figure 1 which depicts a simple scenario with two entities commu-nicating. In the figure, entity A raises an event which may, or may not, reach entity B because of the constraint C. The constraint is imposed by entity B. The raising of an event can be thought of as an announcement to the rest of the ECO world that the event has occurred. A notify con-straint can be thought of as a filter that decides whether or not a given entity is to receive the event, and receiv-ing an event can be thought of as invokreceiv-ing an appropriate method (called an event handler) of an entity in response to the event. When an entity uses a notify constraint to enable it to receive certain events, we say that it subscribes to those events. An entity can subscribe multiple times to the same events using different constraints and handlers. It is also possible to subscribe without using a constraint, in which case no filtering is performed.
Event Entity A Constraint C
E E
Entity B
Event
[image:2.595.344.511.324.424.2]Certain event propagation Possible event propagation
Figure 1. The Three ECO Concepts in Relation
2.2. Operations
The model’s API contains three operations which are used by entities to communicate:
Subscribe(eventType,eventHandler,constraint)
is used by entities to register interest in events. An entity that subscribes to a certain type of event will receive an invocation of one of its methods when a matching event is raised. The event is delivered to the entity by being passed as a parameter to the handler. When an entity performs a subscription, it can also choose to specify a constraint. An event must be of the right type and must match the constraint (if any), in order to be delivered to a particular subscriber.
Unsubscribe(event-type, event-handler)
is used by an entity to cancel an existing subscription.
3. Scalability of Distributed ECO
Implementa-tions
The ECO model as such is neither centralised nor tributed but can be implemented in a centralised or dis-tributed manner. A disdis-tributed implementation has the ad-vantage that new nodes (typically in the form of physical machines) can be added in order to accommodate a larger number of entities. On the other hand, distributing the ECO implementation across a number of nodes means that enti-ties on different nodes will need to exchange events as well as subscription and unsubscription information across ma-chine boundaries. The amount of communication across node boundaries depends not on the number of entities but on the level of activity, i.e., on the number of subscriptions performed (and canceled) and the number of events raised.
3.1. Scalability
The term scalability has become something of a buz-zword in the computer industry. There is no generally ac-cepted scientific definition of what exactly scalability is, and people tend to rely on an intuitive understanding of the con-cept instead. Textbooks generally provide rather vague def-initions and rely on examples to explain it. One of the more tangible definitions was made in connection with distributed garbage collection,
Scale is a relative concept that is hard to charac-terize precisely; rather we define scalability as a property related to an algorithm: it is scalable if its cost increases much slower than the number of spaces or of sites in the system. ([11])
Though somewhat specific to distributed garbage collec-tion, the definition makes the important observation that scalability is an algorithmic issue. To make the definition more general, spaces and sites should be interpreted accord-ing to the underlyaccord-ing domain. In a distributed ECO context, the following parameters are considered when discussing scalability:
number of entities (or objects)
number of nodes (or machines)
activity (communication)
These parameters are not mutually independent. As mentioned, for example, a common means of scaling (i.e., supporting a large number of) entities is to add more nodes
to the system. This, however, causes more communication between nodes. Hence, improving scalability in one way may decrease it in another. This is a common dilemma in distributed systems; the greater the degree of distribution, the more communication. Therefore, any means of reduc-ing unnecessary communication is valuable.
4. SECO - a Distributed ECO Implementation
The implementation was named SECO for Scalable ECO. It uses C++ as the host language. The ECO exten-sions take the form of a library with which an application using event communication is linked. There is also a series of header files which contain abstract C++ base classes for events, constraints, and entities, in addition to prototypes for the actual ECO operations. Two implementations are discussed: a unicast version (uSECO) and a multicast ver-sion (mSECO).
4.1. Overview
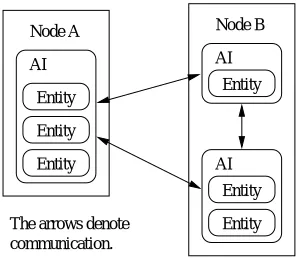
The architecture of the SECO implementation is based on the concept of Application Instances (AIs). An AI is im-plemented as a program running on a node in the network. It hosts a number of entities and relays events raised by them to other AIs. An AI also receives events from other AIs and delivers them to its own entities. A scenario with six enti-ties hosted by three AIs running on two nodes is shown in figure 2.
Entity AI
Entity Entity AI Node B
Entity Entity Entity Node A
AI
[image:3.595.353.502.454.583.2]The arrows denote communication.
Figure 2. Scenario with Nodes, Application Instances (AIs), and Entities.
fashion without further impact on the rest of the SECO im-plementation.
In mSECO, since multicast communication does not re-quire the sender to know the number of receivers, global knowledge of the SECO entities is not necessary thus elimi-nating the AIR. The number of event messages and manage-ment (overhead) messages sent will be reduced. In uSECO, an AI that raises an event propagates a copy of the event to each subscriber, whereas in mSECO a single multicast message is sent only. The same applies for management messages. Instead of having to send a copy of a manage-ment message to each AI, a single broadcast (implemanage-mented as a well-known multicast group) message is sent.
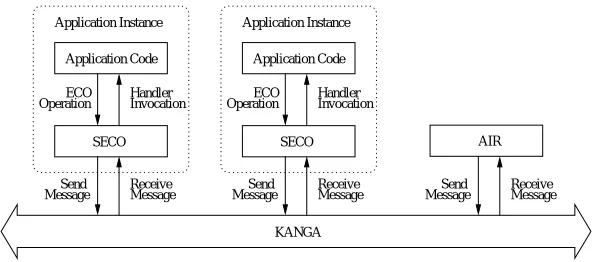
Entities hosted by an AI invoke the SECO operations to make and cancel subscriptions and to raise events. The SECO library relays subscriptions, unsubscriptions, and events to remote AIs as appropriate (e.g., subject to filter-ing constraints) and delivers events obtained from remote as well as local entities to the entities that it hosts by in-voking their handlers. The SECO library uses a com-munications package called KANGA ([2]) to communi-cate with other AIs over the network. KANGA imple-ments a convenient class-oriented front-end to the transport layer (TCP/IP) based on connection endpoints rather than hostnames and ports. Unlike TCP, KANGA is message-oriented and includes marshalling operations for all stan-dard C++ types. Figure 3 shows how the components in a SECO application communicate. Note that, for reasons stated above, the AIR is not needed in the mSECO imple-mentation.
The SECO implementation performs not only the task it is explicitly built for—in this case implementing the ECO model—but also the task of keeping track of itself as a distributed application. With regards to implementing the ECO operations (propagating subscriptions, unsubscrip-tions, and events) the implementation is fully distributed. Messages pass directly from peer to peer; there is no cen-tralised “event server” and therefore no single point of fail-ure. With regards to distribution management, it should be noted that the current version of the AIR is centralised and therefore a single point of failure. However, it is used only for maintaining the set of currently active AIs. In particular, it has no influence on event flow or filtering and is therefore of no interest to the findings described in this paper.
4.2. Latecoming Entities
When an entity joins an ECO world that already exists, there may be subscriptions in place that the new entity does not know about. ECO semantics specify that old subscrip-tions should apply for new entities, and therefore new enti-ties need to obtain information about the subscriptions cur-rently in effect. The solution adopted in the SECO
imple-mentation is to let the AIs holding entities with active sub-scriptions resend the subsub-scriptions to new AIs.
4.3. Implementation and management of the
multi-cast communication
mSECO’s multicast layer is implemented based on IP multicast, providing a means of one-to-many group com-munication. IP multicast uses UDP as its transport layer and thus is a connectionless best-effort (unreliable) service. A reliable transport layer can be build on top of IP multi-cast. mSECO uses a hash algorithm to generate multicast groups. The hash operation is invoked on the consumer side for each subscription sent and on the raising side for each subscription received. The IP group address is calculated by the hash function on the event type and the event filter (i.e., the notify constraint). This enables entities to manage their group memberships based on a local decision, avoiding a centralised component, and hence a single point of failure.
The success of this approach depends on the efficiency of the chosen hash algorithm and on the size of the available multicast group address space. The hash algorithm used in mSECO is an adaptation of one proposed in [10, p.212] which generates a unique key from a sequence of charac-ters of arbitrary length and spreads the keys evenly into the multicast group address space. The exact efficiency of var-ious hash algorithms is beyond the scope of this paper, but the algorithm may easily be replaced by another. The cur-rently available IP multicast address space consists of up to 28 bit address and a 16 bit port number. Although the IP multicast address space may have to be shared with other applications, the rather large number of available multicast group addresses ensures that our approach suffices even in large-scale systems that include many different event types and notify constraints.
5. Simulating a Real-time System
Our experiments consist of running simulations on data from an actual real-time event-based system found at the University of Cambridge. The experiments and conclusions presented in this paper are based on empirical event data ob-tained from the Cambridge system. This section describes the system and our simulation of it.
5.1. Active Badge System
Message ReceiveMessage
ECO
Send
Application Code
Invocation Handler ECO
Operation Operation
Send
Message MessageReceive AIR
Receive Invocation Handler
Send
Message Message Application Code
SECO Application Instance
KANGA Application Instance
[image:5.595.150.446.76.207.2]SECO
Figure 3. Communications in a SECO Application
this particular badge has been seen in that particular loca-tion. Stations are grouped into networks, each being a part of a particular laboratory. In addition, users can also be de-tected when they log into the campus computer network, e.g., via an X-terminal. Each badge carries a unique badge identifier which is picked up by the sensors. Certain kinds of equipment, such as workstations, X-terminals, and some network devices, also have badge identifiers associated with them and can cause sighting events to be raised.
The empirical data that we have obtained from the sys-tem consists of 35,811 sighting events collected over pe-riod of almost 21 hours by 118 stations distributed over 12 networks. For each sighting, the following information is available:
Station Identifier identifying the network (by a symbolic
name) and the station (by an integer) within that net-work.
Badge Identifier identifying the sighted person or
equip-ment (by a sequence of six eight-bit hexadecimal num-bers separated by dashes).
Time stamp identifying the moment when the
sight-ing was made in seconds and microseconds, since 00:00:00 UTC, January 1, 1970.1
The experimental strategy is to replay these sightings in a simulation. We represent each station as an ECO entity that raises the sighting events recorded in the Cambridge data at the appropriate times, as measured by the local system clock.2 The simulation and its configuration are described in the following sections.
5.2. Hardware Configuration
Our testbed consists of five PCs with a minimum of 16 megabytes of memory, running FreeBSD and connected
1As returned bytime(3).
2Recall that the ECO model makes no requirements to event ordering,
and we can therefore disregard clock variations between nodes.
with a standard 10 Mbit/s Ethernet. Because we measured bandwidth usage on a per message basis (as opposed to, e.g., roundtrip times) the experiments were run in multiuser mode. Also, the machines were on a network segment with traffic not related to the experiments. The native compiler, GCC 2.6.3, was used to compile the programs.
5.3. Software Configuration
In the simulation, each of the twelve networks in the real badge system is represented by one AI as shown in figure 4 located on a single node (hogthrob). Four of the five nodes (janis, zoot, statler,anddown) are used to run AIs which act as event consumers.
To measure network traffic as a function of the number of AIs, some of our experiments (2 and 3) are run in four configurations. Configuration A uses only one consumer node, configuration B uses two, and so on. This is illustrated in figure 4 where the four consumer AIs are marked with the configurations in which they are active.
All configurations of all experiments have two character-istics,
1. Event subscribers and consumers are held on disjoint AIs.
2. All AIs hosting event-generating entities outlive those with subscribing entities.
Given knowledge of the implementation, this configu-ration makes it relatively easy to calculate administconfigu-ration overhead caused by distribution and filtering. Whereas the latter is extremely relevant for the evaluation of filtering as a means of scalability, the former can be assumed to be equiv-alent to a distributed ECO implementation without filtering and is therefore of little concern for this paper. A discussion can be found in [3].
(config A, B) (config A)
Event Flow (config A, B, C)
(config A, B, C, D) Subscriber statler Subscriber ORL-Net#6 Subscriber 42 Subscriber 40 2 4 41 11 15 8 17 6 43 48 ORL-Net#7 ORL-Three#8 14
2 3 4 5 7
20
8 9 10 11 1
19 20 21 22 25 27 28 29
30 31
4 5 6 7 8 11 12 13 14 15 16 17 18 25 26 32 ORL-Three#9 ORL-Net#1
9
6 51 52
53 54 55 58
16 ORL-Net#2
Subscriber
45
15 16 17 18 19 20 21 22 23
30
ORL-Net#4 27 33 34 35 36 37 38 57
ORL-Net#5 24 25 26 29 30 31 39 49
50 59 106
108 109 111 114 116 CL-ArupExtn#8
83 82 81
70 72 73 74 75 76 CL-ArupMain#8
ORL-HOME#5 1
ORL-Net#0 11 12 22 23 24 25 56 60 61 62 63
[image:6.595.98.504.75.393.2]hogthrob n Station n n ... Application Instance ... Node Subscriber Subscriber 2 Application Instance ... Application Instance ... Application Instance ... Application Instance ... down zoot janis Subscriber 10 14 Legend:
Figure 4. Badge System Simulation Overview
during the application’s lifetime, the total number of extra messages due to filtering for unicastN
u filtering and for multicastN
m filtering can be written as,
N
u filtering
(m;n) = mN
subscription (n)
N
m filtering
(m;n) = mSubscription
where N
subscription is the number of extra messages sent for a single subscription and in N
m filtering. Subscriptionis the number of messages generated by a subscription and is independant ofn.
To derive N
u filtering in the given configuration, all subscribing entities are hosted by a single AI. Subscriptions will be sent to all other instances and the total number of messages transmitted over the network for any particular subscription can be computed easily. Ifn
sis the number of AIs at subscription time, the number of subscription mes-sages (and replies) sent is,
2(n s
1)
At unsubscription time, the number of AIs may have changed. Assuming it is calledn
uand that there is an un-subscription for each un-subscription, the total number of
sub-scribe/unsubscribe messages is,
2(n s
1)+2(n u
1)
In the configuration used in our experiments, the AIs with event-generating entities always outlive the one with the subscriber, so for this particular case we have n
s =
n
u. Setting
n = n
s
= n
u the total number of sub-scribe/unsubscribe messages is,
N
subscription
(n)=2(n
s
1)+2(n u
1)=4(n 1)
Insertion into the earlier formula forN
u filtering gives us,
N
u filtering
(m;n)=mN
subscription
(n)=4m(n 1)
Moreover, forN
m filteringwe simply argue that there is a message due to subscribe and a message due to unsubscribe for each subscription, giving us 2 messages per subscription and hence:
N
m filtering
(m;n)=2m
6. Three Experiments
In practice, the complete event flow through an active badge system is large and difficult to comprehend. Sub-scribers with well-chosen notify constraints can be used to provide meaningful views of this event flow by dynami-cally extracting events according to certain patterns, and in this way make it easier for humans to monitor the sys-tem at runtime. The three experiments presented in this chapter were designed to present such meaningful views of the event flow and would be likely candidates for imple-mentation in a real (non-simulation) badge system. Each experiment features one type of subscriber. Some experi-ments feature a subscriber which can be given parameters and which filter events according to their values. Such sub-scribers were run with all possible sets of parameters. For each experiment we list the number of event messages sent in the absence of filtering, the number of event messages ac-tually sent, and the number of overhead messages caused by subscriptions (calculated according to the formulae3from
the previous section). Finally, the total number of messages actually sent (including overhead messages) is listed, along with the relative decrease in number of messages sent due to event filtering.
6.1. Experiment 1: God
The God entity sees all and hence receives all events. In a real badge system, such a subscriber could be useful for logging purposes. Here it is also used to measure filtering overhead by implementing a filter without effect. Table 1 shows the results from the experiment.
The reduction in number of messages is negative, mean-ing that usmean-ing this filter (not suprismean-ingly) introduced a slight overhead. However, in the experiments it was as low as 0.01%. It is important to look at the scenario in which this result was obtained. Overhead in the form of extra network messages is generated at subscription and unsub-scription time but not while the subunsub-scription is in effect. In experiment 1, there was only one subscription involved and it was in effect for a very long time (time enough to raise 35,811 events). Consequently, the relative cost decreased as more and more bandwidth was used for other purposes. We conclude that long-lasting subscriptions have a relatively low overhead. No significant difference was noted between uSECO and mSECO in this experiment.
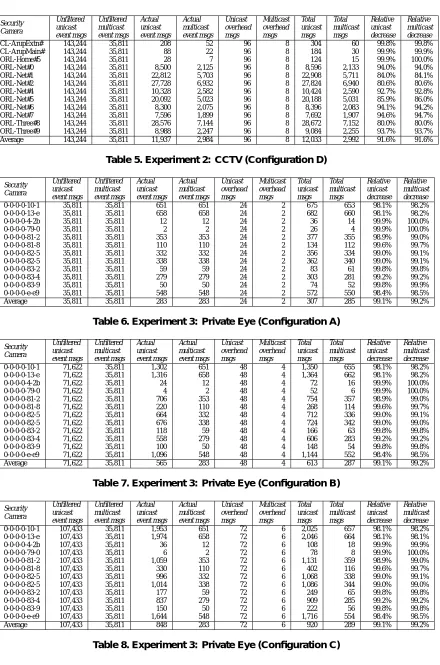
6.2. Experiment 2: CCTV
A number of CCTV entities subscribe to all events gen-erated in a particular network. In a real system, it could be
3Apply appropriate multiplier as per previous observation.
used to monitor a specific (and therefore more manageable) area of the entire system. This experiment was run with twelve subscribers in parallel, one for each network. The results are displayed in tables 2, 3, 4, and 5.
As can be seen, the reduction in number of transmit-ted messages is quite high: above 90% on average. Had events simply been broadcast instead of filtered, approxi-mately ten times as many messages would have been trans-mitted across the network. Even the most busy camera only received 20% of the messages it would have received if fil-ters had not been used. As in experiment 1, these subscrip-tions were in effect for a long period of time, and the fixed administration overhead of 24 messages in uSECO and 2 messages (per camera) in mSECO gradually became less and less significant as more events were raised.
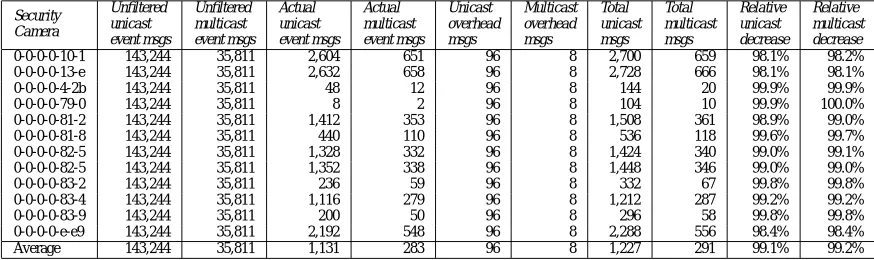
6.3. Experiment 3: Private Eye
The Private Eye entity subscribes to all events generated by a particular badge. In a real system, this subscriber could be used to trace the movement patterns of a particular badge owner. This experiment was run with at least 12 (out of a possible) 162 subscribers in parallel, one for each badge present in the event data. An extract of the results (twelve private eye entities) is shown in tables 6, 7, 8, and 9. For the remaining data, please refer to [3].
The data shows substantial savings, averaging just above 99.0% reduction in the number of messages transmitted across the network. The private eye entities in this experi-ment collectively get all sightings of registered badges. The busiest of the badge-wearers caused 658 sightings and still received only 2% of the messages it would have received if filters had not been used.
6.4. Overall Conclusion
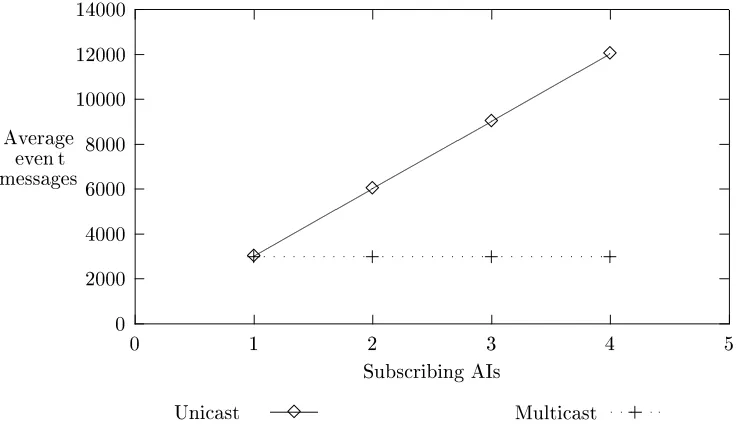
Figure 5 shows the average number of event messages sent depending on the number of subscribing AIs, accord-ing to the data found in experiment 2. A similar graph could be depicted based on the data that resulted from experi-ment 3. For the uSECO experiexperi-ment, the number of event messages sent increases linearly to the number of subscrib-ing AIs. Whereas, the mSECO experiment found that the number of event messages sent is independent to the num-ber of subscribing AIs. Furthermore, the graph shows that the number of overhead messages, although reduced in the mSECO experiment, do not contribute significantly towards the number of event messages sent.
0 2000 4000 6000 8000 10000 12000
0 1 2 3 4 5
Average
event
messages
SubscribingAIs
Unicast 3
3
3
3
3
Multicast
+ + + +
[image:8.595.99.467.83.295.2]+
Figure 5. The summary graph of experimental data
To what extent these findings can be expected to hold for other applications of course depends on the applications in question. The application in this scenario used subscrip-tions which were in effect for a fairly long time. Appli-cations with frequent subscriptions (and cancelling of sub-scriptions) will benefit less from using notify constraints, but for the active badge system constraints were extremely useful. The next section discusses three other event models, two of which contain filters and one of which does not.
7. Related Work
In this section, we look closer at three state-of-the-art event models. Two of them are from industry and one is a research model. They are targeted for different applica-tion domains and therefore have different characteristics. A more detailed discussion of the three models, in particular in the context of ECO, can be found in [3].
7.1. JavaBeans
Java is an object-oriented programming language, rem-iniscent of C++, which has become increasingly popular since it was launched by Sun in the mid 1990s. JavaBeans is a component model for Java also developed by Sun, and version 1.01 of the JavaBeans specification ([13]) defines an event model. The model is designed with small centralised systems (e.g., window toolkits) in mind but can be used in a distributed fashion by using the Java Remote Method In-vocation (RMI) system.
The model has no inherent filtering support. The event source and receiver are tightly coupled, compared to other models, and must maintain detailed knowledge about each other. The model specifies that the source of an event should invoke receivers in sequence, passing its thread of control to each receiver. These semantics mean that implementations of the model cannot benefit from network level multicast. In its current form, the model will not scale to be used in any distributed environment of substantial size.
7.2. CORBA Services
The Common Object Request Broker Architecture (CORBA) is a middleware architecture specificied by the Object Management Group (OMG). The architecture is based on the idea of using Object Request Brokers (ORBs) as a common way for different systems to perform remote procedure calls (RPCs). In addition to ORB functional-ity, the CORBA 2.0 specification ([8]) describes a number of general-purpose services, one of which is the CORBA Event Service. Applications using this service can com-municate using events in addition to the normal RPCs pro-vided by the bare ORB. Moreover, work is currently on-going within the OMG to define a Notification Service to extend the event service with event filtering capabilities.4
The CORBA Event and Notification Services have been designed to be usable in virtually any setting where event-based communication is required. The pending Notifica-tion Service proposal, effectively a superset of the Event
4The OMG Technical Committe initiated the adoption vote on
Service, constitutes an extremely general event model with powerful filtering capabilities based on filters expressed in an interpreted language. It is difficult to imagine a dis-tributed event-based application that could not fit into this model. However, the generality is paid for by an increase in complexity—understanding and using the CORBA event model is difficult, and a correspondingly high development cost can be expected for applications using it.
7.3. Cambridge Event Model
The event model described in [1, 4] was developed at the University of Cambridge Computer Laboratory. Like the CORBA model, it has filters which are expressed in an in-terpreted language. The Cambridge model is architecturally much simpler than the CORBA model, but has a feature not present in the other, namely that of event composition. The idea is that subscribers can register interest in the occur-rence of events, subject to restrictions on the order in which they occur. For example, it is possible to register interest in an event, only if it has been (or explicitly has not been) preceded by another. The composite event language is rem-iniscent of regular expressions and can be used to form very complex filter expressions.
In general, the Cambridge model is less flexible than the CORBA service but also a lot less complex. Its principal strength is that it has native support for composite event fil-ters, a powerful feature which has yet to be discovered by industry. Like the CORBA model, but unlike the JavaBeans model, it is designed for large-scale systems.
7.4. Summary
The three event models discussed here are different in many respects. The CORBA and Cambridge models share some similarities in that both are designed for large-scale systems and both have excellent filtering support. In com-parison, the JavaBeans model is well suited for centralised or small-scale distributed applications but has no inherent support for filtering.
8. Conclusion
The initial discussion about scalability identified three parameters in the ECO model, one of which (number of entities) could be scaled by scaling the second (number of nodes) at the cost of decreased scalability of the third (ac-tivity). In any large-scale distributed event system, activity is probably the parameter which is most difficult to scale. New nodes can be added practically ad inifinitum but they all have to exchange events over the same network. Reduc-ing network traffic is therefore an important way of scalReduc-ing activity in any such system.
Our work has shown filtering to be an extremely pow-erful means to save network bandwidth in an event-based system as demonstrated in the results obtained over unicast, and consequently a feasible way to dramatically increase scalability. We have also shown that the introduction of multicast communications produces a further improvement in scalability from the network traffic perspecitive.
Of at least equal significance is our demonstration that a high level description of constraints can be used to generate multicast groups. In doing this we are masking out lower level network decisions from the designer.
Furthermore, because the experiments were conducted with data from a real event-based system, we claim the re-sults to have practical relevance and expect them to hold for similar event-based systems outside the laboratory. Indeed, a sign that the industry is becoming aware of the impor-tance of event filtering is the OMG’s initiative to augment their event service with filtering capabilities. ([9]).
Acknowledgements
We would like to thank IONA Technologies and The Irish Higher Education Council for their financial support.
References
[1] J. Bacon, J. Bates, R. Hayton, and K. Moody. Using Events to Build Distributed Applications. In Proceedings of the 1995 Second International Workshop on Services in Dis-tributed and Networked Environments (SDNE’95). Univer-sity of Cambridge Computer Laboratory, 1995.
[2] G. Burke. Kanga: A framework for building application spe-cific communication protocols. Master’s thesis, Department of Computer Science, Trinity College Dublin, Ireland, Sept. 1996.
[3] M. Haahr. Implementation and Evaluation of Scalability Techniques in the ECO Model. Master’s thesis, Department of Computer Science, University of Copenhagen, Denmark, August 1998.
[4] R. Hayton. OASIS, An Open Architecture for Secure Inter-networking Services. PhD thesis, University of Cambridge, March 1996. Technical Report TR399.
[5] R. Hayton, J. Bacon, J. Bates, and K. Moody. Using Events
to Build Large Scale Distributed Applications. In
Pro-ceedings of the Seventh ACM SIGOPS European Workshop, pages 9–16. Association for Computing Machinery, Septem-ber 1996.
[6] T. T. Moonlight. VOID shell specification. Project Deliver-able Moonlight Del-1.5.1, Distributed Systems Group, De-partment of Computer Science, Trinity College, Dublin 2, Ireland, Mar. 1995. Also technical report TCD-CS-95-??, Dept. of Computer Science, Trinity College Dublin. [7] K. O’Connell, T. Dinneen, S. Collins, B. Tangney, N. Harris,
SIGOPS European Workshop, pages 17–24. Association for Computing Machinery, September 1996.
[8] OMG. The Common Object Request Broker: Architecture and Specification, V2.1. Object Management Group, 1995. [9] OMG. Notification service, request for proposal, December
1996.
[10] B. Preiss. Data Structures and Algorithms with
Object-Oriented Design Patterns in C++, chapter 8. John Wiley & Sons, Inc., 1999.
[11] M. Shapiro, D. Plainfoss´e, P. Ferreira, and L. Amsaleg. Some key issues in the design of distributed garbage col-lection and references. In Unifying Theory and Practice in Distributed Systems, Dagstuhl (Germany), Sept. 1994. [12] G. Starovic, V. Cahill, and B. Tangney. An Event Based
Object Model for Distributed Programming. In J. Murphy and B. Stone, editors, Proceedings of the 1995 International Conference on Object Oriented Information Systems, pages 72–86, London, December 1995. Dublin City University, Ireland, Springer-Verlag.
Entity Unfiltered event msgs Actual event msgs Overhead msgs Total msgs Relative decrease
[image:11.595.172.422.84.121.2]Unicast God 35,811 35,811 24 35,835 -0.07% Multicast God 35,811 35,811 2 35,813 -0.01%
Table 1. Experiment 1: God (Configuration A)
Security Camera Unfiltered unicast event msgs Unfiltered multicast event msgs Actual unicast event msgs Actual multicast event msgs Unicast overhead msgs Multicast overhead msgs Total unicast msgs Total multicast msgs Relative unicast decrease Relative multicast decrease
[image:11.595.74.523.175.307.2]CL-ArupExtn# 35,811 35,811 52 52 24 2 76 54 99.8% 99.8% CL-ArupMain# 35,811 35,811 22 22 24 2 46 24 99.9% 99.9% ORL-Home#5 35,811 35,811 7 7 24 2 31 9 99.9% 100.0% ORL-Net#0 35,811 35,811 2,125 2,125 24 2 2,149 2,127 94.0% 94.1% ORL-Net#1 35,811 35,811 5,703 5,703 24 2 5,727 5,705 84.0% 84.1% ORL-Net#2 35,811 35,811 6,932 6,932 24 2 6,956 6,934 80.6% 80.6% ORL-Net#4 35,811 35,811 2,582 2,582 24 2 2,606 2,584 92.7% 92.8% ORL-Net#5 35,811 35,811 5,023 5,023 24 2 5,047 5,025 85.9% 86.0% ORL-Net#6 35,811 35,811 2,075 2,075 24 2 2,099 2,077 94.1% 94.2% ORL-Net#7 35,811 35,811 1,899 1,899 24 2 1,923 1,901 94.6% 94.7% ORL-Three#8 35,811 35,811 7,144 7,144 24 2 7,168 7,146 80.0% 80.0% ORL-Three#9 35,811 35,811 2,247 2,247 24 2 2,271 2,249 93.7% 93.7% Average 35,811 35,811 2,984 2,984 24 2 3,008 2,986 91.6% 91.7%
Table 2. Experiment 2: CCTV (Configuration A)
Security Camera Unfiltered unicast event msgs Unfiltered multicast event msgs Actual unicast event msgs Actual multicast event msgs Unicast overhead msgs Multicast overhead msgs Total unicast msgs Total multicast msgs Relative unicast decrease Relative multicast decrease
[image:11.595.74.522.360.494.2]CL-ArupExtn# 71,622 35,811 104 52 48 4 152 56 99.8% 99.8% CL-ArupMain# 71,622 35,811 44 22 48 4 92 26 99.9% 99.9% ORL-Home#5 71,622 35,811 14 7 48 4 62 11 99.9% 100.0% ORL-Net#0 71,622 35,811 4,250 2,125 48 4 4,298 2,129 94.0% 94.1% ORL-Net#1 71,622 35,811 11,406 5,703 48 4 11,454 5,707 84.0% 84.1% ORL-Net#2 71,622 35,811 13,864 6,932 48 4 13,912 6,936 80.6% 80.6% ORL-Net#4 71,622 35,811 5,164 2,582 48 4 5,212 2,586 92.7% 92.8% ORL-Net#5 71,622 35,811 10,046 5,023 48 4 10,094 5,027 85.9% 86.0% ORL-Net#6 71,622 35,811 4,150 2,075 48 4 4,198 2,079 94.1% 94.2% ORL-Net#7 71,622 35,811 3,798 1,899 48 4 3,846 1,903 94.6% 94.7% ORL-Three#8 71,622 35,811 14,288 7,144 48 4 14,336 7,148 80.0% 80.0% ORL-Three#9 71,622 35,811 4,494 2,247 48 4 4,542 2,251 93.7% 93.7% Average 71,622 35,811 5,969 2,984 48 4 6,017 2,988 91.6% 91.7%
Table 3. Experiment 2: CCTV (Configuration B)
Security Camera Unfiltered unicast event msgs Unfiltered multicast event msgs Actual unicast event msgs Actual multicast event msgs Unicast overhead msgs Multicast overhead msgs Total unicast msgs Total multicast msgs Relative unicast decrease Relative multicast decrease
CL-ArupExtn# 107,433 35,811 156 52 72 6 228 58 99.8% 99.8% CL-ArupMain# 107,433 35,811 66 22 72 6 138 28 99.9% 99.9% ORL-Home#5 107,433 35,811 21 7 72 6 93 13 99.9% 100.0% ORL-Net#0 107,433 35,811 6375 2,125 72 6 6,447 2,131 94.0% 94.0% ORL-Net#1 107,433 35,811 17109 5,703 72 6 17,181 5,709 84.0% 84.1% ORL-Net#2 107,433 35,811 20796 6,932 72 6 20,868 6,938 80.6% 80.6% ORL-Net#4 107,433 35,811 7746 2,582 72 6 7,818 2,588 92.7% 92.8% ORL-Net#5 107,433 35,811 15069 5,023 72 6 15,141 5,029 85.9% 86.0% ORL-Net#6 107,433 35,811 6225 2,075 72 6 6,297 2,081 94.1% 94.2% ORL-Net#7 107,433 35,811 5697 1,899 72 6 5,769 1,905 94.6% 94.7% ORL-Three#8 107,433 35,811 21432 7,144 72 6 21,504 7,150 80.0% 80.0% ORL-Three#9 107,433 35,811 6741 2,247 72 6 6,813 2,253 93.7% 93.7% Average 107,433 35,811 8,953 2,984 72 6 9,025 2,990 91.6% 91.6%
Security Camera Unfiltered unicast event msgs Unfiltered multicast event msgs Actual unicast event msgs Actual multicast event msgs Unicast overhead msgs Multicast overhead msgs Total unicast msgs Total multicast msgs Relative unicast decrease Relative multicast decrease
[image:12.595.82.522.59.724.2]CL-ArupExtn# 143,244 35,811 208 52 96 8 304 60 99.8% 99.8% CL-ArupMain# 143,244 35,811 88 22 96 8 184 30 99.9% 99.9% ORL-Home#5 143,244 35,811 28 7 96 8 124 15 99.9% 100.0% ORL-Net#0 143,244 35,811 8,500 2,125 96 8 8,596 2,133 94.0% 94.0% ORL-Net#1 143,244 35,811 22,812 5,703 96 8 22,908 5,711 84.0% 84.1% ORL-Net#2 143,244 35,811 27,728 6,932 96 8 27,824 6,940 80.6% 80.6% ORL-Net#4 143,244 35,811 10,328 2,582 96 8 10,424 2,590 92.7% 92.8% ORL-Net#5 143,244 35,811 20,092 5,023 96 8 20,188 5,031 85.9% 86.0% ORL-Net#6 143,244 35,811 8,300 2,075 96 8 8,396 2,083 94.1% 94.2% ORL-Net#7 143,244 35,811 7,596 1,899 96 8 7,692 1,907 94.6% 94.7% ORL-Three#8 143,244 35,811 28,576 7,144 96 8 28,672 7,152 80.0% 80.0% ORL-Three#9 143,244 35,811 8,988 2,247 96 8 9,084 2,255 93.7% 93.7% Average 143,244 35,811 11,937 2,984 96 8 12,033 2,992 91.6% 91.6%
Table 5. Experiment 2: CCTV (Configuration D)
Security Camera Unfiltered unicast event msgs Unfiltered multicast event msgs Actual unicast event msgs Actual multicast event msgs Unicast overhead msgs Multicast overhead msgs Total unicast msgs Total multicast msgs Relative unicast decrease Relative multicast decrease
[image:12.595.75.521.73.206.2]0-0-0-0-10-1 35,811 35,811 651 651 24 2 675 653 98.1% 98.2% 0-0-0-0-13-e 35,811 35,811 658 658 24 2 682 660 98.1% 98.2% 0-0-0-0-4-2b 35,811 35,811 12 12 24 2 36 14 99.9% 100.0% 0-0-0-0-79-0 35,811 35,811 2 2 24 2 26 4 99.9% 100.0% 0-0-0-0-81-2 35,811 35,811 353 353 24 2 377 355 98.9% 99.0% 0-0-0-0-81-8 35,811 35,811 110 110 24 2 134 112 99.6% 99.7% 0-0-0-0-82-5 35,811 35,811 332 332 24 2 356 334 99.0% 99.1% 0-0-0-0-82-5 35,811 35,811 338 338 24 2 362 340 99.0% 99.1% 0-0-0-0-83-2 35,811 35,811 59 59 24 2 83 61 99.8% 99.8% 0-0-0-0-83-4 35,811 35,811 279 279 24 2 303 281 99.2% 99.2% 0-0-0-0-83-9 35,811 35,811 50 50 24 2 74 52 99.8% 99.9% 0-0-0-0-e-e9 35,811 35,811 548 548 24 2 572 550 98.4% 98.5% Average 35,811 35,811 283 283 24 2 307 285 99.1% 99.2%
Table 6. Experiment 3: Private Eye (Configuration A)
Security Camera Unfiltered unicast event msgs Unfiltered multicast event msgs Actual unicast event msgs Actual multicast event msgs Unicast overhead msgs Multicast overhead msgs Total unicast msgs Total multicast msgs Relative unicast decrease Relative multicast decrease
[image:12.595.75.524.83.385.2]0-0-0-0-10-1 71,622 35,811 1,302 651 48 4 1,350 655 98.1% 98.2% 0-0-0-0-13-e 71,622 35,811 1,316 658 48 4 1,364 662 98.1% 98.2% 0-0-0-0-4-2b 71,622 35,811 24 12 48 4 72 16 99.9% 100.0% 0-0-0-0-79-0 71,622 35,811 4 2 48 4 52 6 99.9% 100.0% 0-0-0-0-81-2 71,622 35,811 706 353 48 4 754 357 98.9% 99.0% 0-0-0-0-81-8 71,622 35,811 220 110 48 4 268 114 99.6% 99.7% 0-0-0-0-82-5 71,622 35,811 664 332 48 4 712 336 99.0% 99.1% 0-0-0-0-82-5 71,622 35,811 676 338 48 4 724 342 99.0% 99.0% 0-0-0-0-83-2 71,622 35,811 118 59 48 4 166 63 99.8% 99.8% 0-0-0-0-83-4 71,622 35,811 558 279 48 4 606 283 99.2% 99.2% 0-0-0-0-83-9 71,622 35,811 100 50 48 4 148 54 99.8% 99.8% 0-0-0-0-e-e9 71,622 35,811 1,096 548 48 4 1,144 552 98.4% 98.5% Average 71,622 35,811 565 283 48 4 613 287 99.1% 99.2%
Table 7. Experiment 3: Private Eye (Configuration B)
Security Camera Unfiltered unicast event msgs Unfiltered multicast event msgs Actual unicast event msgs Actual multicast event msgs Unicast overhead msgs Multicast overhead msgs Total unicast msgs Total multicast msgs Relative unicast decrease Relative multicast decrease
0-0-0-0-10-1 107,433 35,811 1,953 651 72 6 2,025 657 98.1% 98.2% 0-0-0-0-13-e 107,433 35,811 1,974 658 72 6 2,046 664 98.1% 98.1% 0-0-0-0-4-2b 107,433 35,811 36 12 72 6 108 18 99.9% 99.9% 0-0-0-0-79-0 107,433 35,811 6 2 72 6 78 8 99.9% 100.0% 0-0-0-0-81-2 107,433 35,811 1,059 353 72 6 1,131 359 98.9% 99.0% 0-0-0-0-81-8 107,433 35,811 330 110 72 6 402 116 99.6% 99.7% 0-0-0-0-82-5 107,433 35,811 996 332 72 6 1,068 338 99.0% 99.1% 0-0-0-0-82-5 107,433 35,811 1,014 338 72 6 1,086 344 99.0% 99.0% 0-0-0-0-83-2 107,433 35,811 177 59 72 6 249 65 99.8% 99.8% 0-0-0-0-83-4 107,433 35,811 837 279 72 6 909 285 99.2% 99.2% 0-0-0-0-83-9 107,433 35,811 150 50 72 6 222 56 99.8% 99.8% 0-0-0-0-e-e9 107,433 35,811 1,644 548 72 6 1,716 554 98.4% 98.5% Average 107,433 35,811 848 283 72 6 920 289 99.1% 99.2%
Security Camera
Unfiltered unicast event msgs
Unfiltered multicast event msgs
Actual unicast event msgs
Actual multicast event msgs
Unicast overhead msgs
Multicast overhead msgs
Total unicast msgs
Total multicast msgs
Relative unicast decrease
Relative multicast decrease
[image:13.595.79.516.317.447.2]0-0-0-0-10-1 143,244 35,811 2,604 651 96 8 2,700 659 98.1% 98.2% 0-0-0-0-13-e 143,244 35,811 2,632 658 96 8 2,728 666 98.1% 98.1% 0-0-0-0-4-2b 143,244 35,811 48 12 96 8 144 20 99.9% 99.9% 0-0-0-0-79-0 143,244 35,811 8 2 96 8 104 10 99.9% 100.0% 0-0-0-0-81-2 143,244 35,811 1,412 353 96 8 1,508 361 98.9% 99.0% 0-0-0-0-81-8 143,244 35,811 440 110 96 8 536 118 99.6% 99.7% 0-0-0-0-82-5 143,244 35,811 1,328 332 96 8 1,424 340 99.0% 99.1% 0-0-0-0-82-5 143,244 35,811 1,352 338 96 8 1,448 346 99.0% 99.0% 0-0-0-0-83-2 143,244 35,811 236 59 96 8 332 67 99.8% 99.8% 0-0-0-0-83-4 143,244 35,811 1,116 279 96 8 1,212 287 99.2% 99.2% 0-0-0-0-83-9 143,244 35,811 200 50 96 8 296 58 99.8% 99.8% 0-0-0-0-e-e9 143,244 35,811 2,192 548 96 8 2,288 556 98.4% 98.4% Average 143,244 35,811 1,131 283 96 8 1,227 291 99.1% 99.2%