Abstract—Sensors for collecting 3D spatial data from the
real world are becoming more important. They are a prime research area topic and have applications in consumer markets, such as medical, entertainment, and robotics. However, a primary concern with collecting this data is the vast amount of information being generated, and thus, needing to be processed before transmitted. To address the issue, several filtering methods have been proposed to remove unimportant data. In this paper, a comparative study is conducted to find which methods work best and under what situation. To collect the 3D spatial data, called point clouds, we used the Microsoft Kinect sensor. In addition, we utilized the Point Cloud Library (PCL) to process and filter the data being generated by the Kinect. Two different computers were setup: a client which collects, filters, and transmits the point clouds; and a server that receives and visualizes the point clouds. In order to compare the filtering methods, quality of service (QoS) metrics such as frame rate, filtering time, and percentage of filter were introduced. These metrics indicate how well a certain filtering method accomplishes the goal of transmitting point clouds from one location to another in real-time. Results show that, regardless of the filtering approach chosen, there is still too much data for a satisfactory QoS. For a real-time system to provide reasonable end-to-end quality, further compression and other techniques need to be developed.
Index Terms—filtering, Kinect, point clouds, real-time, video
streaming
I. INTRODUCTION
NE of the major contributions that technology has provided to society is the ease of communication. As we continue to move forward, people are looking for other areas of communication that can benefit from or be improved on by technology. One such example is the collection of 3D spatial data from the real world for real-time video streaming. Such an area provides research challenges and contains applications in consumer markets, such as medical, entertainment, and robotics [8]. Providing good efficiency and high quality for real-time video streaming requires that (i) a hardware sensor that is able to capture spatial information in all three dimensions; (ii) encoding and decoding algorithms; and (iii) data quality assurance mechanisms that meet application needs.
Hardware sensors have been in development for the past decade to allow for 3D image acquisition from a real world
Manuscript received June 22, 2016; revised July 26, 2016.
C. Moreno is with the California State University, Fresno, Fresno, CA 93740 USA (email: [email protected]).
environment. A variety of techniques can be used to develop these sensors, such as time-of-light (TOF), stereo, lasers, infrared light, and structured light [7]. Due to their different approaches in acquiring depth data, there is a varying cost and size for these sensors. For example, the Velodyne spinning LiDaR system is expensive, costing upwards of thousands of dollars, making it, and sensors similar to it, impractical for many projects [3]. In contrast, we have seen a rise in low cost solutions to collect RGB-D data, such as Microsoft’s Kinect [1]. For this study, we used the Kinect sensor to collect the 3D spatial data and the Point Cloud Library (PCL) to process them.
The primary concern with these hardware sensors is the rate and volume of information that is being generated. Depending on the quality of the sensor and the physical environment being sensed, a single capture can range from a few thousand points to a few million points. In terms of the Kinect sensor specifically, it generates 307,200 points per frame, which leads to a data rate of about 45 megabytes per second (MBps) [9]. Such a data rate is impractical to achieve over a network for real-time video streaming, especially when juxtaposed with the average American household bandwidth of 12.6 megabits per second (Mbps) [2].
Therefore, in order to overcome the network bandwidth bottleneck, the use of filtering methods is considered a viable solution. Filtering allows us to modify or remove data from a dataset according to certain criteria. Numerous methods for filtering data have been developed over the past years, originating from different services and application needs. Given the variation of filtering algorithms, there needs to be a comparative study that is able to compare and contrast different filters for use in real-time video streaming.
In this study, we have implemented and conducted experiments to evaluate four filters: pass through filter,
voxel grid filter, approximate voxel grid filter, and bilateral filter. Results show that, overall, the pass through filter provides the best quality of service (QoS) relative to the other options. Yet, despite the reduction in the number of points being transmitted, the data rate is still too high. We conclude that, in conjunction with filtering methods, a real-time video streaming service will require further techniques such as frame skipping, compression, and dynamic adjustments.
II. RELATED WORKS
Microsoft’s Kinect was originally meant for entertainment M. Li is with the California State University, Fresno, Fresno, CA 93740 USA (phone: 559-278-4792; email: [email protected]).
A Comparative Study of Filtering Methods for
Point Clouds in Real-Time Video Streaming
Carlos Moreno and Ming Li
purposes, but since its inception, it has been integrated in many other fields. For example, [11] has integrated the Kinect with Simulink to allow for real-time object tracking. [12] shows that the hardware sensor is applicable to the medical field through its use in a virtual rehabilitation system to help stroke victims regain balance. [13] explains how the Kinect’s inherit issues can be transformed into useful information for use in creating automatic foreground segmentation. Lastly, [14] shows a unique example of utilizing the Kinect in the music field.
PCL has also experienced multiple uses. [15] uses it to develop efficient facial registration processes, encompassed into the Digital Face-Inspection (DFI) system, to help in the dental field. [16] explains how indoor robots also benefit from PCL by allowing for real-time, general object recognition. An important data structure used in PCL is the octree, and it too has implications in other fields, as shown in [17] and [18].
III. SYSTEM ARCHITECTURE
Microsoft’s Kinect is a peripheral hardware sensor originally developed for interactive use of Microsoft’s Xbox 360 video game console. The RGB-D sensor was developed with three main functions in mind: 3D image detection, human skeleton tracing, and audio processing. This functionality, in addition to its relatively inexpensive price, has drawn researchers and developers to utilize the Kinect for other purposes, such as robot vision and healthcare systems. The sensor itself consists of an RGB camera, an infrared (IR) emitter, an IR camera, and an array of microphones. The Kinect can achieve a maximum frame rate of 30 fps with a resolution of 640 x 480. Each color channel uses 8 bits while the depth data is represented in 16 bits [10]. Therefore, for a single frame consisting of 307,200 points, this Kinect raw data is represented in about 1.46 MB.
The Kinect raw data can be converted to point clouds. To process these point clouds, we require the use of PCL, which is an open-source, fully templated C++ library. It incorporates many algorithms for point clouds and 3D geometry, such as filtering, feature estimation, visualization, segmentation, and more [3]. The point cloud data (PCD) for the Kinect is about 10 MB in size; much larger than the raw RGB-D data. If we achieved a frame rate of 30 fps, this would result in a data rate of 300 MBps for PCL, compared to the 45 MBps of raw Kinect data. Processing and transmitting at either data rate is impractical.
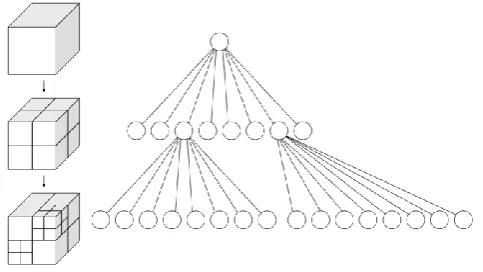
In PCL, one of the fundamental data structures used to represent a point cloud is the octree. An octree recursively divides a point cloud into eight smaller sections, called voxels (see figure 1). These voxels are 3D cubes that encapsulate a subset of points from the point cloud. The resolution of the frame is determined by the depth level of the octree, i.e. a higher resolution means more voxels and a deeper octree.
Hardware and software aside, what makes real-time video streaming particularly challenging is finding the balance between the data rate and the network bandwidth. Having a high-quality hardware sensor and efficient software for processing is wasted if the network bandwidth is unable to
deliver the data in real-time. Therefore, for this survey, we assume that the network is in such a state: the bandwidth is much less than the data rate. Moreover, we are using the following configurations for the two computers: (i) a wired desktop PC with an Intel i7-6700 processor, GTX 745 GPU, and 16GB DDR3 RAM; and (ii) a wireless laptop with an Intel i7-2630QM processor and 8GB DDR3 RAM.
IV. FILTERING METHODS
The filters used for this comparative study come from PCL. There is an extensive list of available filters, however, not all of these are practical or suited for data transmission in real-time. Narrowing down this list, we determined that the following four filters seem most applicable to real-time video streaming: pass through, voxel grid, approximate voxel grid, and bilateral. These filters each take a point cloud as input and will output a new, filtered point cloud.
A. Pass Through
The pass through filter passes the input points through constraints based on a particular field. It iterates through the entire point cloud once, performing two operations. First, it removes non-finite points. Second, it removes any points that lie outside the specified interval for the specified field. For example, a programmer is able to set the field so it refers to the z-dimension (depth) and set the limit so that the filter removes any points that are half a meter away from the sensor.
B. Voxel Grid
The voxel grid filter assembles a 3D voxel grid over the entire input cloud. This means that a set of cubes is placed over the entire point cloud. For each individual voxel, the points that lie within it are down-sampled with respect to their centroid. This approach has a few drawbacks: (i) it requires a slightly longer processing time as opposed to using the voxel center; (ii) it is sensitive to noisy input spaces; and (iii) it does not represent the underlying surface accurately [6].
C. Approximate Voxel Grid
[image:2.595.306.548.55.191.2]down-sampling the points, this filter makes a quick approximation of the centroid through the use of a hashing function.
D. Bilateral
The bilateral filter preserves the edges in a frame and reduces the noise. This is performed by replacing the intensity value for each point in the frame by the weighted average of intensity values from nearby points, based on a Gaussian distribution. These weights depend on the Euclidean distance and differences in ranges (such as color and depth). For further information, see [5].
V. PERFORMANCE EVALUATION
A. Experiment Setup
In order to conduct a survey of different filtering methods, we needed to setup an experiment that would be able to measure certain characteristics for comparison. Because this is in the context of real-time video streaming, we developed a client/server application that would test each filter (see figure 2).
The client program is designed for generating, filtering, and transmitting the point clouds. It is connected to the Kinect hardware sensor in order to capture the RGB-D data from the real world. Furthermore, it uses PCL to process and filter the point clouds. These filtered point clouds are transmitted to the server using TCP/IP.
The server program is designed for receiving the point clouds from the client and then visualizing them to the monitor for display. Similar to the client, the server will receive the filtered point clouds and use PCL’s visualization functionality to display the received data.
We tested these filtering algorithms in three different network environments. First, as a control/ideal case, we had the client and server programs running locally on the desktop PC. Second, we setup a wired-to-wireless scenario, meaning that the client program is using a wired connection to the Internet, while the server is receiving data through a wireless connection. Third, we used a wireless-to-wired scenario: the
client is wirelessly connected to the Internet, the server has a wired connection.
To test the relative effectiveness of each filter in this application, we had to develop ways of measuring the QoS. We therefore created a set of metrics that capture the relative information for each filter.
B. QoS Metrics
QoS is critical for the success of real-time video streaming. The quality of a video stream is, in part, determined by its number of frames per second (fps). Video streams with a high fps usually results in a smooth visual experience for the users; low fps, on the other hand, tends to result in a choppy stream and poor user experience.
The other part of this application is the real-time characteristic. To measure the QoS for this aspect, we used a
processing time metric, which is the overall summation of the individual phases. This means, it adds up the time it takes for: (i) point cloud filtering; (ii) point cloud transmission; (iii) receiving point cloud; and (iv) point cloud visualization. The lower the time metric, the more likely it is performed in real-time.
While the above two metrics work well in determining the QoS for real-time video streaming, they do not take into account of how well the filters perform in isolation. Therefore, we also used a filter percentage metric, meaning how much of the points in the original point cloud were filtered out. To calculate this, we found the difference in the number of points in the filtered cloud from the original cloud, and divided that by the original number of points.
Yet, despite these three metrics, there is still a lack of measurement of how well the real-time video stream performs visually. For that, we developed a set of three additional metrics: (i) branch similarity, which compares the two branch structures of the octrees against each other; (ii)
point similarity, which measures how well two point values match up; and (iii) color similarity, which calculates the similarity in the color values.
C. Results
The bilateral filter was disregarded due to the large processing time required. A single point cloud required over half an hour to filter, making it impractical for further testing and for any real-time application.
In the local network setup, using no filter results in the best overall metric scores. Achieving an average frame rate of 8.46 fps and an average overall time of 0.11 seconds, the no filter option makes sense since the data does not need to be transmitted over the Internet; instead, it simply moves from the client program to the server program. Therefore, the assumption we made about network bandwidth is broken and the need for filtering is no longer necessary. However, for the two live network scenarios, using no filter performs the worst.
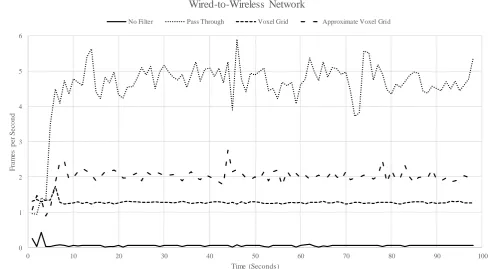
In the wired-to-wireless scenario, using the pass through filter provided for the highest frame rate among the other filters (see figure 3). The same is true in the wireless-to-wired network environment. Moreover, it also achieved the lowest overall time in both network environments. These can be explained due to the pass through filter filtering the Fig. 2. Visual overview of the experiment program flow. The first three
tasks are the client’s responsibility: using the Kinect, generate the point clouds through PCL, filter them, and then transmit. The last task is the server, which receives the filtered point clouds and visualizes to the monitor them using PCL.
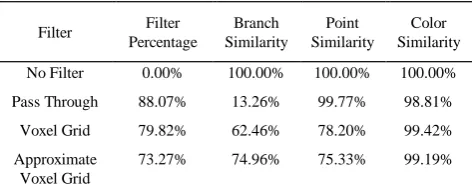
TABLEI
SUMMARY OF QOSMETRICS
Filter Filter Percentage
Branch Similarity
Point Similarity
Color Similarity
No Filter 0.00% 100.00% 100.00% 100.00%
Pass Through 88.07% 13.26% 99.77% 98.81%
Voxel Grid 79.82% 62.46% 78.20% 99.42%
Approximate Voxel Grid
73.27% 74.96% 75.33% 99.19%
[image:3.595.48.285.675.770.2]most points relative to the others (see table). With fewer points, the filtered point clouds from the pass through filter are smaller in data size, which allows for a higher frame rate and lower overall time.
In terms of the visual QoS metrics, the pass through filter appears to have a relatively low branch similarity. However, this is due to the nature of the filter. It effectively removes a
large portion of the original point cloud, which drastically changes the underlying octree data structure, including its branch structure (see figure 4). While the octree might be different, the pass through filter still maintains the highest similarity for the points (apart from the control case which uses no filter).
0 1 2 3 4 5 6
0 10 20 30 40 50 60 70 80 90 100
F
ra
m
e
s
p
e
r
S
e
c
o
n
d
Time (Seconds)
Frame Rate
Wired-to-Wireless Network
[image:4.595.54.543.71.340.2]No Filter Pass Through Voxel Grid Approximate Voxel Grid
Fig. 3. A scatter plot that compares the frame rate for different filters in a wired-to-wireless network environment. The pass through filter maintains the highest fps of the four. This data was collected over a period of 500 frames.
(a) No filter (b) Pass through filter
[image:4.595.57.287.385.675.2]
(c) Voxel grid filter (d) Approximate voxel grid filter
VI. SUMMARY
Among the four filtering methods allowed by PCL, the pass through filter results in the best scores for the QoS metrics. It removes the unnecessary background data, which reduces the point cloud size and allows for a better experience in real-time video streaming. If the whole frame is required, however, the best filter is the approximate voxel grid, which outperforms the (normal) voxel grid filter in all QoS metrics.
Although the use of filters reduces the original PCD size, the highest average frame rate that was achieved is merely 4.59 fps. Such a low frame rate cannot be considered to be real-time. Therefore, while filtering improves the QoS metrics compared to the no filter case, there needs to be more done to truly achieve real-time.
For that purpose, we require additional techniques. First, compression will allow the data size to become even smaller, which translates to a higher frame rate. Second, a frame skipping method that skips frames that are similar to previous frames, allows us to save on bandwidth and instead send more important data. Third, because of the network behavior that causes bandwidth fluctuation, a static compression ratio might work at certain bandwidth rates, but not all; instead, we need a dynamic compression algorithm that adjusts the compression ratio as a response to the bandwidth. Fourth, a progressive transmission scheme allows us to transmit the PCD layer-by-layer, in which each additional layer provides more details for the frame; the number of layers sent depends on the bandwidth and dynamically adjusts as the network changes.
VII. CONCLUSION
Collecting 3D spatial data for real-time video streaming provides research challenges due to the high volume and high velocity data rate from the hardware sensors. Using Microsoft’s Kinect sensor to collect the RGB-D data and PCL to process them, we were able to compare and contrast different filtering methods to be used with the PCD. Filtering is a requirement due to the high data rate compared to the low bandwidth (300 MBps vs. 12.6 Mbps).
Using a client/server application, we were able to survey the differing filtering algorithms by measuring different QoS metrics. Our results show that, in a live network environment, the pass through filter achieves the highest scores in these metrics. Yet, utilizing only filters will not achieve true real-time. To do so, we require the use of four additional techniques: octree compression, frame skipping, dynamic compression, and a progressive transmission scheme.
REFERENCES
[1] R. B. Rusu, Z. Marton, N. Blodow, M. Dolha, and M. Beetz, "Towards 3D point cloud based object maps for household environments," Robotics and Autonomous Systems, vol. 56, no. 11, pp. 927-941, 2008.
[2] D. Belson, J. Thompson, J. Sun, R. Möller, M. Sintorn, and G. Huston, "The State of the Internet," Akamai, Cambridge, MA, Tech. Rep., Dec. 2015.
[3] R. B. Rusu and S. Cousins, "3D is here: Point Cloud Library (PCL)," Robotics and Automation (ICRA), 2011 IEEE International Conference on, Shanghai, 2011, pp. 1-4.
[4] J. Kammerl, N. Blodow, R. B. Rusu, S. Gedikli, M. Beetz and E. Steinbach, "Real-time compression of point cloud streams," Robotics and Automation (ICRA), 2012 IEEE International Conference on, Saint Paul, MN, 2012, pp. 778-785.
[5] C. Tomasi and R. Manduchi, "Bilateral filtering for gray and color images," Computer Vision, 1998. Sixth International Conference on, Bombay, 1998, pp. 839-846.
[6] S. Orts-Escolano, V. Morell, J. García-Rodríguez and M. Cazorla, "Point cloud data filtering and downsampling using growing neural gas," Neural Networks (IJCNN), The 2013 International Joint Conference on, Dallas, TX, 2013, pp. 1-8.
[7] J. Fu, D. Miao, W. Yu, S. Wang, Y. Lu and S. Li, “Kinect-Like Depth Data Compression,” in IEEE Transactions on Multimedia, vol. 15, no. 6, pp. 1340-1352, Oct. 2013.
[8] M. Miknis, R. Davies, P. Plassmann and A. Ware, “Near real-time point cloud processing using the PCL,” 2015 International Conference on Systems, Signals and Image Processing (IWSSIP), London, 2015, pp. 153-156.
[9] F. Nenci, L. Spinello and C. Stachniss, “Effective compression of range data streams for remote robot operations using H.264,” 2014 IEEE/RSJ International Conference on Intelligent Robots and Systems, Chicago, IL, 2014, pp. 3794-3799.
[10] A. Jana, “Understanding the Kinect Device,” in Kinect for Windows SDK Programming Guide, Birmingham, UK: Packt, 2012, pp. 8-17. [11] J. Fabian, T. Young, J. C. P. Jones and G. M. Clayton, “Integrating the
Microsoft Kinect With Simulink: Real-Time Object Tracking Example,” in IEEE/ASME Transactions on Mechatronics, vol. 19, no. 1, pp. 249-257, Feb. 2014.
[12] C. L. Lai, Y. L. Huang, T. K. Liao, C. M. Tseng, Y. F. Chen and D. Erdenetsogt, “A Microsoft Kinect-Based Virtual Rehabilitation System to Train Balance Ability for Stroke Patients,” 2015 International Conference on Cyberworlds (CW), Visby, 2015, pp. 54-60.
[13] T. Deng, H. Li, J. Cai, T. J. Cham and H. Fuchs, “Kinect Shadow Detection and Classification,” Computer Vision Workshops (ICCVW), 2013 IEEE International Conference on, Sydney, NSW, 2013, pp. 708-713.
[14] M. F. Lu, J. S. Chiang, T. K. Shih and S. Wu, “3D sphere virtual instrument with Kinect and MIDI,” Ubi-Media Computing (UMEDIA), 2015 8th International Conference on, Colombo, 2015, pp. 140-145.
[15] C. T. Hsieh, “An efficient development of 3D surface registration by Point Cloud Library (PCL),” Intelligent Signal Processing and Communications Systems (ISPACS), 2012 International Symposium on, New Taipei, 2012, pp. 729-734.
[16] Q. Zhang, L. Kong and J. Zhao, “Real-time general object recognition for indoor robot based on PCL,” 2013 IEEE International Conference on Robotics and Biomimetics (ROBIO), Shenzhen, 2013, pp. 651-655. [17] F. Ouyan and T. Zhang, “Octree-based Spherical hierarchical model for Collision detection,” Intelligent Control and Automation (WCICA), 2012 10th World Congress on, Beijing, 2012, pp. 3870-3875. [18] J. He, M. Zhu and C. Gu, “3D sound rendering for virtual