Wei-Fan Chena, Pei-Chun Chaob, Ya-Ning Changa,c, Chun-Hsien Hsua, Chia-Ying Leea,b a Institute of Linguistics, Academia Sinica, 128 Academia Road, Section 2, 11529 Taipei,
Taiwan
b Institute of Neuroscience, National Yang-Ming University, 155 Linong Street, Section 2, 11221 Taipei, Taiwan
c Department of Psychology, Lancaster University, Lancaster, LA1 4YF, UK
Corresponding author: Chia-Ying Lee
Postal address: Institute of Linguistics, Academia Sinica, 128 Academia Road, Section 2, 11529 Taipei, Taiwan
Phone: +886-2-2652-5031 Fax: +886-2-2785-6622
2 Abstract
Studies of alphabetic language have shown that orthographic knowledge influences
phonological processing during spoken word recognition. This study utilized the Event-Related Potentials (ERPs) to differentiate two types of phonology-to-orthography (P-to-O) mapping consistencies in Chinese, namely homophone density and orthographic consistency. The ERP data revealed an orthographic consistency effect in the frontal-centrally distributed N400, and a homophone density effect in central-posteriorly distributed late positive component (LPC). Further source analyses using the standardized low-resolution electromagnetic tomography (sLORETA) demonstrated that the orthographic effect was not only localized in the frontal and temporal-parietal regions for phonological processing, but also in the posterior visual cortex for orthographic processing, while the homophone density effect was found in middle temporal gyrus for lexical-semantic selection, and in the temporal-occipital junction for orthographic processing. These results suggest that orthographic information not only shapes the nature of phonological representations, but may also be activated during on-line spoken word recognition.
Keywords: homophone density, orthographic consistency, spoken word recognition, ERPs, sLORETA
Research highlights:
• We differentiate two types of Chinese P-to-O mapping consistencies: homophone density
and orthographic consistency.
• The ERPs and sLORETA results reveal when and how the P-to-O mapping consistencies
affect Chinese spoken word recognition.
• These findings can help resolve existing debates on orthographic effects in spoken
1. Introduction
The abilities to speak and read are two important evolutionary endowments of human beings. Compared to reading acquisition, speech has primacy both in the history of humankind and in an individual’s lifetime, and can be acquired without explicit instruction. Acquiring spoken language primarily involves mastering the linkage between phonology and semantics, while learning to read aims to develop efficient mapping of visual symbols (orthography) onto phonological and semantic representations. However, phonology plays a critical role in visual word recognition. For example, heterographic homophones are generally harder to recognize than non-homophonic words (Ferrand & Grainger, 2003; Pexman, Lupker, & Jared, 2001; Xu, Pollatsek, & Potter, 1999) and are more prone to semantic confusion (Tan & Perfetti, 1997; Van Orden, 1987). These homophone disadvantages support the competition driven by mandatory phonological processing during visual word recognition.
determining whether two spoken words share the same rhyme, the rhymes with identical spelling (e.g., PIE-TIE) were easier to match than the rhymes with different spelling (e.g., RYE-TIE). Similarly, priming effects across two auditory words were only found to be robust when the phonological overlap also involved an orthographic overlap (Slowiaczek, Soltano, Wieting, & Bishop, 2003). However, the strongest evidence for orthography influencing spoken word recognition comes from studies involving the manipulation of the orthographic consistency of spoken words, which is defined as the degree of mapping consistency from phonology to orthography (P to O). For example, in English, orthographic consistency can be measured by whether a spoken word contains a rhyme that can be spelled in multiple ways (i.e., /ʌk/ is consistent in that it is always spelled -UCK, while /ip/ is inconsistent since it could be spelled either -EEP or -EAP). The orthographic consistency effect during spoken word recognition has been found in different languages, including Portuguese
therefore support the concept that orthographic information influences on-line spoken word recognition. However, there are ongoing debates regarding when the
orthographic consistency occurs within the time course of spoken word recognition, and how the orthographic information affects spoken word recognition.
long before the end of the word and were time-locked to the “arrival” of the orthographic inconsistency in the spoken word. Pattamadilok et al. (2009) also demonstrated the same pattern of orthographic consistency effects that were time locked to the position of orthographic inconsistency (early consistency effect in 300 to 350 ms, and late consistency effect in 400 to 425 ms and 450 to 700 ms) by using the semantic Go/no go task. These effects occurred before the onset of frequency and the go/no-go effects, which have been used to index the moment of lexical access and decision-making, respectively. Even so, the orthographic consistency effects were found in frontal to central sites, rather than central to posterior sites. Pattamadilok et al. (2011) examined the orthographic consistency effect and frequency effect with a rhyming judgment task. However, they could not replicate the orthographic
consistency effect in the same time window of 300 to 350 ms, but rather found this effect in the 175-250 ms time window, along with an effect in the 375-750 ms time window in the frontal to central sites. Moreover, the consistent words elicited increased negativities in the late and long lasting later time window than did the inconsistent words, and the pattern was opposite to that demonstrated by previous studies (Pattamadilok et al., 2009; Perre et al., 2009; Perre & Ziegler, 2008). Across these studies, although there are still some controversies regarding the pattern and precise time windows of the orthographic consistency effect, in general these findings support that orthographic information is computed on-line, rather than occurs
Another ongoing debate concerns how the orthographic consistency effect emerges during literacy. Two explanations have been proposed to explain the orthographic consistency effect in spoken word recognition; one is the phonological restructuring account, and the other is the on-line activation account (Perre et al., 2009). The phonological restructuring account claims that learning to read alters preexisting phonological representations, and that orthographic consistency plays a major role during the restructuring processes (Muneaux & Ziegler, 2004; Ziegler & Goswami, 2005). To be more specific, the orthographically consistent words develop finer phonological representations than do the orthographically inconsistent words. Therefore, it predicts that the orthographic consistency effect, that reflects the differences in the quality of phonological representation, will be found in brain regions that are responsible for phonological processing, such as the left inferior frontal gyrus (IFG), insula, left superior temporal gyrus (STG), or left supramarginal gyrus (SMG). Alternatively, the on-line activation account assumes that the
orthographic information will be activated on-line while processing the spoken words, due to the strong and permanent associations between orthography and phonology that develop through the processes of learning to read. Therefore, the orthographic consistency effect should be found in brain regions responsible for
Perre et al. (2009) applied the standardized low resolution electromagnetic tomography (sLORETA) to determine the cortical generators underlying the orthographic consistency effect in spoken word recognition. They found that the orthographic consistency effect was localized in a classic phonological area, left BA40, but not in the posterior cortical areas for coding orthographic information. Pattamadilok, Knierim, Kawabata Duncan, and Devlin (2010) applied repetitive TMS over the left SMG and vOTC while participants performed an auditory lexical
decision task in which the orthographic consistency of the spoken words was manipulated. The orthographic consistency effect disappeared only when the stimulation was delivered to the SMG, but not to the vOTC. This evidence supports the phonological restructuring hypothesis, rather than the co-activation of
orthographic codes. However, other fMRI studies have found activation in the fusiform gyrus during rhyming judgments for auditory words (Booth et al., 2002;
Booth, Cho, Burman, & Bitan, 2007; Cao et al., 2011; Cao et al., 2010). Yoncheva,
Zevin, Maurer, and McCandliss (2010) found that selectively attending to speech, relative to selectively attending to melody, leads to increased activity in left inferior frontal regions, specifically the left mid-fusiform gyrus near the visual word form area (VWFA) and temporal areas. These findings serve as strong support for the
fit into a square-shaped space. Chinese characters represent monosyllabic (and usually monomorphemic) forms, with the majority consisting of a consonant-vowel (CV) structure. Given the relatively simple syllable structure, most Chinese syllables may represent more than one morpheme, and so are mapped onto more than one
orthographic form (characters). The pervasive homophony of Chinese implies that the orthographic form is particularly important for selecting the meaning and escaping homophony in Chinese. Thus, we may expect a greater impact from orthography during spoken word recognition in Chinese than in alphabetic writing systems.
The majority of modern Chinese characters are phonograms (i.e., 踩cǎi, ‘to step on’), which consist of a semantic component (radical) that provides information about the meaning of the character (足zú, ‘foot’), and a phonetic component that provides information about the character’s pronunciation (采cǎi, ‘gathering’). The reliability of a phonetic radical in providing clues to the whole character’s pronunciation can be defined by regularity or consistency. Regularity refers to whether the sound of a character is identical with that of its phonetic radical. For example, 楓fēng ‘maple’ is pronounced the same as its phonetic radical 風fēng ‘wind’, and is thus defined as a regular character, whereas 猜cāi ‘guess’ is pronounced differently from its phonetic radical 青qīng ‘blue-green’, and is thus defined as an irregular character.
containing the same phonetic radical. Evidence from behavioral and brain studies demonstrates that Chinese readers capture the mapping consistency from orthography to phonology during character reading, and the neural mechanism responsible for this statistical mapping parallels the same mechanisms suggested for reading with
alphabetic writing systems (Hsu, Lee, & Tzeng, 2014; Hsu, Tsai, Lee, & Tzeng, 2009; C. Y. Lee, 2011; C. Y. Lee et al., 2004; C. Y. Lee, Tsai, Su, Tzeng, & Hung, 2005).
Although the mapping consistency from orthography to phonology in Chinese reading has been extensively studied, how the mapping consistency from phonology to orthography affects Chinese spoken word recognition is less well known. Lee and colleagues (2015) suggested two different measures, namely homophone density and orthographic consistency, to index the mapping variations from phonology to
orthography in Chinese (seeFigure 1)(C. Y. Lee, Hsu, Chang, Chen, & Chao, 2015). Homophone density refers to the number of characters sharing the same
pronunciation (including both syllable and lexical tone). Orthographic consistency is
defined as the degree to which a set of homophones can be divided into subgroups
based on their phonetic radicals. For example, in figure 1, homophone density of
syllable biǎo is 5, as it corresponds to five homophonic characters: 表, 錶, 婊, 裱,
and諘. In terms of orthographic consistency, the syllable biǎo is considered as a high
orthographic consistency syllable as its five homophones all share the same phonetic
radical 表. On the other hand, gài is an orthographic inconsistent syllable as its five
their phonetic radicals: 既, 丐and 盍.
Only a few studies have used ERPs to examine the orthographic influence in Chinese spoken word recognition (Wang, Li, Ning, & Zhang, 2012; Zou, Desroches, Liu, Xia, & Shu, 2012). Wang et al. (2012) manipulated the homophone density of monosyllabic Chinese words and found an inhibitory homophone density effect in reaction time and accuracy for lexical auditory decisions. Moreover, they found that high-density words elicited greater negativity across anterior scalp sites, from 600 to 800 ms, than did the low-density words. Although this effect was not found in the N400 time window, the authors claimed the results reflected semantic, rather than orthographic, competition among the multiple meanings of homophones. Zou et al. (2012) manipulated the orthographic and phonological similarity between the first syllable of the prime and target (e.g., O+P+:面包miàn v.s.面孔miàn; O-P+:灯光 dēng v.s.登门dēng; O-P-:海带hǎi v.s.电台diàn; O+P-:会议huì v.s.会计kuài) in
the auditory lexical decision task. They found the orthographic similarity facilitated reaction time and reduced the N400 amplitudes for target words, regardless if the first syllables of the prime and target were homophones or not, and thus supported
orthographic activation during Chinese spoken word recognition. However, none of these studies examined orthographic consistency at the radical level.
recognition. This study aims to investigate when and how homophone density and orthographic consistency influence Chinese spoken word recognition. The on-line time courses of the homophone density and orthographic consistency effects were tracked by using ERPs in an auditory semantic category judgment task. Additionally, sLORETA will be applied to estimate the neural generators underlying these two effects, in order to resolve the debate between phonological restructuring and on-line activation accounts.
2. Methods
2.1 Participants
Twenty college students (seven male) with the mean age of 25.4 year (ranged from 18 to 28 years) were paid NT$300 for their participation in this experiment. All participants were right-handed native Chinese speakers with normal hearing,
corrected or normal vision and have no history of neurological or psychiatric disorders. Written consents were obtained from all participants.
2.2 Experimental Design
The critical stimuli consisted of 90 monosyllabic Chinese words, which were sub-divided into three phonology-to-orthography mapping conditions (P-O mapping condition) (30 items per condition) that varied in homophone density (HD) and orthographic consistency (OC). Based on the corpus established by C. Y. Lee et al. (2015), homophone density is measured as the number of Chinese character that
sharing the same syllable structure and tone. In addition, the orthographic consistency
phonetic radical to the summed frequency of homophones. The three P-O mapping
conditions were defined as follows (see Figure 1): The first one is the low homophone
density and high orthographic consistency (low HD/ high OC). In this condition, every spoken word can only be mapped onto one written character (e.g., the syllable dǎ can only be written as 打) and thus the homophone density is equal to 1 (mean =1, SD=0). In other words, all the low homophone density spoken words of this study must have high orthographic consistency (orthographic consistency = 1, SD= 0) since
there is no other homophone and thus no orthographic variations at the sub-lexical
level. Therefore, in this study, it is impossible to have a low homophone density and
low orthographic consistency condition. The second one is the high homophone
density and high orthographic consistency (high HD/high OC). In this condition, each spoken word could be mapped onto at least five homophonic characters (mean= 7.43, SD= 3.00) and all the homophonic characters shared the same phonetic radical (mean of orthographic consistency = 0.97, SD= 0.03)(e.g., biǎo can be written as 裱, 俵, 錶, 婊, 諘 and all the characters share the same phonetic radical ’表’); The third
density effect was examined by contrasting the first two conditions (low HD/high OC versus high HD/high OC), while the orthographic consistency effect was examined by contrasting the second and third conditions (high HD/high OC versus high HD/low OC).
---
Insert Figure 1 about here.
--- The critical stimuli across the three conditions were matched for syllable frequency. The stimuli with high homophone density (high HD/high OC and high HD/low OC) were matched by their homophone density and the number of high frequency neighbors (each stimulus shall have at least two homophonic characters with character frequency >= 500/per million). Characteristics and examples of the stimuli in three conditions are listed in Figure 1 and Table 1.
---
Insert Table 1 about here.
---In addition to the critical stimuli for the No trials, the material also included 60
animal names for the Yes trials. All the spoken stimuli were obtained from the
“Master Ideographs Seeker for CNS 11643 Chinese Standard Interchange Code” (abbreviated as Master Ideographs Seeker) website by the Preceding Electronic Data Processing Center Directorate, General of Budget, Accounting and Statistics,
and 650 ms though Adobe Audition®.
2.3 Procedure
In this experiment, the participants were asked to perform an auditory semantic judgment task, which included 60 animal names in the Yes trials and 90 critical
stimuli in the No trials. The participants were seated in front of a monitor, at a
distance of approximately 75 cm, and were tested individually in a soundproof room. For each trial, the participant first received a cross (+) as a fixation point presented for 500 ms in the center of the screen. Next, a spoken stimulus was presented while the fixation cross remained on the screen for 1650 ms. Participants were asked to respond as quickly as possible by pressing the ‘right bottom’ on the response box when the spoken stimuli represent an animal name and to press the ‘left bottom’ from
responding when this was not the case. In addition, participants were told not to blink while the fixation point was present. The follow-up was a blank screen for 500 ms, and then the letter ‘B’ for 1500 ms, during which time participants were allowed to blink. The correctness of the responses was recorded and no feedback was provided during the experiment. The spoken stimuli were presented binaurally through the speakers. The experiment started with 15 practice trials to familiarize participants with the task. All these stimuli were equally divided into four sections and presented in a random order. Participants can take a rest during the intervals as long as they need.
2.4 EEG recording
electrodes (QuickCap, Neuromedical Supplies, Sterlig, USA) with a common vertex reference located between Cz and CPz. A ground electrode was placed on the
forehead anterior to Fz. The data were re-referenced off-line to the average of the left and right mastoids for further analysis. Vertical and horizontal eye movements were recorded by electrodes placed on the supra- and infra-orbital ridges of left eye, and the outer canthi of the left and right eyes. Electrode impedances were kept blow 5 KΩ. The EEG signal was continuously recorded and digitized at a rate of 1000 Hz.
2.5 EEMD decomposition
In this study, the EEG data were decomposed by applying the ensemble
empirical model decomposition (EEMD) (Wu & Huang, 2009), which is an advanced version of empirical mode decomposition (EMD) (N. E. Huang et al., 1998). Both EMD and EEMD, similar to traditional Fourier or Wavelet decomposition, are data-driven methods for decomposing nonlinear and non-stationary data into a set of intrinsic mode functions (IMFs) that represent the local properties of events in time and frequency. However, unlike Fourier transform or Wavelet decomposition that characterize the scale of a signal using pre-specified basis functions and have constant frequencies and weights, EMD and EEMD decompose data into a set of IMFs that are generated from the signal itself with no predefined basis system and allow the
frequency and the amplitudes to vary over time.
A few studies have applied EMD or EEMD to ERP data analysis and suggested
al., 2009; P. L. Lee, Chang, Hsieh, Deng, & Sun, 2012; Williams, Nasuto, & Saddy,
2011). For example, Hsu, Lee, and Liang (2016) applied EEMD to reanalyzed the
dataset of Cheng et al. (2013) and demonstrated that only one third of the original
trials were required to replicate the MMN effect with the approximate effect size.
Thus, this study applies the EEMD procedure of Hsu et al. (2016) for data analysis.
with a dominant frequency at 1 Hz (delta band).
--- Insert Figure 2 about here
--- Previous studies investigating the frequency characteristics of N400 have suggested that the semantically induced N400 effect is mainly found in the lower theta band (3-4.5 Hz) and delta band; additionally, the effect found in the late positive waveform (between 600 to 800 ms) was primarily found in the upper delta band (averaged frequency bins: 1.65-3 Hz) (Roehm, Bornkessel-Schlesewsky, &
Schlesewsky, 2007; Roehm, Schlesewsky, Bornkessel, Frisch, & Haider, 2004). We thus performed a summation across IMF 6, IMF7, and IMF 8 to cover the frequency
range from 0.5 to 6.5 Hz, and then averaged over all trials for each condition in each
channel separately to yield the event-related modes (ERMs) to represent the original
ERPs (as shown in Figure 3) (Al-Subari et al., 2015). Further analysis estimated the
mean amplitude of the N400 and LPC in the ERM components.
--- Insert Figure 3 about here
---
2.6 Statistical analyses for mean amplitudes
late positive component (LPC; from 700 to 900 ms). Based on previous studies, we aimed to differentiate between two types of P-O mapping effects for Chinese spoken word recognition in three ERP components: P200 from 225 to 275 ms, N400 from 450 to 650 ms and LPC from 700 to 900 ms. The mean amplitudes of these three ERP components were analyzed by a linear mixed model (LMM) in five regions of interest (ROIs), defined as follows: frontal (F3, F1, FZ, F2, F4), frontal-central (FC3, FC1, FCZ, FC2, FC4), central (C3, C1, CZ, C2, C4), central-parietal (CP3, CP1, CPZ, CP2, CP4), and parietal (P3, P1, PZ, P2, P4) ROIs. The data were fitted with the participant as the random factor and the P-O mapping type as the fixed factor (intercept: high HD/high OC, level 1: low HD/high OC, level 2: high HD/low OC). Sliding contrast was used to examine the homophone density effect (by contrasting level 1 low HD/high OC with the intercept high HD/high OC) and the orthographic consistency effect (by contrasting level 2 high HD/low OC with the intercept high HD/high OC). The absolute t-values of fixed effects larger than 1.96 were considered significant (Baayen, 2008). The estimated coefficient (β), standard error (SE), and t value for fixed effects were obtained by using the lmer function from the lme4 package, under R version 3.1.3 (R environment for statistical computing, R Development Core Team, 2014).
2.7Source analysis
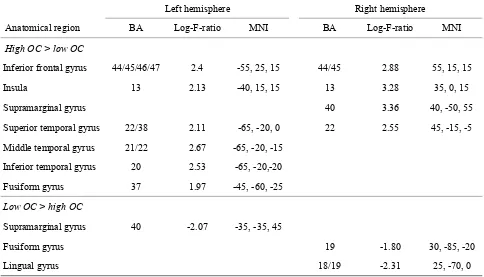
significant orthographic consistency effect and homophone density effect that were revealed in the previous mean amplitude analysis. The sLORETA was developed to resolve the inverse problem of EEG/MEG data by estimating the 3-D distribution of electrical neural activity on a dense grid of 6239 voxels at 5 mm spatial resolution, and calculating the standardized current density at each voxel in a realistic head model (Fuchs, Kastner, Wagner, Hawes, & Ebersole, 2002). We first calculated the sLORETA images for each condition to represent the electric activity at each voxel in neuroanatomic Talairach space, which were converted from MNI coordinates. The voxel-based sLORETA images were then compared across conditions to determine the statistical significance of the homophone density effect and orthographic consistency effect in regional neural activity by using the log-F-ratio statistic with sLORETA-built-in voxel-wise randomization tests (5000 random permutations). The randomization tests are based on statistical non-parametric mapping (SnPM) tools and corrected for multiple comparisons (Nichols & Holmes, 2002). The voxels with log-F-ratio above the significant level (p <0.001) were reported in Table 2.
--- Insert Table 2.1 about here
--- Insert Table 2.2 about here
3. Results
3.1 Behavioral data
Table 3 displays the mean reaction times (RTs) and error rates for each condition.
RTs were measured from target onset to button press. Trials with RTs greater than
three standard deviations (SDs) beyond the global mean of a participant were
discarded (less than 1%). The RTs and error rate were analyzed by a linear mixed
model (LMM) with the participant as the random factor and the P-O mapping type as
the fixed factor (intercept: high HD/high OC, level 1: low HD/high OC, level 2: high
HD/low OC). Sliding contrasts were used to examine the homophone density effect
(by contrasting level 1 low HD/high OC with the intercept high HD/high OC) and the
orthographic consistency effect (by contrasting level 2 high HD/low OC with the
intercept high HD/high OC). The analysis of reaction time revealed a significant
homophone density effect, in which participants responded faster to low HD/high OC
words than high HD/high OC words (ß = -80.7559, SE=21.3880, t=-3.776). However,
there was no significant orthographic consistency effect (ß=-.8749, SE=21.3880,
t=-0.041). For the analysis of error rate, neither homophone density effect (ß=-0.005,
SE=0.01296, t=-0.39) nor orthographic consistency effect (ß=-0.02, SE=0.0129,
t=-1.54) was significant.
--- Insert Table 3. about here
3.2 ERP data
Table 4 reports the results of LMM analyses for the homophone density effect and the orthographic consistency effect on P200, N400 and LPC in five ROIs.
In the P200 time window, neither the OC effect nor the HD effect could be
reliably found in any of the ROIs (all |t|s <1.96).
The analysis of N400 revealed a significant orthographic consistency effect, in which the words with high orthographic consistency elicited greater N400 amplitudes than those with low orthographic consistency, in frontal (β=0.6575,SE=
0.2346,t=2.802), frontal-central (β= 0.8960,SE= 0.2658,t=3.371), and
central (β=0.7676,SE=0.3011,t=2.549) ROIs. However, no homophone density effect could be reliably found in any of the ROIs (all |t|s <1.96).
In the LPC analysis, significant homophone density effects were found in frontal-central (β=0.7478,SE=0.3082,t=2.426), central (β= 0.8535,SE=
0.3149,t=2.711), central- parietal (β=0.9636,SE =0.3488,t= 2.762), and
parietal (β=1.0997,SE=0.3610,t=3.046) ROIs. The low homophone density words elicited greater LPC than the high homophone density words. However, there was no significant orthographic consistency effect in any of the ROIs (all |t|s <1.96).
--- Insert Table 4 about here
---
3.3 Source analyses
effect in the N400 and for the homophone density effect in the LPC. Compared to low orthographic consistent words, high consistency words showed greater activations in the bilateral inferior frontal gyrus (IFG) (BA 44, 45, 46, 47), bilateral insula (BA 13), right supramarginal gyrus (SMG) (BA40), bilateral superior temporal gyrus (STG) (BA 22, 38), left middle temporal gyrus (MTG) (BA 21, 22), inferior temporal gyrus (ITG) (BA 20), and left fusiform gyrus (BA 37). Greater activation for the low orthographic consistent words could only be found in the left supramarginal gyrus (BA 40), right fusiform gyrus (BA 19), and lingual gyrus (BA 18, 19).
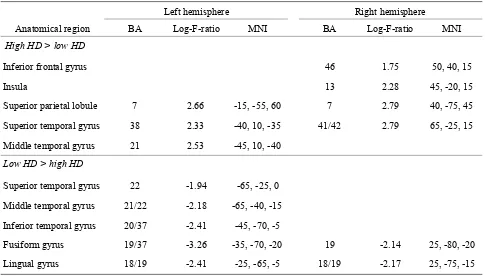
In the later time window of the LPC, the sLORETA analysis revealed greater activations for high homophone density words in the right IFG (BA 46), right insula (BA 13), bilateral superior parietal lobule (SPL) (BA 7), bilateral STG (BA 38, 41, 42), and left MTG (BA 21), than for low homophone density words. However, the low homophone density words showed greater activation in the left STG (BA 22), left MTG (BA 21, 22), left ITG (BA 20, 37), and bilateral fusiform (BA 19, 37) and lingual gyri (BA 18, 19) (shown inFigure 4).
--- Insert Figure 4 about here
---4. Discussion
effect could be reliably found. However, in the ERP data, effects of orthographic consistency and homophone density seem to show different temporal dynamics. To be more specific, the orthographic consistency effect, which indexes orthographic
variation at the radical level, was mainly found in the N400 time window with frontal to central distribution. Meanwhile, the homophone density effect, which indexes orthographic variation at the character level, was found in the LPC along the typical central-to-parietal distribution. These findings are congruent with findings from other languages and support orthographic information processing during Chinese spoken word recognition. Most importantly, this study differentiated two types of
orthographic variations, which play different roles during Chinese spoken word recognition.
First of all, our data showed orthographic consistency effect on N400, but not on
P200. Previous ERP studies on visual word recognition have suggested latencies
around 200 ms to be critically engaged in sublexical orthography-to-phonology
conversion across writing systems, such as English (Sereno, Rayner, & Posner, 1998),
Spanish (Carreiras, Duñabeitia, & Molinaro, 2009), and Chinese (Hsu et al., 2009; C.
Y. Lee et al., 2007). In contrast, although remaining controversial, most of the studies
on spoken word recognition reported the orthographic consistency effect between 375
to 750 but not on P200 (Pattamadilok et al., 2009; Perre et al., 2009; Perre & Ziegler,
2008), except for Pattamadilok et al. (2011) which found orthographic consistency
versus low OC conditions seemed to begin in the time window of P200, but it is
statistically not significant. A possible explanation for the discrepancy between visual
and auditory modalities is that, unlike visual words, spoken words are acoustic
patterns that become available to the listener gradually, and sequentially. It requires
some time (before the offset of the spoken word) for listener to accurately recognize
the word (the so-called isolation point) and every word has its own isolation point.
The timing variation may make it even much harder to find robust orthographic
consistency effect in early ERP component (such as P200) that usually has short
latency and also make the later ERP component (such as N400 and LPC) show
greater variation. For example, the N400 effects in auditory task tend to show longer
duration (from 350-750 msec) than that in the visual task (from 250 to 550mse)
(Kutas & Van Petten, 1994). Extra efforts to obtain the isolation point for every
auditory word in the future studies may further clarify this speculation.
mean that orthographically consistent words have stronger and more stable memory traces, and thus show reduced difficulty during lexical access. However, Pattamadilok et al. (2011) adopted a rhyming task and observed that high orthographically
consistent words elicited a larger N400 response than the low consistency words. This pattern is congruent with our current result showing an orthographic consistency effect in Chinese. Pattamadilok et al. (2011) drew an opposite interpretation, reporting that the consistent words were activated more strongly than the inconsistent words given that the stimuli were embedded in the No-go trials. This would create a larger mismatch in the No-trials and thus be reflected in the increased negative amplitude of the N400. They further suggested that the direction of the P-O consistency effect is largely dependent on task demand. However, this could not explain the increased N400 response for inconsistent words as observed in the Go/no-go semantic categorization task (Pattamadilok et al., 2009).
Another possible explanation is that the increased negativity of N400 reflects greater semantic activation, rather than greater semantic competition or processing difficulty. For example, studies have demonstrated that high imagery words
associated with richer semantic attributes (H. W. Huang, Lee, & Federmeier, 2010; H. W. Huang, Meyer, & Federmeier, 2012), or words with larger orthographic
phonograms that have more orthographic neighbors (phonetic radical combinability, which refers to the number of phonogram that share the same phonetic radical) or have higher phonetic consistency (Hsu et al., 2009; C. Y. Lee et al., 2007). In particular, when controlling for phonetic radical combinability, highly consistent phonograms elicited greater N400 responses than low consistency phonograms. This suggests that highly consistent phonograms have larger phonological family sizes (phonogram that share the same phonetic radical and with the same pronunciation) and therefore elicit greater N400 responses. This interpretation also applies to our current results, in that the homophone densities for well-controlled, high orthographic consistency words have more orthographic neighbors at the sublexical level
(homophones that sharing the same phonetic radical) and thus elicit greater N400 responses than the low orthographic consistency words.
This explanation is further supported by our source analysis results, which
showed greater activations for high orthographically consistent words in bilateral IFG, insula, and temporal-parietal regions (including right SMG, bilateral STG, and left MTG). These findings are congruent with Perre et al. (2009) who found greater activations for high consistency words in left temporoparietal areas. A 20 year review of neuroimaging studies has suggested that spoken word comprehension involves
bilateral STG for acoustic processing, left MTG and ITG for accessing semantics,
premotor and frontoparietal regions for articulatory processing, and ventral SMG for
consistency effect in brain regions of phonological and semantic processing supports
the phonological restructuring view. In other words, the orthographic knowledge shapes the phonological representations. Specifically, for Chinese monosyllabic word recognition, orthographically consistent homophones that contain the same phonetic radical would develop more robust phonological representations than the
orthographically inconsistent homophones associated with different phonetic radicals, and therefore elicited stronger activations in the corresponding brain regions.
fMRI methodologies. ERP technique is superior in measuring neural activity on a millisecond time scale, while fMRI, even with speed scanning methods, is still bound to second-scale hemodynamic responses. The inertia of the hemodynamic response makes it difficult to reveal brain activation that is time-locked with on-line processing. Therefore, the brain activation of the orthographic consistency effect may be
primarily associated with decisional processes, such that the conflict condition (inconsistent or dissimilarity) shows greater brain activation.
activation view. The two perspectives are not mutually exclusive.
Another important result is that the homophone density effect was found in the
later time window (700 to 900 ms), but not for the N400 component. The low
homophone density words elicited a greater late positivity than the high homophone
density words did in the central-to-posterior brain regions. The finding is similar to
Wang et al. (2012), who reported a homophone density effect in a later time window
(600 to 800 ms), although with a maximum value found in anterior sites. The possible
reason for the discrepancy in topographic distribution may be due to the further
control of orthographic consistency at the radical level in this study.
LPC has also been associated with decision-making process and explicit
recognition memory (Paller, Kutas, & McIsaac, 1995; Smith & Guster, 1993). For
example, in studies of memory recognition, the greater LPC amplitude has been found
in responding to the ‘old’ items than the ‘new’ items (Rugg et al., 1998), to more
deeply encoded items (Paller et al., 1995), and to words that consciously remembered
than just feel familiar (Smith & Guster, 1993). These findings suggest that the LPC is
sensitive to successful memory retrieval and recollection. Meanwhile, LPC is often
observed following the N400 response in auditory and spoken word recognition
(Bakker, Takashima, van Hell, Janzen, & McQueen, 2015; Kwon, Nam, & Lee, 2012).
Although the role of attention in the elicitation of N400 is still in debate, the
cumulative evidence so far tends to suggest that N400 is at least in part driven by
retrieval and integration (Hoshino & Thierry, 2012; Kutas & Federmeier, 2011;
Rohaut et al., 2015). For example, van Gaal et al. (2014) investigated the semantic
integration of multiple word and found similar N400 effect in both masked or
unmasked conditions, while the LPC effect could only be observed in unmasked
condition. Rohaut et al. (2015) also found the semantic congruency effect on N400 in
patients with or without impaired consciousness. However, such an effect on LPC
was absent in patients with impaired consciousness. These findings support a
two-stage model of semantic processing, in which the N400 indexes the first
non-conscious stage of semantic activation, whereas the LPC would be the neural
signature of conscious semantic processing (Rohaut et al., 2015).
In the present study, the high homophone density words are a set of homophones
that share the same phonetic radical and therefore are orthographic neighbors, but are
also associated with multiple meanings. Therefore, the high homophone density
words in this study may facilitate orthographic and phonological processing, but
encounter greater competition in meaning selection, especially in the current semantic
categorization task. The greater LPC for low homophone density words implies its
advantages in memory retrieval and decision making.
This speculation is further supported by the source analysis that revealed greater activation for high homophone density words in the left anterior temporal lobe (BA 38) and posterior STG (BA 21) areas that have been strongly linked to
lateral prefrontal cortex (BA 46), insula, and bilateral SPL (BA 7) that have been associated with effortful semantic retrieval (Demb & Glover, 1995; Spalek &
Thompson-Schill, 2008). Conversely, low homophone density words elicited greater activation in the left temporo-occipital junction (BA 20/37) and bilateral fusiform gyrus and lingual gyrus for orthographic activation, and in the left STG and MTG (BA 21/22) regions that serve as a substrate for sound-based representations of speech (Hickok & Poeppel, 2004, 2007; Specht, 2014).
5. Conclusion
This study dissociated two types of orthographic variations that affect Chinese
spoken word recognition, orthographic consistency effect on N400 and homophone
density effect on LPC, respectively. The orthographic consistency effect, which
indexes the orthographic variation at radical level, modulated the amplitude of the
N400. Similar to the typical concreteness and orthographic neighborhood size effects
found in N400, the greater N400 for high orthographic consistent words can be
accounted by the automatic spreading activation, which assumes the mental lexicon is
a semantic network. For a set of homophones that sharing the same phonetic radical,
activation to one of the orthographic nodes would automatically spread activation to
its neighboring nodes. This effect not only originated from the brain network for
phonological processing, but also from fusiform and visual cortical areas. The results
suggest that both phonological restructuring and orthographic co-activation may be
homophone density effect, which indexes the orthographic variation at the character
level, was found in a later time window to reflect the difficulty in successful retrieval
and decision making. The homophone density effect has been localized to the
temporal cortex for lexical/semantic processing and to the temporal-occipital junction for orthographic processing. Collectively, our data support the position that
orthographic information shapes the phonological representation and that orthographic information can be co-activated during Chinese spoken word recognition.
Acknowledgements
References
Al-Subari, K., Al-Baddai, S., Tome, A. M., Volberg, G., Hammwohner, R., & Lang, E. W. (2015). Ensemble Empirical Mode Decomposition Analysis of EEG Data Collected during a Contour Integration Task. PLoS One, 10(4), e0119489. doi:10.1371/journal.pone.0119489
Allan, K., & Rugg, M. D. (1997). An event-related potential study of explicit memory on tests of cued recall and recognition. Neuropsychologia, 35(4), 387-397. Baayen, R. H. (2008). Analyzing linguistic data: A practical introduction to statistics
using R: Cambridge University Press.
Bakker, I., Takashima, A., van Hell, J. G., Janzen, G., & McQueen, J. M. (2015). Tracking lexical consolidation with ERPs: Lexical and semantic-priming effects on N400 and LPC responses to newly-learned words.
Neuropsychologia, 79(Pt A), 33-41.
doi:10.1016/j.neuropsychologia.2015.10.020
Binder, J. R., Desai, R. H., Graves, W. W., & Conant, L. L. (2009). Where is the semantic system? A critical review and meta-analysis of 120 functional neuroimaging studies. Cerebral Cortex, 19(12), 2767-2796.
Booth, J. R., Burman, D. D., Meyer, J. R., Gitelman, D. R., Parrish, T. B., & Mesulam, M. M. (2002). Functional anatomy of intra- and cross-modal lexical tasks. Neuroimage, 16(1), 7-22. doi:10.1006/nimg.2002.1081
Booth, J. R., Cho, S., Burman, D. D., & Bitan, T. (2007). Neural correlates of mapping from phonology to orthography in children performing an auditory spelling task. Dev Sci, 10(4), 441-451. doi:10.1111/j.1467-7687.2007.00598.x Cao, F., Khalid, K., Lee, R., Brennan, C., Yang, Y., Li, K., . . . Booth, J. R. (2011).
Development of brain networks involved in spoken word processing of Mandarin Chinese. Neuroimage, 57(3), 750-759.
doi:10.1016/j.neuroimage.2010.09.047
Cao, F., Khalid, K., Zaveri, R., Bolger, D. J., Bitan, T., & Booth, J. R. (2010). Neural correlates of priming effects in children during spoken word processing with orthographic demands. Brain Lang, 114(2), 80-89.
doi:10.1016/j.bandl.2009.07.005
contribute differently to visual word recognition: ERPs of relative position priming. Cerebral Cortex, 19(11), 2659-2670.
Cheng, Y. Y., Wu, H. C., Tzeng, Y. L., Yang, M. T., Zhao, L. L., & Lee, C. Y. (2013). The development of mismatch responses to Mandarin lexical tones in early infancy. Developmental neuropsychology, 38(5), 281-300.
Chereau, C., Gaskell, M. G., & Dumay, N. (2007). Reading spoken words: orthographic effects in auditory priming. Cognition, 102, 341-360. Cong, F., Sipola, T., Huttunen-Scott, T., Xu, X., Ristaniemi, T., & Lyytinen, H.
(2009). Hilbert-Huang versus Morlet wavelet transformation on mismatch negativity of children in uninterrupted sound paradigm. Nonlinear biomedical physics, 3(1), 1. doi:10.1186/1753-4631-3-1
Dehaene, S., Pegado, F., Braga, L. W., Ventura, P., Nunes Filho, G., Jobert, A., . . . Cohen, L. (2010). How learning to read changes the cortical networks for vision and language. Science, 330(6009), 1359-1364.
Demb, J. B., & Glover, H. (1995). Semantic Encoding. The Journal of Neuroscience, 15(9), 5870-5878.
Ferrand, L., & Grainger, J. (2003). Homophone interference effects in visual word recognition. Q J Exp Psychol A, 56(3), 403-419.
doi:10.1080/02724980244000422
Fuchs, M., Kastner, J., Wagner, M., Hawes, S., & Ebersole, J. S. (2002). A standardized boundary element method volume conductor model. Clinical Neurophysiology, 113(5), 702-712.
Hickok, G., & Poeppel, D. (2004). Dorsal and ventral streams: a framework for understanding aspects of the functional anatomy of language. Cognition, 92(1-2), 67-99. doi:10.1016/j.cognition.2003.10.011
Hickok, G., & Poeppel, D. (2007). The cortical organization of speech processing. Nat Rev Neurosci, 8(5), 393-402. doi:10.1038/nrn2113
Holcomb, P. J., Grainger, J., & O'Rourke, T. (2002). An electrophysiological study of the effects of orthographic neighborhood size on printed word perception. J Cogn Neurosci, 14(6), 938-950. doi:10.1162/089892902760191153
semantic access in bilinguals. Frontiers in psychology, 3, 52-57.
Hsu, C. H., Lee, C. Y., & Liang, W. K. (2016). An improved method for measuring mismatch negativity using ensemble empirical mode decomposition. J Neurosci Methods, 264, 78-85. doi:10.1016/j.jneumeth.2016.02.015 Hsu, C. H., Lee, C. Y., & Tzeng, O. J. (2014). Early MEG markers for reading
Chinese phonograms: Evidence from radical combinability and consistency effects. Brain Lang, 139, 1-9. doi:10.1016/j.bandl.2014.09.008
Hsu, C. H., Tsai, J. L., Lee, C. Y., & Tzeng, O. J. (2009). Orthographic combinability and phonological consistency effects in reading Chinese phonograms: an event-related potential study. Brain Lang, 108(1), 56-66.
doi:10.1016/j.bandl.2008.09.002
Huang, H. W., Lee, C. L., & Federmeier, K. D. (2010). Imagine that! ERPs provide evidence for distinct hemispheric contributions to the processing of concrete and abstract concepts. Neuroimage, 49(1), 1116-1123.
doi:10.1016/j.neuroimage.2009.07.031
Huang, H. W., Lee, C. Y., Tsai, J. L., Lee, C. L., Hung, D. L., & Tzeng, O. J. (2006). Orthographic neighborhood effects in reading Chinese two-character words. Neuroreport, 17(10), 1061-1065.
Huang, H. W., Meyer, A. M., & Federmeier, K. D. (2012). A "concrete view" of aging: event related potentials reveal age-related changes in basic integrative processes in language. Neuropsychologia, 50(1), 26-35.
doi:10.1016/j.neuropsychologia.2011.10.018
Huang, N. E., Shen, Z., Long, S. R., Wu, M. C., Shih, H. H., Zheng, Q., . . . Liu, H. H. (1998). The empirical mode decomposition and the Hilbert spectrum for nonlinear and non-stationary time series analysis. Paper presented at the Proceedings of the Royal Society of London A: Mathematical, Physical and Engineering Sciences.
Jared, D. (2002). Spelling-sound consistency and regularity effects in word naming. Journal of Memory and Language, 46(4), 723-750.
Kutas, M., & Van Petten, C. (1994). Psycholinguistics electrified. Handbook of psycholinguistics, 83-143.
Kwon, Y., Nam, K., & Lee, Y. (2012). ERP index of the morphological family size effect during word recognition. Neuropsychologia, 50(14), 3385-3391. doi:10.1016/j.neuropsychologia.2012.09.041
Lee, C. Y. (2011). The Statistical Perspective on Chinese Reading. In P. McCardle, B. Miller, J. R. Lee, & O. J. L. Tzeng (Eds.), Dyslexia Across Languages:
Orthography and the Brain-Gene-Behavior Link. Baltimore: Paul H. Brookes Publishing Co.
Lee, C. Y., Hsu, C. H., Chang, Y. N., Chen, W. F., & Chao, P. C. (2015). The Feedback Consistency Effect in Chinese Character Recognition: Evidence from a Psycholinguistic Norm. Language and Linguistics, 16(4), 535-554. doi:10.1177/1606822x15583238
Lee, C. Y., Huang, H. W., Kuo, W. J., Tsai, J. L., & Tzeng, O. J. L. (2010). Cognitive and neural basis of the consistency and lexicality effects in reading Chinese. Journal of Neurolinguistics, 23(1), 10-27.
doi:10.1016/j.jneuroling.2009.07.003
Lee, C. Y., Tsai, J. L., Chan, W. H., Hsu, C. H., Hung, D. L., & Tzeng, O. J. L. (2007). Temporal dynamics of the consistency effect in reading Chinese: an event-related potentials study. Neuroreport, 18(2), 147-151.
doi:10.1097/WNR.0b013e328010d4e4
Lee, C. Y., Tsai, J. L., Kuo, W. J., Yeh, T. C., Wu, Y. T., Ho, L. T., . . . Hsieh, J. C. (2004). Neuronal correlates of consistency and frequency effects on Chinese character naming: an event-related fMRI study. Neuroimage, 23(4),
1235-1245. doi:10.1016/j.neuroimage.2004.07.064
Lee, C. Y., Tsai, J. L., Su, E. C. I., Tzeng, O. J. L., & Hung, D. L. (2005).
Consistency, regularity, and frequency effects in naming Chinese characters. Lee, P. L., Chang, H. C., Hsieh, T. Y., Deng, H. T., & Sun, C. W. (2012). A
McCandliss, B. D., Cohen, L., & Dehaene, S. (2003). The visual word form area: expertise for reading in the fusiform gyrus. Trends Cogn Sci, 7, 293-299. Miller, K. M., & Swick, D. (2003). Orthography influences the perception of speech
in alexic patients. J Cogn Neurosci, 15(7), 981-990. doi:10.1162/089892903770007371
Montant, M., Schon, D., Anton, J. L., & Ziegler, J. C. (2011). Orthographic Contamination of Broca's Area. Front Psychol, 2, 378.
doi:10.3389/fpsyg.2011.00378
Muneaux, M., & Ziegler, J. (2004). Locus of orthographic effects in spoken word recognition: Novel insights from the neighbour generation task. Language and Cognitive Processes, 19(5), 641-660.
Nichols, T. E., & Holmes, A. P. (2002). Nonparametric permutation tests for functional neuroimaging: a primer with examples. Human brain mapping, 15(1), 1-25.
Paller, K. A., & Kutas, M. (1992). Brain Potentials during Memory Retrieval Provide Neurophysiological Support for the Distinction between Conscious
Recollection and Priming. J Cogn Neurosci, 4(4), 375-392. doi:10.1162/jocn.1992.4.4.375
Paller, K. A., Kutas, M., & McIsaac, H. K. (1995). Monitoring conscious recollection via the electrical activity of the brain. Psychological Science, 6(2), 107-111. Pattamadilok, C., Knierim, I. N., Kawabata Duncan, K. J., & Devlin, J. T. (2010).
How does learning to read affect speech perception? J Neurosci, 30(25), 8435-8444. doi:10.1523/JNEUROSCI.5791-09.2010
Pattamadilok, C., Kolinsky, R., Luksaneeyanawin, S., & Morais, J. (2008). Orthographic congruency effects in the suprasegmental domain: evidence from Thai. Q J Exp Psychol (Hove), 61(10), 1515-1537.
doi:10.1080/17470210701587305
Pattamadilok, C., Morais, J., Ventura, P., & Kolinsky, R. (2007). The locus of the orthographic consistency effect in auditory word recognition: Further evidence from French. Language and Cognitive Processes, 22(5), 1-27. doi:Doi
10.1080/01690960601049628
influences on spoken language in a semantic task. J Cogn Neurosci, 21(1), 169-179. doi:10.1162/jocn.2009.21014
Pattamadilok, C., Perre, L., & Ziegler, J. C. (2011). Beyond rhyme or reason: ERPs reveal task-specific activation of orthography on spoken language. Brain Lang, 116(3), 116-124. doi:10.1016/j.bandl.2010.12.002
Perre, L., Bertrand, D., & Ziegler, J. C. (2011). Literacy Affects Spoken Language in a Non-Linguistic Task: An ERP Study. Front Psychol, 2, 274.
doi:10.3389/fpsyg.2011.00274
Perre, L., Pattamadilok, C., Montant, M., & Ziegler, J. C. (2009). Orthographic effects in spoken language: on-line activation or phonological restructuring? Brain Res, 1275, 73-80. doi:10.1016/j.brainres.2009.04.018
Perre, L., & Ziegler, J. C. (2008). On-line activation of orthography in spoken word recognition. Brain Res, 1188, 132-138.
Pexman, P. M., Lupker, S. J., & Jared, D. (2001). Homophone effects in lexical decision. Journal of Experimental Psychology: Learning, Memory, and Cognition, 27(1), 139-156. doi:10.1037//0278-7393.27.1.139
Price, C. J. (2012). A review and synthesis of the first 20 years of PET and fMRI studies of heard speech, spoken language and reading. Neuroimage, 62(2), 816-847. doi:10.1016/j.neuroimage.2012.04.062
Roehm, D., Bornkessel-Schlesewsky, I., & Schlesewsky, M. (2007). The internal structure of the N400: Frequency characteristic of a language related ERP component. Chaos and Complexity letters, 2(2), 365-395.
Roehm, D., Schlesewsky, M., Bornkessel, I., Frisch, S., & Haider, H. (2004). Fractionating language comprehension via frequency characteristics of the human EEG. Neuroreport, 15(3), 409-412.
Rohaut, B., Faugeras, F., Chausson, N., King, J. R., El Karoui, I., Cohen, L., & Naccache, L. (2015). Probing ERP correlates of verbal semantic processing in patients with impaired consciousness. Neuropsychologia, 66, 279-292. Rugg, M. D., Mark, R. E., Walla, P., Schloerscheidt, A. M., Birch, C. S., & Allan, K.
(1998). Dissociation of the neural correlates of implicit and explicit memory. Nature, 392(6676), 595-598.
Monitoring. Journal of Experimental Psychology-Human Learning and Memory, 5(6), 546-554.
Sereno, S. C., Rayner, K., & Posner, M. I. (1998). Establishing a time‐line of word recognition: evidence from eye movements and event‐related potentials. Neuroreport, 9(10), 2195-2200.
Slowiaczek, L. M., Soltano, E. G., Wieting, S. J., & Bishop, K. L. (2003). An
investigation of phonology and orthography in spoken-word recognition. The Quarterly Journal of Experimental Psychology: Section A, 56(2), 233-262. Smith, M. E., & Guster, K. (1993). Decomposition of recognition memory
event-related potentials yields target, repetition, and retrieval effects. Electroencephalography and Clinical Neurophysiology, 86(5), 335-343. Spalek, K., & Thompson-Schill, S. L. (2008). Task-dependent semantic interference
in language production: An fMRI study. Brain and Language, 107(3), 220-228.
Specht, K. (2014). Neuronal basis of speech comprehension. Hear Res, 307, 121-135. doi:10.1016/j.heares.2013.09.011
Taft, M., Castles, A., Davis, C., Lazendic, G., & Nguyen-Hoan, M. (2008). Automatic activation of orthography in spoken word recognition: Pseudohomograph priming. Journal of Memory and Language, 58, 366-379.
Tan, L. H., & Perfetti, C. A. (1997). Visual Chinese character recognition: Does phonological information mediate access to meaning? Journal of Memory and Language, 37(1), 41-57.
van Gaal, S., Naccache, L., Meuwese, J. D. I., van Loon, A. M., Leighton, A. H., Cohen, L., & Dehaene, S. (2014). Can the meaning of multiple words be integrated unconsciously? Philosophical Transactions of the Royal Society of London B: Biological Sciences, 369(1641), 20130212.
Van Orden, G. C. (1987). A ROWS is a ROSE: Spelling, sound, and reading. Mem Cognit, 15, 181-198.
Ventura, P., Kolinsky, R., Pattamadilok, C., & Morais, J. (2008). The developmental turnpoint of orthographic consistency effects in speech recognition. J Exp Child Psychol, 100(2), 135-145. doi:10.1016/j.jecp.2008.01.003
orthographic consistency effect in auditory word recognition. Language and Cognitive Processes, 19(1), 57 - 95.
Wang, W., Li, X., Ning, N., & Zhang, J. X. (2012). The nature of the homophone density effect: an ERP study with Chinese spoken monosyllable homophones. Neurosci Lett, 516(1), 67-71. doi:10.1016/j.neulet.2012.03.059
Williams, N., Nasuto, S. J., & Saddy, J. D. (2011). Evaluation of Empirical Mode Decomposition for Event-Related Potential Analysis. Eurasip Journal on Advances in Signal Processing. doi:Artn 965237
Doi 10.1155/2011/965237
Wu, Z., & Huang, N. E. (2009). Ensemble Empirical Mode Decomposition: A Noise-Assisted Data Analysis Method. Advances in Adaptive Data Analysis, 01(01), 1-41. doi:doi:10.1142/S1793536909000047
Xu, Y., Pollatsek, A., & Potter, M. C. (1999). The activation of phonology during silent Chinese word reading. J Exp Psychol Learn Mem Cogn, 25(4), 838-857. Yoncheva, Y. N., Zevin, J. D., Maurer, U., & McCandliss, B. D. (2010). Auditory
selective attention to speech modulates activity in the visual word form area. Cerebral Cortex, 20(3), 622-632.
Ziegler, J. C., & Goswami, U. (2005). Reading acquisition, developmental dyslexia, and skilled reading across languages: a psycholinguistic grain size theory. Psychological bulletin, 131(1), 3.
Ziegler, J. C., Petrova, A., & Ferrand, L. (2008). Feedback consistency effects in visual and auditory word recognition: where do we stand after more than a decade? J Exp Psychol Learn Mem Cogn, 34(3), 643-661.
doi:10.1037/0278-7393.34.3.643
Figure Legends
Figure 1. Example of Chinese characters for the three experimental conditions: low HD/high OC, high HD/high OC and high HD/low OC.
Figure 2. EEMD decomposition of grand average ERPs. Plots in the left column represent 9 IMFs and residuals at Cz. Plots in the right column represent related Hilbert spectra for the corresponding IMFs.
Figure 3. The ERMs from three conditions at the frontal-to-parietal distributed electrodes: Fz, FCz, Cz, CPz, and Pz. Black solid lines represent the high homophone density/ high orthographic consistency (high HD/ high OC) condition, grey solid lines represent the high homophone density/ low orthographic consistency (high HD/ low OC) condition, and black dotted lines represent the low homophone density/ high orthographic consistency (low HD/ high OC) condition.
Figure 4. The image shows LORETA slices in Talairach space for the estimated source distributions. For the orthographic consistency effect (upper panel), red colors indicate that high HD/ high OC words showed greater activity, and blue colors indicate that Low OC words elicited greater activity. For the homophone density effect (lower panel), red colors indicate that high HD/ high OC words showed greater activity, and blue colors indicate Low HD words elicited greater activity. The
Conditions Low HD/ high OC High HD/ high OC High HD/ low OC
[image:47.595.55.476.87.163.2]Key: BA: Brodmann area; MNI: Montreal neurological institute coordinates. Significant at p <.001 (The critical log-F-ratio for p < .001 was ±1.561022). The x-, y-, and z-coordinates were showed for the maximum log-F-log-F-ratio value in each location.
Left hemisphere Right hemisphere
Anatomical region BA Log-F-ratio MNI BA Log-F-ratio MNI
High OC > low OC
Inferior frontal gyrus 44/45/46/47 2.4 -55, 25, 15 44/45 2.88 55, 15, 15
Insula 13 2.13 -40, 15, 15 13 3.28 35, 0, 15
Supramarginal gyrus 40 3.36 40, -50, 55
Superior temporal gyrus 22/38 2.11 -65, -20, 0 22 2.55 45, -15, -5
Middle temporal gyrus 21/22 2.67 -65, -20, -15 Inferior temporal gyrus 20 2.53 -65, -20,-20
Fusiform gyrus 37 1.97 -45, -60, -25
Low OC > high OC
Supramarginal gyrus 40 -2.07 -35, -35, 45
Fusiform gyrus 19 -1.80 30, -85, -20
[image:48.595.56.540.88.365.2]Key: BA: Brodmann area; MNI: Montreal neurological institute coordinates. Significant at p <.001 (The critical log-F-ratio for p < .001 was ±1.564657). The x-, y-, and z-coordinates were showed for the maximum log-F-log-F-ratio value in each location.
Left hemisphere Right hemisphere
Anatomical region BA Log-F-ratio MNI BA Log-F-ratio MNI
High HD > low HD
Inferior frontal gyrus 46 1.75 50, 40, 15
Insula 13 2.28 45, -20, 15
Superior parietal lobule 7 2.66 -15, -55, 60 7 2.79 40, -75, 45
Superior temporal gyrus 38 2.33 -40, 10, -35 41/42 2.79 65, -25, 15
Middle temporal gyrus 21 2.53 -45, 10, -40
Low HD > high HD
Superior temporal gyrus 22 -1.94 -65, -25, 0
Middle temporal gyrus 21/22 -2.18 -65, -40, -15
Inferior temporal gyrus 20/37 -2.41 -45, -70, -5
Fusiform gyrus 19/37 -3.26 -35, -70, -20 19 -2.14 25, -80, -20
[image:49.595.56.541.85.361.2]Conditions Mean RT (ms) SD Errors (%) SD
Low HD/ high OC 1274.84 222.83 7.17 5.40
High HD/ high OC 1355.59 291.32 6.67 7.45
[image:50.595.88.507.104.183.2]* Significant at |t|s >1.96
225-275 ms 450-650 ms 700-900 ms
ROIs Variables Beta Std.Error t-value Beta Std.Error t-value Beta Std.Error t-value
Frontal (Intercept) 2.0211 0.5026 4.021 -2.1303 0.2881 -7.394 -0.9723 0.3317 -2.931
HD effect -0.2135 0.4292 -0.497 0.2717 0.2346 1.158 0.5160 0.3340 1.545
OC effect -0.6294 0.4292 -1.466 0.6575 0.2346 2.802* -0.0663 0.3340 -0.199
Frontal-central (Intercept) 2.1274 0.5377 3.956 -2.5964 0.2803 -9.264 -0.9429 0.3012 -3.131 HD effect 0.0519 0.4465 0.116 0.2807 0.2658 1.056 0.7478 0.3082 2.426*
OC effect -0.7243 0.4465 -1.622 0.8960 0.2658 3.371* 0.0679 0.3082 0.221
Central (Intercept) 1.6442 0.5358 3.068 -2.5973 0.2713 -9.572 -0.7938 0.2929 -2.711
HD effect 0.0276 0.4442 0.062 0.0693 0.3011 0.230 0.8535 0.3149 2.711*
OC effect -0.8278 0.4442 -1.864 0.7676 0.3011 2.549* 0.1741 0.3149 0.553
Central-parietal (Intercept) 0.4555 0.5097 0.894 -2.0766 0.3073 -6.758 0.5109 0.3167 -1.613 HD effect 0.1559 0.4303 0.362 0.0701 0.3141 0.223 0.9636 0.3488 2.762*
OC effect -0.6540 0.4303 -1.520 0.5331 0.3141 1.697 0.2771 0.3488 0.794
Parietal (Intercept) -0.7815 0.4769 -1.639 -1.2642 0.3365 -3.757 -0.1735 0.3533 -0.496
HD effect 0.2801 0.3875 0.723 0.0119 0.2879 0.041 1.0997 0.3610 3.046*
[image:51.595.39.559.82.477.2]