PAHSAs enhance hepatic and systemic insulin
sensitivity through direct and indirect
mechanisms
Peng Zhou, … , Dionicio Siegel, Barbara B. Kahn
J Clin Invest.
2019;
129(10)
:4138-4150.
https://doi.org/10.1172/JCI127092
.
Palmitic acid esters of hydroxy stearic acids (PAHSAs) are bioactive lipids with
antiinflammatory and antidiabetic effects. PAHSAs reduce ambient glycemia and improve
glucose tolerance and insulin sensitivity in insulin-resistant aged chow- and high-fat diet–
fed (HFD-fed) mice. Here, we aimed to determine the mechanisms by which PAHSAs
improve insulin sensitivity. Both acute and chronic PAHSA treatment enhanced the action of
insulin to suppress endogenous glucose production (EGP) in chow- and HFD-fed mice.
Moreover, chronic PAHSA treatment augmented insulin-stimulated glucose uptake in
glycolytic muscle and heart in HFD-fed mice. The mechanisms by which PAHSAs
enhanced hepatic insulin sensitivity included direct and indirect actions involving intertissue
communication between adipose tissue and liver. PAHSAs inhibited lipolysis directly in
WAT explants and enhanced the action of insulin to suppress lipolysis during the clamp in
vivo. Preventing the reduction of free fatty acids during the clamp with Intralipid infusion
reduced PAHSAs’ effects on EGP in HFD-fed mice but not in chow-fed mice. Direct hepatic
actions of PAHSAs may also be important, as PAHSAs inhibited basal and
glucagon-stimulated EGP directly in isolated hepatocytes through a cAMP-dependent pathway
involving G
a
iprotein–coupled receptors. Thus, this study advances our understanding of
PAHSA biology and the physiologic mechanisms by which PAHSAs exert beneficial
metabolic effects.
Research Article
Endocrinology
Metabolism
Find the latest version:
Introduction
Type 2 diabetes (T2D) is a worldwide epidemic that affected 425 million people in 2017, as estimated by the International Diabe-tes Federation (1). The major pathogenic factors in T2D are resis-tance to the actions of insulin in adipose tissue, muscle, and liver, and dysregulated insulin secretion. Whole-body glucose homeo-stasis is maintained primarily by a balance between endogenous glucose production (EGP), mainly from the liver, and glucose uptake by muscle, adipose tissue, and liver (2). EGP is regulated by hormones, substrates, and neuronal signals. For example, glu-cagon and catecholamines activate Gαs protein–coupled receptors
and increase EGP through a cAMP-dependent pathway, which involves PKA activation (3). On the other hand, insulin suppresses EGP directly through an insulin receptor/PI3K pathway and indi-rectly through the suppression of adipose tissue lipolysis (4–7). Impaired suppression of EGP by insulin (direct or indirect) con-tributes to the fasting hyperglycemia in T2D. Hence, restoring hepatic and systemic insulin sensitivity is an effective approach to prevent and treat T2D. However, few insulin-sensitizing med-ications are currently available, and those that are available have
significant side effects and are not used widely (8, 9). Because hyperinsulinemia and insulin resistance have been implicated in the risk for cardiovascular disease, cancer, neurodegenerative dis-eases, and cognitive dysfunction (10–12), there is a major need for insulin sensitizers to reduce the burden of metabolic disease.
Our laboratory discovered a class of structurally novel bioactive lipids, branched fatty acid esters of hydroxy fatty acids (FAHFAs), that are synthesized in humans, animals, and plants, and have anti-diabetic and antiinflammatory properties (13–15). FAHFAs consist of a fatty acid and a hydroxy fatty acid linked by an ester bond. An in silico analysis predicted that more than 1000 structurally distinct FAHFAs could exist (16), and we and others identified more than 20 FAHFA families in mammalian tissues and 49 families in plants (13–15). Serum levels of one FAHFA family, palmitic acid esters of hydroxy stearic acid (PAHSAs), correlate highly with insulin sen-sitivity in humans, and PAHSA levels in serum and subcutaneous (SQ) adipose tissue are lower in insulin-resistant compared with insulin-sensitive people (13). Furthermore, others showed that lev-els of 5-PAHSA in breast milk are negatively correlated with obesity in nursing mothers (17). PAHSA levels are also decreased in liver and SQ adipose tissue (but not in perigonadal adipose tissue) of mice with high-fat diet–induced (HFD-induced) insulin resistance (13). PAHSAs enhance glucose tolerance and insulin sensitivity in chow- and HFD-fed mice without altering adiposity (13, 18, 19), potentiate insulin and GLP-1 secretion in aged chow-fed mice (18), and have antiinflammatory properties (13, 14, 18, 20). PAHSAs also augment glucose-stimulated insulin secretion in human islets from nondiabetic individuals and those with T2D (13, 18, 21). Recent data
Palmitic acid esters of hydroxy stearic acids (PAHSAs) are bioactive lipids with antiinflammatory and antidiabetic effects. PAHSAs reduce ambient glycemia and improve glucose tolerance and insulin sensitivity in insulin-resistant aged chow- and high-fat diet–fed (HFD-fed) mice. Here, we aimed to determine the mechanisms by which PAHSAs improve insulin sensitivity. Both acute and chronic PAHSA treatment enhanced the action of insulin to suppress endogenous glucose production (EGP) in chow- and HFD-fed mice. Moreover, chronic PAHSA treatment augmented insulin-stimulated glucose uptake in glycolytic muscle and heart in HFD-fed mice. The mechanisms by which PAHSAs enhanced hepatic insulin sensitivity included direct and indirect actions involving intertissue communication between adipose tissue and liver. PAHSAs inhibited lipolysis directly in WAT explants and enhanced the action of insulin to suppress lipolysis during the clamp in vivo. Preventing the reduction of free fatty acids during the clamp with Intralipid infusion reduced PAHSAs’ effects on EGP in HFD-fed mice but not in chow-fed mice. Direct hepatic actions of PAHSAs may also be important, as PAHSAs inhibited basal and glucagon-stimulated EGP directly in isolated hepatocytes through a cAMP-dependent pathway involving Gαi protein–coupled receptors. Thus, this study advances our understanding of PAHSA biology and the physiologic mechanisms by which PAHSAs exert beneficial metabolic effects.
PAHSAs enhance hepatic and systemic insulin
sensitivity through direct and indirect mechanisms
Peng Zhou,1 Anna Santoro,1 Odile D. Peroni,1 Andrew T. Nelson,2 Alan Saghatelian,3 Dionicio Siegel,2 and Barbara B. Kahn1
1Division of Endocrinology, Diabetes and Metabolism, Department of Medicine, Beth Israel Deaconess Medical Center and Harvard Medical School, Boston, Massachusetts, USA. 2Skaggs School of Pharmacy and Pharmaceutical Sciences, UCSD, La Jolla, California, USA. 3Clayton Foundation Laboratories for Peptide Biology, Helmsley Center for Genomic Medicine,
Salk Institute for Biological Studies, La Jolla, California, USA.
Authorship note: PZ and A. Santoro are co–first authors.
Conflict of interest: BBK and A. Saghatelian are inventors on patents related to PAHSAs: WO2013166431A1 and WO2017070515A3.
Copyright: © 2019, American Society for Clinical Investigation.
Submitted: December 28, 2018; Accepted: June 24, 2019; Published: August 26, 2019.
Insulin levels were elevated in both vehicle- and PAHSA-treat-ed HFD-fPAHSA-treat-ed mice comparPAHSA-treat-ed with chow-fPAHSA-treat-ed mice, reflecting their insulin resistance, and acute PAHSA infusion did not change ambient serum insulin levels on either diet (Figure 1D). Fasting induces hormones such as glucagon that increase hepatic glu-cose production by increasing cAMP and activating PKA, which phosphorylates target proteins such as cAMP response element binding protein (CREB) (28). Therefore, we aimed to determine whether the acute effect of 9-PAHSA on EGP is due to attenuation of the PKA signaling cascade. Figure 1E shows that 9-PAHSA infu-sion reduced CREB phosphorylation by 48% in liver. In addition, 9-PAHSA infusion decreased the expression of 2 CRE-contain-ing genes, glucose-6 phosphatase catalytic subunit (G6pc1) and phosphoenolpyruvate carboxykinase 1 (Pck1), by 66% and 32%, respectively, in chow-fed mice (Figure 1F), consistent with effects on PKA signaling. Moreover, 9-PAHSA infusion reduced G6pc1 mRNA levels by 76% in mice on an HFD, similar to the results in chow-fed mice (Figure 1F). 9-PAHSA infusion also decreased hepatic glucose-6-phosphatase (G6pase) maximal activity in liv-er of both chow- and HFD-fed mice, without changing Km (Figure 1G). G6pase is rapidly regulated by cAMP (29) and catalyzes the rate-limiting step of glucose output, which exerts greater control than Pck1 on the short-term regulation of EGP (30, 31). Taken together, these data indicate that acute PAHSA administration decreases EGP through inhibition of the cAMP/PKA signaling pathway, which leads to decreased G6pase activity.
Chronic PAHSA treatment decreases glycemia during pyruvate and lactate tolerance test in chow- and HFD-fed mice. To determine
whether chronic PAHSA treatment can prevent the insulin resis-tance that is characteristic of HFD feeding, we delivered 5-PAHSA (0.1 mg/d) and 9-PAHSA (0.4 mg/d) via subcutaneous osmotic minipumps starting with the initiation of HFD feeding. We selected 9- and 5-PAHSA because 9-PAHSA is the most abundant isomer in WAT and brown adipose tissue (BAT) in WT mice and is also down-regulated in WAT of insulin-resistant humans (13); and 5-PAHSA is the most consistently downregulated isomer in serum and all adipose depots of insulin-resistant mice and in WAT and serum of insulin-resistant humans (13). Since serum levels of 9-PAHSA are 3-fold higher than those of 5-PAHSA (13), we administrated 9- and 5-PAHSA at a 3:1 ratio. PAHSA treatment had no effect on body weight (Figure 2A), fat mass, or food intake (Supplemental Figure 2, A and B), consistent with our previous study, in which we treated mice that had already been on an HFD with PAHSAs (18). In HFD-fed mice, PAHSA treatment did not change glucagon levels after 5-hour food removal (Supplemental Figure 2C). In chow-fed mice, serum 5-PAHSA levels increased 3.5-fold and 9-PAHSA levels 2.5-fold relative to those in vehicle-treated mice, and in HFD-fed mice 5-PAHSA levels increased 7-fold and 9-PAHSA levels 3.7-fold rel-ative to chow/vehicle levels (Figure 2B). The greater fold increase in HFD-fed mice most likely reflects the higher treatment dose compared with our previous study in mice already on an HFD (18). Consistent with the effects observed with a single dose of PAHSAs (Supplemental Figure 1), chronic PAHSA treatment also decreased glycemia during pyruvate and lactate challenge in 18-hour-fasted chow- and HFD-fed mice (Supplemental Figure 3).
Chronic PAHSA treatment increases hepatic and systemic insu-lin sensitivity in chow-fed mice. To examine whether the inhibitory
also show that PAHSAs promote adipocyte differentiation (22) and browning (23). However, recently Pflimlin et al. (24) failed to find beneficial metabolic effects with a single dose or 6-day treatment with PAHSAs in HFD-fed mice (24). Many important method-ological issues contributed to their negative results, and these are discussed extensively in recent publications (25, 26). In addition, another group using the same vehicle as Yore et al. (13) also found improved glucose tolerance in HFD-fed but not db/db mice (27).
In the current study, we demonstrate using a more sophisticat-ed technique, the hyperinsulinemic-euglycemic clamp, that PAHSAs are indeed insulin sensitizers. Furthermore, we identify additional targets of PAHSA action. PAHSA treatment enhances hepatic insulin sensitivity in aged chow- and HFD-fed mice and promotes glucose uptake into glycolytic muscle and heart in HFD-fed mice. To deter-mine the mechanisms by which PAHSAs enhance hepatic insulin sensitivity, we examined both direct effects in hepatocytes and the indirect effect resulting from the augmentation of insulin-mediated suppression of white adipose tissue (WAT) lipolysis. Increased WAT lipolysis promotes hepatic insulin resistance by increasing hepatic gluconeogenesis through a substrate push mechanism (5). To deter-mine whether lowering free fatty acid (FFA) levels is necessary for the effects of PAHSAs on insulin sensitivity, we infused Intralipid during the hyperinsulinemic-euglycemic clamp. PAHSAs still low-ered EGP in chow-fed mice infused with Intralipid, whereas in HFD-fed mice, preventing the PAHSA-induced reduction in FFAs diminished the effects of PAHSAs on hepatic insulin sensitivity. Furthermore, our mechanistic studies show that PAHSAs inhibit-ed EGP directly in isolatinhibit-ed hepatocytes. This appears to be minhibit-edi- medi-ated by a cAMP-dependent pathway involving Gαi protein–coupled
receptors. In summary, PAHSAs have direct and indirect effects on EGP, and these contribute to their systemic insulin-sensitizing effects. The indirect effects result from intertissue communication between adipose tissue and liver. Therefore, these data reveal what we think are new cellular and physiologic mechanisms underlying the beneficial effects of PAHSAs.
Results
Acute PAHSA treatment decreases glucose production in vivo through inhibition of cAMP signaling. A single oral dose of 5- and 9-PAHSAs,
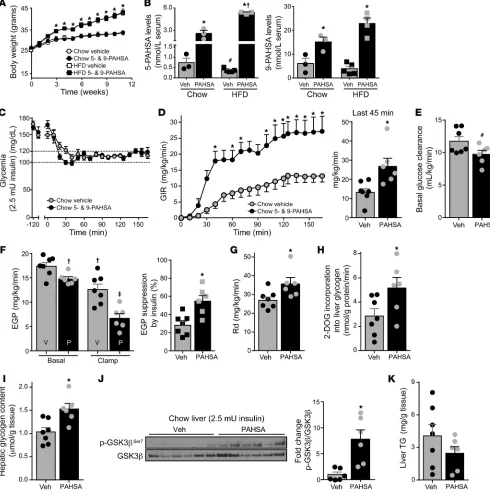
treated with PAHSAs (18). To determine which tissues contribute to the improved insulin sensitivity, we analyzed the tracer data to assess the discrete components of basal and insulin-stimulated glucose metabolism. In the basal state, in chow-fed mice treated with PAHSAs, basal glucose clearance tended to be lower (Figure 2E) and basal EGP was lower compared with that in vehicle-treat-ed mice (Figure 2F). In addition, insulin suppression of EGP was markedly greater in PAHSA-treated mice, indicating that PAHSA treatment enhances hepatic insulin sensitivity (Figure 2F).
Furthermore, the glucose disappearance rate (Rd) was 30% higher in PAHSA-treated compared with vehicle-treated chow-fed mice (Figure 2G). However, 2-[1-14C]-deoxy-d-glucose (2-DOG)
uptake into individual muscles and adipose depots was not dif-ferent between vehicle- and PAHSA-treated mice with a 2.5 mU/ effect of PAHSAs on hepatic gluconeogenesis is associated with
[image:4.585.41.534.57.430.2]an improvement in systemic insulin sensitivity, we performed hyperinsulinemic-euglycemic clamps (insulin infusion rate, 2.5 mU/kg/min) in chow-fed mice chronically treated with PAHSAs or vehicle. During the clamp period, blood glucose levels were maintained at approximately 120 mg/dL in both groups (Figure 2C). Insulinemia was increased to comparable levels (Supple-mental Figure 4A). Compared with vehicle-treated mice on a chow diet, PAHSA-treated mice needed a significantly higher glu-cose infusion rate (GIR) to maintain euglycemia, indicating that chronic PAHSA treatment improves insulin sensitivity (Figure 2D). These results reinforce our previous data showing improve-ments in glucose tolerance and insulin sensitivity, measured during glucose and insulin tolerance tests, in mice chronically
Figure 1. Acute PAHSA treatment decreases glucose production in vivo through inhibition of cAMP signaling. Five hours after food removal, [3-3H]
glucose (0.05 μCi/min) was infused through the jugular vein together with vehicle (Veh) (0.5% BSA, 3 μL/h) or 9-PAHSA (chow: 9 μg/h; HFD: 18 μg/h, pre-conjugated with 0.5% BSA) for 3 hours in 16-week-old mice on a chow or HFD for 11 weeks. Endogenous glucose production (EGP) (A), glycemia (B), glucose clearance (C), and insulin levels (D) at the end of infusion. n = 7–9/group. (E) Representative Western blots for total and phosphorylated CREB proteins in liver lysates from chow-fed mice at the end of infusion. n = 8–9/group. Bar graph represents fold change relative to vehicle. This Western blot is represen-tative of 4 Western blots using the same samples. (F) Hepatic glucose-6-phosphatase catalytic unit (G6pc1) and phosphoenolpyruvate carboxykinase 1 (Pck1) mRNA expression in chow- and HFD-fed mice at the end of the infusion. G6pc1 and Pck1 mRNA are expressed as a ratio to GAPDH, which was used as the housekeeping gene. Graphs represent fold change relative to vehicle. n = 8–10/group. (A–F) *P < 0.05 versus vehicle, #P = 0.08 versus chow vehicle, †P < 0.05 versus chow diet. (G) Hepatic glucose-6-phosphatase (G6pase) activity (V
max and Km) at the end of the infusion. n = 8–11/group. *P < 0.05 versus vehicle-treated mice on a chow diet, †P < 0.05 versus vehicle-treated HFD-fed mice. Statistical significance for all panels was evaluated by 2-way ANOVA,
Figure 2. Chronic PAHSA treatment increases systemic insulin sensitivity in chow-fed mice. (A) Body weight of C57BL/6 male mice treated with 5-PAHSA (0.1 mg/d) and 9-PAHSA (0.4 mg/d) delivered by subcutaneous osmotic minipumps. PAHSA treatment was started with the initiation of HFD feeding at 12 weeks of age. Chow: n = 10/group; HFD: n = 20/group. *P < 0.05 for both HFD groups versus both chow-fed mice. (B) Serum 5-PAHSA (left) and 9-PAHSA (right) levels at 2 months of PAHSA treatment. n = 3–5/group (each sample represents a pool of serum from 3–4 mice). *P < 0.05 versus vehicle-treated mice, #P = 0.08 versus vehicle-treated mice on a chow diet, †P < 0.05 versus PAHSA-treated mice on a chow diet. (C–G) Hyperinsulinemic-
euglycemic clamp studies were performed with a 2.5-mU/min/kg insulin infusion rate after 5-hour food removal in chow mice treated with PAHSAs or vehicle for 13 weeks: glycemia (C), Glucose infusion rate (GIR) and GIR at steady state (bar graph) (D), basal glucose clearance (E), EGP and percent sup-pression of EGP by insulin (F), and disappearance rate (Rd) (G). n = 6–7/group. (H–K) 2-[1-14C]-deoxy-d-glucose (2-DOG) incorporation into liver glycogen (H),
levels of liver glycogen (I), hepatic GSK3β signaling (representative of 3 Westerns blots using same samples) (J), and liver triglyceride (TG) levels (K) at the end of the clamp. n = 6–7/group. For C–K, *P < 0.05 versus vehicle-treated chow mice, #P = 0.06 versus vehicle, †P < 0.05 versus vehicle-treated chow mice
at baseline, ‡P < 0.05 versus all other groups. Statistical significance for A, C, and D was evaluated by 2-way repeated-measures ANOVA; for all others, 1- or
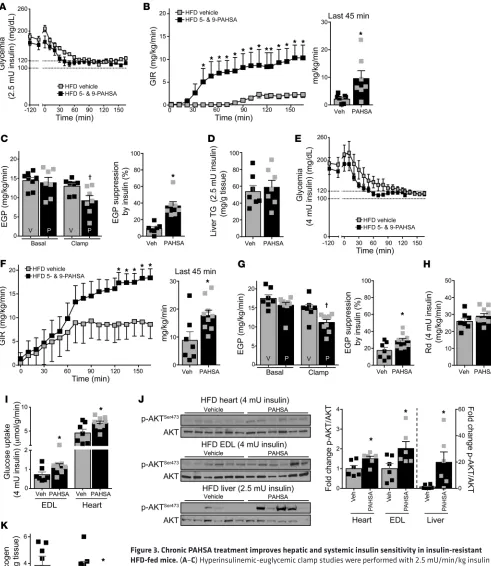
PAHSA-treated HFD mice required a significantly higher GIR to maintain euglycemia than vehicle-treated HFD mice also with this higher insulin infusion rate (Figure 3F). In addition, the PAHSA- treated mice showed greater suppression of EGP by insulin (Fig-ure 3G), even though this higher insulin infusion rate also sup-pressed EGP more in vehicle-treated mice than the lower infusion rate. Rd was not different between vehicle- and PAHSA-treated HFD-fed mice at the 4 mU/kg/min insulin infusion rate (Figure 3H). However, PAHSA treatment increased glucose uptake in the extensor digitorum longus (EDL) muscle and heart, although not into other muscles (anterior tibialis, soleus, or gastrocnemius) (Figure 3I and Supplemental Figure 6F). Chronic PAHSA treat-ment also increased Akt phosphorylation and the p-Akt/Akt ratio in heart, EDL, and liver at the end of the clamp in HFD-fed mice (Figure 3J). Phosphorylation of GSK3β was highly variable, and the p-GSK3β/GSK3β ratio was not different between vehicle and PAHSA treatments in any of the tissues analyzed (Supplemental Figure 7). Together, these data indicate that enhanced Akt signal-ing in heart, EDL, and liver may contribute to improved systemic insulin sensitivity in PAHSA-treated HFD-fed mice, although the impact of PAHSAs on specific signaling molecules differed from that in chow-fed mice (Figure 2J). Liver glycogen content was 4-fold higher in HFD-fed mice (Figure 3K) compared with chow-fed mice (Figure 2I), as previously reported (36). Interestingly, chronic PAHSA treatment markedly decreased liver glycogen con-tent in HFD-fed mice to levels similar to those in PAHSA-treated chow-fed mice. This was not observed with acute PAHSA infusion (data not shown).
PAHSAs suppress lipolysis, and this partially accounts for the effects on suppression of EGP. Dysregulation of WAT lipolysis can
lead to increased hepatic gluconeogenesis by two mechanisms: (i) release of glycerol provides the liver with an increased substrate for conversion to glucose through a substrate push mechanism; and (ii) increased acetyl-CoA delivery to the liver activates liver pyruvate carboxylase, which catalyzes an important early step in gluconeogenesis (5). Both processes result in hepatic insulin resis-tance (5). To determine whether PAHSAs could enhance hepatic insulin sensitivity through effects on lipolysis, we measured serum FFA levels. In chow-fed mice, FFA levels at the end of the clamp were lower in PAHSA-treated compared with vehicle-treated mice (Figure 4A). In HFD-fed mice, FFA concentrations were similar at the beginning of the clamp but lower at the end of the clamp in PAHSA-treated mice compared with vehicle-treated mice, indicat-ing that PAHSAs increase sensitivity to insulin suppression of plas-ma FFA concentrations (Figure 4A). This suggests that PAHSAs increase adipose tissue sensitivity to the antilipolytic effects of insulin and that this may contribute to the hepatic and systemic insulin-sensitizing effects of PAHSAs. To test whether PAHSAs have a direct effect on inhibition of lipolysis, we carried out exper-iments in murine adipose tissue explants. Treatment with the
β-adrenergic agonist isoproterenol increased lipolysis in adipose tissue explants, and 9-PAHSA inhibited isoproterenol-induced lipolysis with effects similar to those of insulin (Figure 4B). The direct effects of PAHSAs and insulin in WAT explants did not appear to be additive (Figure 4B and Supplemental Figure 8B). In addition, 9-PAHSA suppressed lipolysis in perigonadal WAT, but not in SQ WAT (Supplemental Figure 8B).
kg/min insulin infusion rate (Supplemental Figure 4B). Therefore, we investigated whether hepatic glucose uptake could contrib-ute to the difference in Rd (32). Hepatic glucose uptake cannot be precisely measured with the 2-DOG uptake technique owing to the presence of G6pase in the liver, which regulates both glu-cose uptake and output so that 2-DOG is not “trapped” in liver as it is in muscle and adipocytes. However, 2-DOG incorporation into glycogen in liver provides some indication of hepatic glucose uptake (33, 34). The rate of 2-DOG incorporation into glycogen in PAHSA-treated mice was increased 80% compared with that in vehicle-treated mice, suggesting an increase in hepatic glucose uptake (Figure 2H). Consistent with this, chronic PAHSA treatment increased liver glycogen content by 50% (Figure 2I), and there was a similar tendency with acute 9-PAHSA infusion in chow-fed mice (data not shown). To investigate the mechanisms underly-ing PAHSA-driven improvement of hepatic insulin sensitivity, we measured the effects of PAHSAs on hepatic insulin signaling at the end of the clamp. PAHSA treatment increased the phosphorylation and the total amount of Akt in liver of chow-fed mice. Although the p-Akt/Akt ratio was unchanged (Supplemental Figure 5), there was effectively more p-Akt with PAHSA treatment. This is reflect-ed in increasreflect-ed phosphorylation of the AKT target protein glycogen synthase kinase 3β (GSK3β) in PAHSA-treated chow mice (Figure 2J). These data suggest that enhanced hepatic insulin signaling in PAHSA-treated chow mice could contribute to increased hepat-ic glycogen content and hepathepat-ic insulin sensitivity. Inhibition of hepatic glucose production can divert carbons toward lipid synthe-sis, leading to triglyceride (TG) accumulation in the liver and ulti-mately hepatic steatosis. However, chronic PAHSA treatment did not change liver TG levels in chow-fed mice (Figure 2K).
Chronic PAHSA treatment improves hepatic and systemic insulin sensitivity in insulin-resistant HFD-fed mice. To determine whether
PAHSA treatment improves hepatic insulin resistance in HFD-fed mice, we initially used an insulin infusion rate of 2.5 mU/kg/min. Euglycemia was maintained during the clamp in both the vehicle- and PAHSA-treated groups (Figure 3A), along with comparable increases in insulinemia in the groups (Supplemental Figure 6A). Chronic PAHSA treatment resulted in a marked improvement of whole-body insulin sensitivity, indicated by a 4.5-fold increase in GIR (Figure 3B). Chronic PAHSA treatment did not affect basal EGP in HFD-fed mice (Figure 3C). However, in vehicle-treated HFD-fed mice, insulin at this infusion rate did not suppress EGP, whereas PAHSA treatment resulted in a 37% suppression of EGP, indicating that PAHSAs improve hepatic insulin sensitivity (Figure 3C). Rd, 2-DOG uptake in muscle and fat depots, and liver 2-DOG incorporation into glycogen were not different between the HFD groups at this insulin infusion rate (Supplemental Figure 6, B–D). Liver TG levels were not changed after chronic PAHSA treatment in HFD-fed mice (Figure 3D).
Figure 3. Chronic PAHSA treatment improves hepatic and systemic insulin sensitivity in insulin-resistant HFD-fed mice. (A–C) Hyperinsulinemic-euglycemic clamp studies were performed with 2.5 mU/min/kg insulin infusion rate after 5-hour food removal in HFD-fed mice treated with 5- and 9-PAHSAs or vehicle for 13 weeks. Glycemia (A), GIR and GIR at steady state (bar graph) (B), and EGP and percent suppression by insulin of EGP (C).
n = 7/group. (D) Liver TG levels at the end of the 2.5 mU clamp. n = 7/group. (E–H) Hyperinsulinemic-euglycemic clamp studies were performed with a 4-mU/min/kg insulin infusion rate after 5-hour food removal in HFD-fed mice treated with 5- and 9-PAHSAs or vehicle for 13 weeks. Glycemia (E), GIR and GIR at steady state (F), EGP and percent suppression by insulin of EGP (G), and Rd (H). n = 7–9/group. (I) In vivo tissue 2-DOG uptake at the end of the 4-mU clamp. n = 7–9/group. (J) Akt signaling in heart, extensor digitorum longus muscle (EDL), and liver. n = 6/group. (K) Hepatic glycogen content at the end of the 2.5-mU and 4-mU clamps. n = 7–8/group. *P < 0.05 versus vehicle-treated HFD-fed mice, †P < 0.05 versus all other groups. Statistical significance for A, B, E,
To determine whether PAHSAs’ effects on lipolysis are required for their suppression of EGP, we performed hyperinsulinemic-eugly-cemic clamps with concurrent Intralipid infusion to prevent the sup-pression of FFAs and glycerol in chronic vehicle- or PAHSA-treated mice. Plasma FFAs were elevated approximately 2- to 3-fold during Intralipid infusion (Supplemental Figure 9, A and B) in both chow- and HFD-fed mice. As expected, Intralipid infusion for 2 hours did not alter GIR in vehicle-treated mice on a chow diet (6), but tended to prevent the increase in GIR in PAHSA-treated mice (Figure 4C), although it did not affect the suppression of EGP driven by PAHSAs in mice on a chow diet (Figure 4D). PAHSA-treated mice receiving Intralipid showed higher insulinemia at the end of clamp (Supple-mental Figure 9C), although no differences in the fold increase over basal insulinemia were found among the experimental groups (Sup-plemental Figure 9D). Conceivably, the insulin levels were higher at the end of clamp in PAHSA-treated mice receiving Intralipid because these animals had higher starting insulinemia (Supplemental Figure 9C). However, this was not due to differences in endogenous insulin secretion, since C-peptide levels are comparable among the experi-mental groups both before and at the end of the clamp (Figure 4E). On the other hand, in mice on an HFD, in which serum insulin levels were unchanged between treatments (Figure 4G), Intralipid infu-sion prevented the insulin-sensitizing effect of PAHSAs on GIR and EGP (Figure 3, F and G, and Figure 4, F and H). This suggests that the antilipolytic effect of PAHSAs is responsible for the improvement of hepatic insulin sensitivity in HFD-fed mice.
PAHSAs directly inhibit basal and glucagon-stimulated EGP through a cAMP-dependent pathway involving Gαi
protein–cou-pled receptors. Since Intralipid infusion fails to block the effects
of PAHSAs on EGP in chow-fed mice, we investigated whether PAHSAs have a direct effect on EGP in isolated hepatocytes. A 3-hour treatment with 5- and 9-PAHSA inhibited basal EGP by 34% and 49%, respectively, in primary hepatocytes (Supplemen-tal Figure 10 and Figure 5A), and this effect was not additive with insulin at maximal or submaximal concentrations (Figure 5A). Furthermore, 9-PAHSA decreased glucagon-stimulated EGP dose dependently in primary hepatocytes (Figure 5B). Consistent with the data demonstrating that an acute PAHSA infusion attenuated PKA signaling in vivo (Figure 1, E–G), we found that 30 minutes of 9-PAHSA incubation reduced glucagon-stimulated cAMP levels by approximately 39% in isolated hepatocytes (Figure 5C). Fur-thermore, 9-PAHSA did not alter 8-bromo-cAMP–stimulated EGP (Figure 5D), indicating that 9-PAHSA acts upstream of PKA.
Our previous studies have demonstrated that some of the bio-logical functions of PAHSAs are mediated through G protein–cou-pled receptors (GPCRs) (13, 18). Here we show that the effects of 9-PAHSAs on basal and glucagon-stimulated EGP were abolished by pertussis toxin (PTX) (Figure 5E), which inactivates Gi-type GPCRs. Together, these data indicate that the effects of PAHSAs on EGP appear to be mediated by a cAMP-dependent pathway involving Gαi protein–coupled receptors (Figure 5F).
Consis-tent with this, PAHSA-mediated inhibition of lipolysis in adipose explants was also blocked by PTX (data not shown).
Discussion
EGP regulation is a fundamental component of glucose homeo-stasis, and impaired insulin-mediated suppression of EGP plays a
major role in the pathogenesis of T2D and its complications (37). In this article, we show that PAHSA treatment markedly increases insulin action to suppress EGP in aged chow- and HFD-fed mice. In addition, in HFD-fed mice, chronic PAHSA treatment improves insulin-stimulated glucose uptake in glycolytic muscle and heart. We found that the mechanisms by which PAHSAs enhance hepat-ic insulin sensitivity involve direct and indirect effects, includ-ing intertissue communication between adipose tissue and liver. Suppression of lipolysis appears to be a key mechanism for the insulin-sensitizing effects of PAHSAs in HFD-fed mice. Our data suggest that PAHSAs might reduce the delivery of gluconeogen-ic substrates to the liver by inhibiting WAT lipolysis in HFD-fed mice, resulting in reduced EGP. In contrast to our previous chron-ic PAHSA treatment studies (18), in the current study we used a disease prevention design in which we started PAHSA treatment and HFD simultaneously. Thus, this study shows that PAHSAs can prevent the development of insulin resistance with aging in chow- and HFD-fed mice. Hence, these bioactive lipids might be devel-oped into novel therapeutic agents for T2D prevention.
The relative importance of the direct and indirect mechanisms for EGP regulation by insulin is still under investigation (4–7). The direct effect of insulin has been shown to be sufficient to suppress EGP in experimental conditions mimicking the postprandial rise in hepatic insulinemia (4). This effect results from increased insulin signaling, which increases glycogen synthesis and reduces hepatic glucose output. In our study, we found increased insulin signaling in the liver of PAHSA-treated mice. This could be secondary to the increased insulin sensitivity resulting from chronic PAHSA treat-ment, because we have not observed any change in insulin signal-ing in PAHSA-treated mice in response to acute insulin injection in vivo or in PAHSA-treated isolated hepatocytes in response to short-term incubation with insulin. With prolonged incubation of HepG2 cells with 5-PAHSA, insulin signaling was increased (27), consis-tent with our data with chronic PAHSA treatment. But under differ-ent conditions, other mechanisms including the indirect pathway (i.e.,suppression of lipolysis) play a major role (5). Several groups have demonstrated the importance of the indirect effects of insu-lin in suppressing EGP using genetic models of ablation of hepatic insulin signaling (i.e., liver Akt1-, Akt2-, and Foxo1-KO mice) and also HFD-induced insulin resistance (5, 6, 38).
demonstrat-Figure 4. PAHSAs suppress lipolysis, and this partially accounts for the effects of PAHSAs to suppress EGP. (A) Free fatty acid (FFA) levels at baseline and at the end of the clamp. Insulin dose: chow, 2.5 mU/kg/min (Figure 2, C–G); HFD, 4 mU/kg/min (Figure 3, E–H). n = 6–9/group. *P < 0.05 versus all other groups within the same diet. (B) FFA release from perigonadal WAT explants. n = 10–29/group. *P < 0.05 versus untreated control cells, †P < 0.05
versus isoproterenol-treated cells. (C–H) Hyperinsulinemic-euglycemic clamps were performed with infusion of Intralipid (5 mL/kg/h)/heparin (6 U/hour) or heparin (6 U/hour) alone. GIR and GIR at steady state (bar graph) (C), EGP and percent suppression of EGP by insulin (D), and C-peptide levels (E) during clamps (2.5 mU/min/kg insulin infusion rate) in vehicle- and PAHSA-treated (29 weeks) chow-fed mice. n = 6–8/group. For C–E, *P < 0.05 versus vehicle and vehicle + Intralipid, #P = 0.09 versus PAHSA group, †P < 0.05 versus all other groups except PAHSA + Intralipid, ‡P < 0.05 versus basal. GIR and GIR at
[image:9.585.43.538.58.594.2]Endogenous insulin secretion also contributes to suppres-sion of EGP (4), but that is not the explanation for the effects of PAHSAs, because we found no differences in insulin and/or C-pep-tide levels between PAHSA- and vehicle-treated mice on either a chow or HFD in several experimental paradigms. During acute i.v. PAHSA infusion, we did not use any stimulus to increase ambient glucose levels, and we actually observed a modest decrease in gly-cemia over 3 hours (data not shown). We previously reported that PAHSAs augmented oral glucose–stimulated insulin secretion in aged chow-fed mice (18). But in this study, we increased glyce-mia with i.p. pyruvate injection. The i.p. injection would bypass first-phase insulin secretion (50), which most likely explains why we did not see augmentation by PAHSAs of insulin secretion in aged chow-fed mice. We have not previously observed an effect of PAHSAs on insulin secretion in HFD-fed mice (13, 18).
In summary, we have identified target organs and biological mechanisms for the beneficial effects of PAHSAs on insulin sen-sitivity. Taken together, our data show that PAHSAs have multi-ple metabolic effects. This could be explained by the fact that PAHSAs activate multiple GPCRs that are present in different cell types and tissues and that exert different biologic effects in these tissues. Overall, it appears that in aged chow-fed mice, the effects of PAHSAs on GLP-1 and insulin secretion, combined with augmentation of insulin action to suppress EGP, are important for the improvement in glucose homeostasis. In HFD-fed mice, the in vivo mechanisms for improved glucose homeostasis appear to result more from PAHSAs’ augmentation of insulin suppres-sion of EGP, which results at least in part from their suppressuppres-sion of lipolysis. The PAHSA-mediated increase in insulin-stimulated glucose uptake in glycolytic muscle may also play a role in the ben-eficial effects in HFD-fed mice. Our data also show that in isolated hepatocytes, PAHSAs not only inhibit basal EGP directly, but also suppress glucagon-stimulated EGP through a cAMP-dependent pathway involving Gαi protein–coupled receptors.
Some effects of PAHSAs may be translatable from mice to humans, since the same PAHSA isomers are found in both spe-cies, and levels of many of these isomers are reduced in serum and subcutaneous adipose tissue in both insulin-resistant humans and mice (13). For insulin secretion, PAHSAs augment it in chow-fed but not HFD-fed mice. But PAHSAs directly improve glucose- stimulated insulin secretion (GSIS) in human islets from both nor-mal and T2D individuals, and restore the impaired pulsatility of insulin secretion in islets from T2D individuals (21). Determining the translatability of the findings in this study awaits development of PAHSAs suitable for administration to humans. Understanding the range of biological functions of PAHSAs and the underlying mechanisms will provide clarity regarding their roles in healthy and disease states.
Methods
Animal care. All C57BL/6J male mice were purchased from the Jackson Laboratory and were singly housed in ventilated cages with ad libitum access to food and water. Mice were kept on a 12-hour light/12-hour dark schedule at 22–23°C. Before handling, mice were allowed to acclimate for at least 1 week in the animal facility. For PAHSA i.v. infu-sion studies, 16-week-old mice were fed a chow or HFD for 8 weeks, after which insulin resistance was confirmed by an ITT. For PAHSA ed previously by the failure of Intralipid infusion to prevent insulin
suppression of EGP in chow-fed mice (6). These data are consistent with the notion that FFAs play a greater role in regulating EGP as the severity of insulin resistance increases (6, 39). Several studies demonstrated a clear association between increased nonesterified fatty acid levels and hyperglycemia in T2D subjects (40–42), but whether this plays a causative role is not known.
Our data indicate that PAHSAs also have direct effects on hepatocytes through a cAMP-dependent pathway. PAHSAs reduce basal and glucagon-stimulated glucose output in a cell-autono-mous manner. The effect on glucagon-stimulated EGP may involve a reduction in glucagon-stimulated cAMP generation in primary hepatocytes. In contrast, PAHSAs have no effects on 8-bromo- cAMP–stimulated EGP, suggesting that PAHSAs decrease EGP by acting upstream of PKA. This concept is supported by our in vivo findings that PAHSA infusion decreases phosphorylation of CREB, a key cAMP-responsive PKA substrate, and the expression of CREB target genes Pck1 and G6pc1 (43) in the liver. PAHSAs also reduce the activity of G6pase, the rate-controlling glucose output enzyme, which is sensitive to cAMP (29). These data demonstrate that the direct effect of PAHSAs to suppress EGP requires inhibi-tion of cAMP signaling, resulting in decreased G6pase activity.
We next sought to understand the signaling upstream of PAHSAs’ direct effects on hepatocytes. We have previously shown that GPCRs of the Gαq subtype mediate other biological
functions of PAHSAs (13, 18, 20). In the current study, PTX, a Gαi
inhibitor, abolished the effects of PAHSAs on EGP, indicating that activation of a Gαi protein–coupled receptor is required for
EGP suppression in response to PAHSAs.
We sought to determine whether PAHSAs also promote insulin-stimulated glucose uptake into muscle in vivo. We found increased glucose uptake, which could be explained by enhanced AKT signaling, in glycolytic (type II) fibers and heart in PAHSA- treated HFD-fed mice using a 4-mU insulin clamp dose. A higher insulin infusion rate is often required in order to achieve an effect on muscle glucose uptake compared with EGP due to the fact that EGP and lipolysis are more sensitive to insulin (35, 44). The increased glucose uptake in glycolytic muscle in PAHSA-treated mice could contribute to the enhanced systemic insulin sensitivity, because glycolytic fibers are more abundant than oxidative fibers in mice (45). Moreover, an increase in glycolytic muscle mass can result in metabolic improvement in obese mice (46). In contrast, glycolytic muscle fiber mass positively correlates with insulin resis-tance and obesity in humans (47, 48), but whether this contributes to, or is a response to, the insulin-resistant state is not known.
tion surgery, mice were anesthetized with an i.p. injection of ketamine (100 mg/kg body weight) and xylazine (10 mg/kg body weight), and an indwelling catheter was inserted in the right internal jugular vein. The catheters were externalized through an incision in the skin flap behind the head. No heparin was added in the catheters, except in the treatment studies, minipumps (Alzet, model 2006) filled with either
vehicle (50% polyethylene glycol 400 [PEG 400], 0.5% Tween-80, 49.5% distilled water) or 5- (0.1 mg/d) and 9-PAHSA (0.4 mg/d) were inserted subcutaneously into 12-week-old mice, coinciding with the initiation of chow or HFD for up to 29 weeks. For catheter
implanta-Figure 5. PAHSAs directly inhibit basal and glucagon-stimulated EGP in isolated hepatocytes through a cAMP-dependent pathway involving Gαi protein–coupled receptors. Hepatic glucose production (HGP) in murine primary hepatocytes treated with DMSO (0.2%; white bars), 9-PAHSA, and/or insulin (A). n = 4 wells/condition. HGP in hepatocytes treated with DMSO (0.2%), glucagon, and 9-PAHSA + glucagon (B). n = 4–8 wells/condition. (C) cAMP levels were measured 30 minutes after glucagon or 9-PAHSA + glucagon treatment. n = 12–18 wells/condition. (D) HGP in primary hepatocytes treated with DMSO (0.2%) (white bar), 8-bromo-cAMP (8-Bro-cAMP), or 9-PAHSA + 8-bromo-cAMP. n = 5–9. (E) HGP in primary hepatocytes treated with DMSO (0.2%) (white bars), insulin, 9-PAHSA, pertussis toxin (PTX), or 9-PAHSA + PTX (left); HGP in primary hepatocytes treated with DMSO (0.2%), glucagon, 9-PAHSA, PTX, or glucagon + 9-PAHSA + PTX (right). n = 7–14 wells/condition. For A–E, glucose output was measured 3 hours after treatment. *P < 0.05 versus vehi-cle-treated control cells (first bar), §P < 0.05 versus vehicle- (fifth bar) or insulin-treated cells, ‡P < 0.05 versus glucagon, †P < 0.05 versus 9-PAHSA alone,
and ##P < 0.05 versus 9-PAHSA + glucagon. Statistical significance for all panels was evaluated by ANOVA followed by Tukey’s post hoc tests or unpaired
μCi/min; t = 0 to 165 minutes, 0.1 μCi/min. The clamp was initiated at t = 0 minutes with a continuous insulin infusion (2.5 mU/kg/min or 4 mU/kg/min). In the case of the 2.5-mU infusion rate, at t = 0 a bolus of insulin (16 mU/kg body weight) was given i.v. Glycemia was monitored every 10 minutes, and a variable amount of 30% glucose was administered to maintain euglycemia. EGP was determined from blood samples collected at –10 minutes and every 10 minutes from 125 to 165 minutes. Basal and insulin-stimulated EGP were determined by the [3-3H]glucose dilution method. 2-DOG (10 μCi) was administered
at 120 minutes to determine tissue-specific glucose uptake. For Intra-lipid infusion studies, prior to the initiation of the insulin portion of the clamp, a 100-μL bolus of 10% Intralipid/heparin (3 U) was adminis-tered i.v. During the insulin clamp, Intralipid was infused at 5 mL/kg/h and heparin at 6 U/h. At the end of the clamp, mice were sacrificed by ketamine injection. Liver samples were freeze clamped, and other tis-sues were removed following each experiment, snap frozen in liquid nitrogen, and stored at –80°C for future experiments. Raw data for GIR and glycemia during the last 40 minutes (steady state) of Intralipid infusion are shown in Supplemental Table 1.
In vivo tissue glucose uptake and 2-DOG incorporation into liver gly-cogen. For 2.5-mU clamp studies, tissue samples were weighed and homogenized, and the supernatants were subjected to ion exchange column to separate 2-[14C]DOG-6-phosphate (2-DOGP) from 2-DOG.
For the 4-mU clamp study, samples were weighed and homogenized in 0.5% perchloric acid. Homogenates were centrifuged and neutral-ized with KOH. One aliquot was counted directly to determine 2-DOG and 2-DOGP radioactivity. A second aliquot was treated with Ba(OH)2 and ZnSO4 to remove 2-DOGP and then counted to determine 2-DOG. 2-DOG was calculated as the difference between the radioactivity of these 2 aliquots. In all experiments, the accumulation of 2-DOG was normalized to tissue weight.
2-DOG incorporation into glycogen was measured as previous-ly described (33). In brief, liver samples (50–75 mg) were pulverized with mortar and pestle in liquid nitrogen, and digested by KOH. Once samples were dissolved, protein content was determined by the BCA assay. Glycogen was precipitated with 66% ethanol overnight. Gly-cogen concentration was determined by amyloglucosidase enzyme assays and corrected for sample protein content. To determine 2-DOG incorporation into liver glycogen, 14C radioactivity in glycogen counts
was divided by the integrated glucose-specific activity area under the curve and corrected for sample protein content.
Ex vivo lipolysis in adipose tissue explants. Lipolysis in adipose tissue explants was performed as previously described (19). In brief, perigo-nadal WAT was harvested from 20- to 33-week-old male chow-fed mice from the Jackson Laboratory and minced into 20- to 30-mg pieces. Explants were incubated in Krebs-Ringer-HEPES buffer (20 mM HEPES pH 7.4, 120 mM NaCl, 1.2 mM CaCl2, 4.8 mM KCl, 0.6 mM MgSO4, 1.2 mM KH2PO4) with 3% BSA, 200 nM adenosine, and 5 mM glucose with or without isoproterenol. The magnitude of the antilipolytic effect of 9-PAHSA was similar in the presence or absence of adenosine in the incubation media (Supplemental Figure 8). Insulin or 9-PAHSA was added 30 minutes before isoproterenol. Media were collected 2 hours after isoproterenol treatment, and FFA levels were determined using a colorimetric method according to the manufacturer’s instructions (Wako NEFA kits). FFA levels were normalized to tissue weight.
PAHSA extraction and measurement. Lipid extraction was per-formed as previously described (13). Lipids were extracted from mouse Intralipid infusion studies. After surgery, mice were kept on ad libitum
chow or HFD for an additional 4 days. Body weight was monitored and catheters were flushed with 0.9% saline every day. For Intralipid infusion studies, catheters were flushed with 50 μL heparinized saline every day before the clamp study. All mice used for the studies lost less than 10% of initial body weight. Glycemia was measured by tail bleeding using a glucometer (OneTouch). For all experiments, age- and body weight–matched animals were used.
Materials and chemical reagents. All chemical reagents were pur-chased from Sigma-Aldrich unless otherwise stated. p-CREB (cata-log 9196), CREB (cata(cata-log 9197), p-AKT (cata(cata-log 4058), AKT (cata(cata-log 9272), p-GSK3β (catalog 5558), GSK3β (catalog 12456) and β-actin (catalog 3700) antibodies were purchased from Cell Signaling Tech-nology. d-[3-3H]-glucose and 2-DOG were purchased from
Perkin-Elmer. INTRALIPID 20% IV Fat Emulsion was purchased from Bax-ter. Heparin Sodium Injection was purchased from Pfizer Injectables. NEFA kits were obtained from Wako. Glucagon kits (Bio-Plex Pro Dia-betes Assays) was obtained from Bio-Rad. ELISA kits were obtained from Crystal Chem (Mouse Insulin and C-Peptide), Abcam (Glycogen Assay Kit), and Cayman Chemical (Cyclic AMP ELISA Kit). Organic solvents for liquid chromatography–mass spectrometry (LC-MS) were purchased from Honeywell Burdick & Jackson. Both 5- and 9-PAHSA were synthesized by Dionicio Siegel (Skaggs School of Pharmacy and Pharmaceutical Sciences, UCSD) based on established methods (51).
Measurement of metabolic parameters. For single PAHSA oral gavage studies, 17.5 hours after food removal (0.5 hours before ini-tiation of the PTT) male mice were gavaged with 30 mg/kg body weight (chow-fed) 5- and 9-PAHSA in combination (50% each) or an equivalent volume of vehicle (50% PEG 400, 0.5% Tween-80, 49.5% distilled water). Mice received pyruvate (2 g/kg body weight) by i.p. injection 30 minutes after PAHSA or vehicle administration. For PTT, glycemia was monitored every 15 minutes, mice were bled from the tail vein using non-heparin-coated capillary tubes, and serum insulin was measured by ELISA. For chronic PAHSA treatment studies, body weight and food intake were measured weekly, and body composi-tion was measured by MRI. For glucagon measurement, mice were treated with vehicle or 5- and 9-PAHSAs for 5 weeks by subcutane-ous minipumps. Five hours after food removal, serum was collected in tubes containing aprotinin (25 Kallikrein inhibitor units [KIU]/
μL). Serum glucagon was then measured following the manufactur-er’s protocol. For pyruvate and lactate tolerance tests, 18-hour-fasted mice were injected with pyruvate and lactate (1:10, 2 g/kg body weight), and glycemia was monitored over a 2-hour period. For acute PAHSA infusion, after 5-hour food removal, 3-3H glucose (0.05 μCi/
min) was infused through the jugular vein together with vehicle (0.5% BSA and DMSO) or PAHSA (chow: 9 μg/hour; HFD: 18 μg/hour, pre-conjugated with 0.5% BSA) at rate of 3 μL/min for 3 hours. EGP was determined from the average for the time points over the last 45 min-utes. The basal glucose clearance rate was calculated as the glucose disposal rate divided by the plasma glucose concentration, as previ-ous described (52). For protein and RNA quantification, liver samples were freeze clamped, and other tissues were harvested and snap fro-zen in liquid nitrogen.
Hyperinsulinemic-euglycemic clamps. Hyperinsulemic-euglycemic clamps were performed in conscious and unrestrained 5-hour-fasted male mice, as previously described (35). In brief, [3-3H]glucose was
um fluoride) containing a protease inhibitor cocktail. The lysates were sonicated and centrifuged at maximum speed for 15 minutes. Protein concentrations were determined using the BCA assay, and 60 μg protein was used for Western blotting. Protein extracts were resolved on SDS-PAGE gel and transferred to nitrocellulose membranes (Bio-Rad). Pro-teins of interest were detected by incubation with secondary antibodies, followed by ECL detection reagent. Film images were scanned (Epson Expression 10000 XL) and quantified with ImageJ software (NIH).
Gene expression. mRNA was extracted using TRIzol reagent (Invi-trogen) and an RNeasy Mini kit (QIAGEN). cDNA was obtained using the Advantage RT-for-PCR kit (Clontech). Real-time PCRs for G6pc1 and Pck1 were performed on an ABI Prism 7900HT sequence detec-tion system (Applied Biosystems) with TaqMan Universal PCR Master Mix and TaqMan gene expression assays (Applied Biosystems). Rela-tive expression levels were determined using the ΔΔCt method. Target gene expression levels were normalized to GAPDH.
Statistics. All data are shown as mean ± SEM. Statistical significance was determined by 2-tailed Student’s t test and/or 1- or 2-way ANOVA with Tukey’s post hoc test for multiple comparisons. Significance was determined by repeated-measures ANOVA when required by the exper-imental design. Statistical analysis was performed with Prism 6.0 soft-ware (GraphPad Softsoft-ware). No data were excluded from the analyses. A P value less than 0.05 was considered statistically significant.
Study approval. The present studies in animals were reviewed and approved by the Institutional Animal Care and Use Committee at Beth Israel Deaconess Medical Center.
Author contributions
PZ, A. Santoro, and ODP conceived of, designed, performed, and interpreted experiments and prepared figures. BBK conceived of, designed, and supervised the experimental plan and interpreted experiments. ATN, DS, and A. Saghatelian designed and per-formed chemical synthesis of the lipids. BBK, PZ, and A. Santoro wrote the manuscript. A. Saghatelian, DS, and ODP edited the manuscript. PZ initiated the project, and A. Santoro joined with critical skills and insights.
Acknowledgments
We thank Ismail Syed for technical assistance. This work was sup-ported by NIH grants R01 DK43051 and P30 DK57521 (BBK) and R01 DK106210 (BBK and A. Saghatelian); a grant from the JPB Foundation (BBK); an American Heart Association (AHA) Post-doctoral Fellowship and American Diabetes Association grant 1-18-PDF-134 (PZ); and NIH grant F30 DK112622 (ATN).
Address correspondence to: Barbara B. Kahn, Division of Endocri-nology, Diabetes and Metabolism, Department of Medicine, Beth Israel Deaconess Medical Center and Harvard Medical School, Center for Life Sciences, Room 747, 330 Brookline Ave, Boston, Massachusetts 02215, USA. Phone: 617.735.3324; Email: bkahn@ bidmc.harvard.edu.
serum (100 μL, pooled from 3–4 mice). PBS was added to serum such that the final volume was 1 mL. Subsequently, methanol and chloro-form were added to this mixture (PBS/methanol/chlorochloro-form ratio was 1:1:2). The resulting mixture was shaken for 30 seconds by hand, vor-texed for 15 seconds, and then centrifuged to separate the organic and aqueous phases. The organic phase containing lipids was then subject-ed to solid-phase extraction (13, 53).
G6pase activity assay. G6pase activity assay was performed as pre-viously described (54). In brief, 100 mg liver was lysed in buffer (5 mM HEPES; 250 mM sucrose) using a Dounce homogenizer. Microsomes were prepared using ultracentrifugation at 100,000 g and incubated for 20 minutes at 30°C with the substrate mix (G6P; sodium cacodylate; histone type IIA). The reaction was stopped with 4.5 mM ammonium molybdate solution in 4% SDS. Absorbance was measured at 820 nm.
Murine primary hepatocyte isolation and in vitro hepatic glucose production. Hepatocytes were isolated as previously described (55). Briefly, primary hepatocytes were isolated from 8- to 12-week-old male C57BL/6 mice from the Jackson Laboratory by perfusion with liver digest medium (Thermo Fisher Scientific), followed by 100-μm cell strainer filtration. Viable hepatocytes were enriched by Percoll gradient centrifugation. The hepatocytes were resuspended in Wil-liams’ E Medium (Thermo Fisher Scientific) containing 10% FBS and seeded on collagen-coated plates at a density of 0.25 × 10⁶ cells/well
(12-well plate). Four hours after attachment, cells were washed 3 times with phenol red–free DMEM with no glucose. Then, 300 μL glucose production buffer (consisting of glucose-free DMEM pH 7.4 without phenol red, 20 mM sodium lactate, and 2 mM sodium pyruvate) con-taining PAHSAs, insulin, or glucagon was added to the cells. In all experiments, DMSO was used as vehicle at 0.2%. Three hours later, media were collected, and glucose production was determined by the glucose assay kit and normalized to cellular protein concentrations. Before treatment, 9-PAHSA was maintained at 45°C and not mixed with glucagon or insulin. For glucagon treatment, cells were pretreat-ed with 9-PAHSA for 30 minutes, and then glucagon was addpretreat-ed in. Each experiment was repeated at least 3 times in 4–6 replicates.
Measurement of cellular cAMP levels. Thirty minutes after 9-PAHSA treatment, primary hepatocytes were incubated with glucagon for 30 minutes and immediately lysed with 110 μL of 0.1 M HCl. For mea-surement of cAMP levels, 250 μM IBMX was included in all samples to inhibit cAMP hydrolysis. cAMP levels were then measured using a cAMP ELISA kit (Cayman Chemical) following the manufacturer’s protocol for cell culture samples without acetylation.
Liver TG measurement. Liver TGs were extracted using the Folch method (56). A portion of the TG-containing chloroform phase was collected, evaporated, and resuspended in a 2:1 mixture of butanol and Triton X-100/methanol (3:1). TGs were then measured using a TG kit purchased from Stanbio according to the manufacturer’s protocol and normalized to liver weight.
Western blotting. Cells and tissues were lysed with lysis buffer (50 mM HEPES, pH 7.5, 150 mM NaCl, 10% glycerol, 1% Triton X-100, 1.5 mM MgCl2, 1 mM EGTA, 10 mM sodium pyrophosphate, 100 mM
1. Cho NH, et al. IDF Diabetes Atlas: global estimates of diabetes prevalence for 2017 and projections for 2045. Diabetes Res Clin Pract. 2018;138:271–281. 2. Wasserman DH. Four grams of glucose. Am J
Physiol Endocrinol Metab. 2009;296(1):E11–E21.
3. Exton JH, Park CR. Control of gluconeogenesis in liver. II. Effects of glucagon, catecholamines, and adenosine 3’,5’-monophosphate on gluco-neogenesis in the perfused rat liver. J Biol Chem. 1968;243(16):4189–4196.
4. Edgerton DS, et al. Insulin’s direct hepatic effect explains the inhibition of glucose pro-duction caused by insulin secretion. JCI Insight. 2017;2(6):e91863.
tissue inflammation to hepatic insulin resistance and type 2 diabetes. Cell. 2015;160(4):745–758. 6. Titchenell PM, et al. Direct hepatocyte insulin
signaling is required for lipogenesis but is dis-pensable for the suppression of glucose produc-tion. Cell Metab. 2016;23(6):1154–1166. 7. Matsumoto M, Pocai A, Rossetti L, Depinho
RA, Accili D. Impaired regulation of hepatic glucose production in mice lacking the forkhead transcription factor Foxo1 in liver. Cell Metab. 2007;6(3):208–216.
8. Cariou B, Charbonnel B, Staels B. Thiazolidinedi-ones and PPARγ agonists: time for a reassessment.
Trends Endocrinol Metab. 2012;23(5):205–215.
9. Chen Y, et al. Discovery of novel insulin sensitiz-ers: promising approaches and targets. PPAR Res. 2017;2017:8360919.
10. Orgel E, Mittelman SD. The links between insulin resistance, diabetes, and cancer. Curr Diab Rep. 2013;13(2):213–222.
11. Ginsberg HN. Insulin resistance and cardiovascu-lar disease. J Clin Invest. 2000;106(4):453–458. 12. Biessels GJ, Despa F. Cognitive decline and
dementia in diabetes mellitus: mechanisms and clinical implications. Nat Rev Endocrinol. 2018;14(10):591–604.
13. Yore MM, et al. Discovery of a class of endogenous mammalian lipids with anti-diabetic and anti- inflammatory effects. Cell. 2014;159(2):318–332. 14. Kuda O, et al. Docosahexaenoic acid-derived
fatty acid esters of hydroxy fatty acids (FAHFAs) with anti-inflammatory properties. Diabetes. 2016;65(9):2580–2590.
15. Zhu QF, Yan JW, Zhang TY, Xiao HM, Feng YQ. Comprehensive screening and identification of fatty acid esters of hydroxy fatty acids in plant tis-sues by chemical isotope labeling-assisted liquid chromatography-mass spectrometry. Anal Chem. 2018;90(16):10056–10063.
16. Ma Y, Kind T, Vaniya A, Gennity I, Fahrmann JF, Fiehn O. An in silico MS/MS library for automatic annotation of novel FAHFA lipids. J Cheminform. 2015;7:53.
17. Brezinova M, et al. Levels of palmitic acid ester of hydroxystearic acid (PAHSA) are reduced in the breast milk of obese mothers. Biochim Biophys
Acta Mol Cell Biol Lipids. 2018;1863(2):126–131.
18. Syed I, et al. Palmitic acid hydroxystearic acids activate GPR40, which is involved in their bene-ficial effects on glucose homeostasis. Cell Metab. 2018;27(2):419–427.e4.
19. Vijayakumar A, et al. Absence of carbohydrate response element binding protein in adipocytes causes systemic insulin resistance and impairs glucose transport. Cell Rep. 2017;21(4):1021–1035. 20. Lee J, et al. Branched fatty acid esters of hydroxy
fatty acids (FAHFAs) protect against colitis by reg-ulating gut innate and adaptive immune respons-es. J Biol Chem. 2016;291(42):22207–22217. 21. Bandak B, Yi L, Roper MG. Microfluidic-enabled
quantitative measurements of insulin release dynamics from single islets of Langerhans in response to 5-palmitic acid hydroxy stearic acid.
Lab Chip. 2018;18(18):2873–2882.
22. Hammarstedt A, et al. Adipose tissue dysfunction is associated with low levels of the novel palmitic acid hydroxystearic acids. Sci Rep. 2018;8(1):15757. 23. Wang YM, Liu HX, Fang NY. 9-PAHSA promotes
browning of white fat via activating G-protein- coupled receptor 120 and inhibiting lipopolysac-charide / NF-kappa B pathway. Biochem Biophys
Res Commun. 2018;506(1):153–160.
24. Pflimlin E, et al. Acute and repeated treatment with 5-PAHSA or 9-PAHSA isomers does not improve glucose control in mice. Cell Metab. 2018;28(2):217–227.e13.
25. Kuda O. On the complexity of PAHSA research.
Cell Metab. 2018;28(4):541–542.
26. Syed I, et al. Methodological issues in studying PAHSA biology: masking PAHSA effects. Cell
Metab. 2018;28(4):543–546.
27. Wang YM, Liu HX, Fang NY. High Glucose con-centration impairs 5-PAHSA activity by inhibit-ing AMP-activated protein kinase activation and promoting nuclear factor-kappa-B-mediated inflammation. Front Pharmacol. 2018;9:1491. 28. Jiang G, Zhang BB. Glucagon and regulation of
glucose metabolism. Am J Physiol Endocrinol
Metab. 2003;284(4):E671–E678.
29. Soty M, et al. Post-translational regulation of the glucose-6-phosphatase complex by cyclic ade-nosine monophosphate is a crucial determinant of endogenous glucose production and is con-trolled by the glucose-6-phosphate transporter.
J Proteome Res. 2016;15(4):1342–1349.
30. Burgess SC, et al. Cytosolic phosphoenolpyruvate carboxykinase does not solely control the rate of hepatic gluconeogenesis in the intact mouse liver. Cell Metab. 2007;5(4):313–320. 31. Zingone A, et al. Correction of glycogen storage
disease type 1a in a mouse model by gene thera-py. J Biol Chem. 2000;275(2):828–832. 32. Zheng D, Ionut V, Mooradian V, Stefanovski D,
Bergman RN. Portal glucose infusion-glucose clamp measures hepatic influence on postprandi-al systemic glucose appearance as well as whole body glucose disposal. Am J Physiol Endocrinol
Metab. 2010;298(2):E346–E353.
33. Zisman A, et al. Targeted disruption of the glu-cose transporter 4 selectively in muscle causes insulin resistance and glucose intolerance. Nat
Med. 2000;6(8):924–928.
34. Parniak M, Kalant N. Incorporation of glucose into glycogen in primary cultures of rat hepatocytes.
Can J Biochem Cell Biol. 1985;63(5):333–340.
35. Ayala JE, Bracy DP, McGuinness OP, Wasserman DH. Considerations in the design of hyperin-sulinemic-euglycemic clamps in the conscious mouse. Diabetes. 2006;55(2):390–397. 36. Lu B, et al. Metabolic crosstalk: molecular links
between glycogen and lipid metabolism in obesi-ty. Diabetes. 2014;63(9):2935–2948.
37. Petersen MC, Vatner DF, Shulman GI. Regulation of hepatic glucose metabolism in health and dis-ease. Nat Rev Endocrinol. 2017;13(10):572–587. 38. Lu M, et al. Insulin regulates liver metabolism in
vivo in the absence of hepatic Akt and Foxo1. Nat
Med. 2012;18(3):388–395.
39. Lam TK, Carpentier A, Lewis GF, van de Werve G, Fantus IG, Giacca A. Mechanisms of the free fatty acid-induced increase in hepatic glucose production. Am J Physiol Endocrinol Metab. 2003;284(5):E863–E873.
40. Golay A, Swislocki AL, Chen YD, Reaven GM. Relationships between plasma-free fatty acid concentration, endogenous glucose production,
and fasting hyperglycemia in normal and non- insulin-dependent diabetic individuals. Metab
Clin Exp. 1987;36(7):692–696.
41. Swislocki AL, Chen YD, Golay A, Chang MO, Reaven GM. Insulin suppression of plasma-free fatty acid concentration in normal individuals and patients with type 2 (non-insulin-dependent) diabetes. Diabetologia. 1987;30(8):622–626. 42. Paolisso G, Tataranni PA, Foley JE, Bogardus C,
Howard BV, Ravussin E. A high concentration of fasting plasma non-esterified fatty acids is a risk factor for the development of NIDDM.
Diabetolo-gia. 1995;38(10):1213–1217.
43. Hanson RW, Reshef L. Regulation of phosphoe-nolpyruvate carboxykinase (GTP) gene expres-sion. Annu Rev Biochem. 1997;66:581–611. 44. O’Doherty RM, Halseth AE, Granner DK, Bracy
DP, Wasserman DH. Analysis of insulin-stimu-lated skeletal muscle glucose uptake in conscious rat using isotopic glucose analogs. Am J Physiol. 1998;274(2):E287–E296.
45. Hesse B, Fischer MS, Schilling N. Distribution pattern of muscle fiber types in the perivertebral musculature of two different sized species of mice. Anat Rec (Hoboken). 2010;293(3):446–463. 46. Izumiya Y, et al. Fast/glycolytic muscle fiber growth
reduces fat mass and improves metabolic parame-ters in obese mice. Cell Metab. 2008;7(2):159–172. 47. Nyholm B, et al. Evidence of an increased
num-ber of type IIb muscle finum-bers in insulin-resistant first-degree relatives of patients with NIDDM.
Diabetes. 1997;46(11):1822–1828.
48. Lillioja S, et al. Skeletal muscle capillary density and fiber type are possible determinants of in vivo insulin resistance in man. J Clin Invest. 1987;80(2):415–424.
49. Abdul-Ghani M, DeFronzo RA, Del Prato S, Chil-ton R, Singh R, Ryder REJ. Cardiovascular dis-ease and type 2 diabetes: has the dawn of a new era arrived? Diabetes Care. 2017;40(7):813–820. 50. McGuinness OP, Ayala JE, Laughlin MR,
Wasser-man DH. NIH experiment in centralized mouse phenotyping: the Vanderbilt experience and rec-ommendations for evaluating glucose homeosta-sis in the mouse. Am J Physiol Endocrinol Metab. 2009;297(4):E849–E855.
51. Nelson AT, et al. Stereochemistry of endogenous palmitic acid ester of 9-hydroxystearic acid and relevance of absolute configuration to regulation.
J Am Chem Soc. 2017;139(13):4943–4947.
52. Scarlett JM, et al. Central injection of fibroblast growth factor 1 induces sustained remission of diabetic hyperglycemia in rodents. Nat Med. 2016;22(7):800–806.
53. Zhang T, et al. A LC-MS-based workflow for mea-surement of branched fatty acid esters of hydroxy fatty acids. Nat Protoc. 2016;11(4):747–763. 54. Alegre M, Ciudad CJ, Fillat C, Guinovart JJ.
Determination of glucose-6-phosphatase activity using the glucose dehydrogenase-coupled reac-tion. Anal Biochem. 1988;173(1):185–189. 55. Hong S, et al. Nicotinamide N-methyltransferase
regulates hepatic nutrient metabolism through Sirt1 protein stabilization. Nat Med. 2015;21(8):887–894. 56. Folch J, Lees M, Sloane Stanley GH. A simple