warwick.ac.uk/lib-publications
A Thesis Submitted for the Degree of PhD at the University of Warwick
Permanent WRAP URL:
http://wrap.warwick.ac.uk/117034
Copyright and reuse:
This thesis is made available online and is protected by original copyright.
Please scroll down to view the document itself.
Please refer to the repository record for this item for information to help you to cite it.
Our policy information is available from the repository home page.
Quantifying Human Behaviour With Online Images
by
Merve Alanyali
Thesis
Submitted to the University of Warwick
for the degree of
Doctor of Philosophy
Warwick Business School
Contents
List of Tables iv
List of Figures v
Acknowledgments vii
Declarations ix
Abstract xi
Chapter 1 Introduction 1
Chapter 2 Background 3
2.1 Computational Social Science . . . 3
2.1.1 Internet as an information source . . . 4
2.1.2 Internet as a communication channel . . . 8
2.1.3 Internet as a crowdsourcing platform . . . 13
2.1.4 Issues with online data and privacy . . . 14
2.2 Image analysis and deep learning . . . 15
2.2.1 Convolutional neural networks: an overview . . . 18
2.2.2 Building blocks of a CNN . . . 19
2.2.3 Training and knowledge transfer . . . 23
2.2.4 Applications . . . 26
Chapter 3 Tracking Protests With Flickr 28 3.1 Introduction . . . 28
3.2 Data . . . 29
3.2.1 Flickr data . . . 29
3.2.2 The Guardiandata . . . 29
3.3 Analysis and results . . . 30
3.4 Summary and discussion . . . 32
Chapter 4 Using Deep Learning to Detect Protest Outbreaks With Flickr Pho-tographs 35 4.1 Introduction . . . 35
ii CONTENTS
4.3 Methods . . . 37
4.3.1 Training an initial classifier to detect protest scenes . . . 37
4.3.2 Training a refined classifier to detect protest scenes . . . 39
4.3.3 Creating Receiver Operating Characteristic (ROC) curves . . . 39
4.3.4 Computing Akaike Information Criterion (AIC) weights . . . 41
4.4 Analysis and results . . . 41
4.5 Summary and discussion . . . 45
Chapter 5 Estimating Socioeconomic Attributes Using Instagram 48 5.1 Introduction . . . 48
5.2 Data retrieval and preprocessing . . . 49
5.2.1 London data . . . 49
5.2.2 New York City data . . . 54
5.3 Methods . . . 56
5.3.1 Creating feature vectors . . . 56
5.3.2 Training a classifier to recognise pictures of food . . . 57
5.4 Analysis and results . . . 60
5.4.1 Quantifying the relationship between food pictures and restaurant rat-ings . . . 60
5.4.2 Estimating household income for London using photographs shared onInstagram . . . 64
5.5 UsingInstagramphotographs to estimate household income in New York City 75 5.6 Summary and discussion . . . 81
Chapter 6 Forecasting 311 Complaints in New York City 83 6.1 Introduction . . . 83
6.2 Data retrieval and preprocessing . . . 84
6.3 Methods . . . 85
6.3.1 Creating NYC grid cells . . . 85
6.3.2 Calculating risk values using historical records . . . 85
6.3.3 Calculating risk values usingFlickr photographs . . . 88
6.4 Analysis and results . . . 90
6.4.1 Forecasting 311 complaints using historical records . . . 90
6.4.2 Forecasting 311 complaints usingFlickr photographs . . . 93
6.5 Summary and discussion . . . 99
Chapter 7 Conclusions 102
Appendix A 107
Appendix B 125
CONTENTS iii
List of Tables
4.1 Model comparison results. . . 45
5.1 Change in the performance of the elastic net model as we adjust the lower limit of the number of food-related photographs shared on Instagram per restaurant. . . 63 5.2 Performance scores for the elastic new models created using different
fea-ture sets. . . 68 5.3 Performance scores for different models that aim to estimate the income of
New York City at census tract level using information from Instagram pho-tographs. . . 76
6.1 The area under the curve (AUC) values calculated for predictions generated by the spatiotemporal, static and seasonal models. . . 95 6.2 Paired comparisons of the AUC values for the spatiotemporal, static and
seasonal models. . . 95 6.3 The area under the curve (AUC) values calculated for predictions generated
by the logistic regression basedcombined,Flickr and spatiotemporal models. 98 6.4 Paired comparisons of the AUC values for the logistic regression based
spa-tiotemporal,Flickr and combined models. . . 98
List of Figures
2.1 Correlation between the daily number of mentions of a company name and
transaction volume of a company’s stock. . . 7
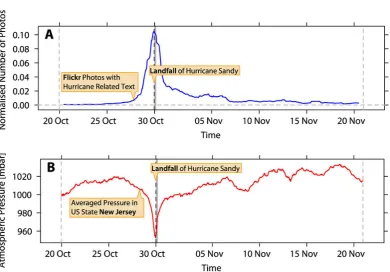
2.2 Comparison between the proportion of Hurricane Sandy relatedFlickr pic-tures and the atmospheric pressure. . . 9
2.3 Link between the official statistics andFlickr based estimates of the number of UK visitors. . . 10
2.4 A Venn diagram illustrating the relationship between different subfields of AI. 16 2.5 Structure of a regular neural network (left) versus convolutional neural net-work (right). . . 18
2.6 Toy example of a convolution operation. . . 20
2.7 Creating the activation map of a 3D input. . . 21
3.1 Reports of protests in 2013 in the online edition ofThe Guardian. . . 31
3.2 Locations ofFlickr photographs labelled with “protest” in 2013. . . 33
4.1 Work flow for training the CNN based classifier. . . 40
4.2 Evaluating the performance of the classifier. . . 42
4.3 Sample set of pictures automatically grouped by the classifier. . . 43
5.1 Total number of Instagram pictures per MSOA shared during a six-month period between September 2015 and February 2016. . . 50
5.2 Number of restaurants in theYelpdataset. . . 52
5.3 MSOA level median household income estimates. . . 54
5.4 Total number ofInstagrampictures per census tract taken in New York City over a six-month period. . . 55
5.5 Median income of New York City at census tract level. . . 56
5.6 Sample images with their feature vectors. . . 58
5.7 Evaluating the performance of the food classifier. . . 60
5.8 Change in the correlation between actual and estimated values with respect to the threshold. . . 62
5.9 Features with ten largest and ten smallest coefficients. . . 66
5.10 Actual and estimated income patterns across London. . . 71
vi LIST OF FIGURES
5.12 Ten largest positive and ten largest negative coefficients of the ImageNet+Places
model. . . 73
5.13 Sample Flickr pictures and their ImageNet labels generated by the pre-trained CNN using the VGG-M-128 architecture. . . 74
5.14 Actual and estimated income for census tracts in New York City. . . 77
5.15 Visual comparison of actual and estimated income values computed by the Combined model across New York City. . . 78
5.16 Ten largest positive and ten largest negative coefficients of the Combined model for New York City. . . 80
6.1 Total number of Flickr pictures taken and uploaded in the same week be-tween 2012 and 2014. . . 86
6.2 Three different models for identifying areas at risk. . . 89
6.3 Location of incidents reported using the 311 service. . . 91
6.4 Time and location of incidents reported using the 311 service. . . 92
6.5 Evaluating different prediction models. . . 94
6.6 Evaluating different prediction models for noise-related complaints. . . 97
Acknowledgments
First of all, I would like to express my deepest and warmest gratitude to Professor Tobias
Preis and Professor Suzy Moat who have been more than just supervisors to me since
my MSc years. Without their endless support and guidance you would not be reading this
thesis. It has been such a valuable experience for me to be working with you but most
importantly getting to know such amazing academics and people. I am also very grateful
to the University of Warwick (Chancellor’s International Scholarship Scheme) and The Alan
Turing Institute (the enrichment year programme) for financially supporting my studies.
I am also very thankful to all my friends in the Data Science Lab, Complexity Centre,
Warwick Business School and The Alan Turing Institute for their valuable feedback and
comments which immensely helped me shape and improve my work. I would also like to
thank them for being great companions and for keeping me sane (maybe!) during stressful times.
I am thankful to every single person who has touched my life in many ways. I will
probably need to write another thesis to fit everyone in but there are a few names I want to
mention before proceeding to the serious content. My special thanks go to:
My very first teacher, Sehrayi Con, for her persistence to make me enjoy going to
school and building strong ground for my (never-ending) journey of education,
All my teachers at Izmir MEV Koleji, Izmir Ozel Turk Fen Lisesi for all the science
and life lessons they taught,
My professors at the Computer Science Department of Izmir University of
Eco-nomics for helping me establish foundations of my academic career (even though this might
have meant making my university years pretty much a living hell),
All my true friends who share my happiness and sadness and send their constant
love and support even they are in a country far far away (maybe not that far, but still) (Merve,
Ozge, Selin, Duygu, Begum, Gokhan, Alican, Ekincan and many more.),
Teoman aka bafir for being a true companion of all the fun(!) we have to endure in this life,
viii ACKNOWLEDGMENTS
the bestnggfriend (also for proofreading my thesis),
Diana for being my very first true friend in England (life at Warwick would have been
dull without you!),
Chanuki and Ben for being the ultimate source of energy and fun and making sure I
do not fall behind social life (extra thanks to Ben for his super human proofreading skills and
Chanuki for, apart from being a true friend, also being a great colleague and collaborator),
Busem for being the bestest of best friends from miles away (best
sister-from-a-different-mum I could have asked for),
#dogsofinstagram, especially the daily ollie for brightening my dull days with their
fluffy posts,
“The gang” for keeping my inner(!) child alive,
My family on earth and in heaven (both mine and Tom’s) for their unconditional love and infinite support (and for all my loved ones in heaven - my thoughts are always with
you),
And let me stop here. I have been trying to write this part for so long that I can
say it is harder than writing the entire thesis. Because there are no words to express what
these two people mean to me. I will try anyway knowing that words will not do any justice
to them.
Mum - without your limitless support and motivation I would not have become the
person I am now. Can not thank you enough for everything you have done (and keep doing)
for me. You are my true inspiration!
Tom (or shall I say Dr Rafferty?) - without you by my side (especially during the big resets) in academic life and beyond I cannot image how I would have coped. Thank you for
“being the unique solution to my ordinary differential equation”.
Declarations
This work has been composed by myself and has not been submitted for any other degree
or professional qualification.
• Chapter 3 has been published in Alanyali et al. (2016). At the time of writing this
thesis, it has received six citation and received “Honourable Mentions” at 2016
Asso-ciation of British and Turkish Academics (ABTA) Doctoral Researcher Awards under
Management & Social Sciences category.
• The work done in Chapters 3 and 4 has been presented together in more than ten conference talks, including five invited talks. It has also been presented as a poster
at three events.
• The work done in Chapters 4 and 5 will be submitted for publication.
• At the time of writing this thesis, the work from Chapter 5 has been presented in three
invited meet-up and conference talks.
• Part of the work presented in Chapter 6 has been submitted toRoyal Society Open
To know that you do not know is the best.
To think you know when you do not is a disease.
Recognising this disease as a disease is to be free of it.
Abstract
From online searches to social media posts, our everyday interactions with the Internet are
creating vast amounts of data. Large volumes of this data can be accessed rapidly at low
cost, opening up unprecedented possibilities to monitor and analyse social processes and
measure human behaviour.
As Internet connectivity has continued to improve, photo-sharing platforms such as
InstagramandFlickr have gained widespread popularity. At the same time, considerable
advances have been achieved in the power of computers to analyse the contents of images. In particular, deep learning based methods such as convolutional neural networks have
radically transformed the performance of systems seeking to identify objects in images, or
classify the contents of a scene.
Here, we showcase a series of studies in which we seek to quantify various aspects
of human behaviour by exploiting both the large quantities of photographic data shared
online and recent developments in computer vision. Specifically, we investigate whether
data extracted from photographs shared onFlickr andInstagramcan help us track global
protest outbreaks; estimate the income of inhabitants living in different areas of London
and New York; and predict the occurrence of noise complaints in New York City.
Our findings are in line with the striking hypothesis that information extracted through automatic analysis of photographs shared online may help us measure human behaviour,
CHAPTER 1
Introduction
Developments in technological devices are placing them at the very heart of our daily rou-tines, and changing many aspects of our lives. From mobile phones to computers, the widespread usage of such devices and the online services they connect us to are gener-ating vast amounts of data documenting everyday behaviour at a national or even global scale.
As a consequence of improved connectivity, sharing visual media has become ubiq-uitous in recent years. More and more online posts, particularly on social media channels, have shifted from being solely text based to include multimedia, such as videos and pho-tographs. Here, by exploiting the vast amount of photographs shared online, we present a series of studies investigating how state-of-the-art image analysis methods can be applied on this new form of data in order to detect global events, estimate socioeconomic statistics and predict the location of non-emergency incidents.
In Chapter 2, we cover a wide range of example studies in the emerging field of Computational Social Science. We provide an extensive discussion of how previous re-search utilised data extracted in numerous forms from online platforms including re-search engines and social media channels in order to gain insights into human behaviour. We also present a detailed discussion of the advances in image analysis algorithms with a primary focus on deep learning methods.
Over the last few decades, we have witnessed an increased number of protests emerging across countries and continents, sometimes leading to political change or mass casualties. During times of protests, online users turn to social media channels to organise protests, mobilise people and spread information. This increased usage of social media is generating large amounts of data and creating almost real-time reports of protest out-breaks around the world. In Chapter 3, we analyse textual data attached to a large set of photographs shared on Flickr to investigate whether it is possible to use this data to track protest outbreaks across the globe. We quantify the relationship between the num-ber of pictures onFlickr uploaded with a tag containing the word “protest” in 34 different languages and the number of protest related news articles published in the online version of the newspaperThe Guardian. We find that greater numbers of protest tagged pictures correspond to higher proportions of protest related news articles.
In addition to text based data,Flickr offers a rich set of information: the photographs themselves. Ignited by advances in computational power and an increased number of data sets available online, deep learning architectures especially convolutional neural networks have proved their power in numerous image analysis problems including classification. In Chapter 4, we therefore extend our initial analysis from Chapter 3 by incorporating data extracted fromFlickr photographs using a convolutional neural network based framework. Our findings provide evidence that a higher number of pictures automatically classified as being protest related by our custom-built classifier is linked to a higher proportion of protest related news articles in the newspaperThe Guardian.
A portrayal of the socioeconomic status of a country is immensely crucial for policy makers. For decades, the main source of such information has been surveys conducted by national agencies. Despite offering rich and valuable information, running such labour intensive exercises can be immensely costly. Furthermore, results are usually released with a delay and therefore do not necessarily reflect the current status of a city or a country. In Chapter 5, we demonstrate how visual characteristics of images shared onInstagram
can help us create a spatial income profile of two major cities, London and New York City. Our findings set an example that automatic analysis of online pictures may give us insight into key socioeconomic attributes of metropolitan areas around the world.
CHAPTER 2
Background
From communication to transportation and shopping to daily exercise, technological de-vices reside at the very centre of modern life. The widespread usage of these dede-vices and the online services they offer are creating strikingly detailed data on everyday behaviour. These gigantic streams of online data tend to be available at high speed and low cost, offering new ways to measure aspects of individual and group behaviour at a national or even global scale. Researchers therefore have begun to investigate whether this fast grow-ing online data can be used as a practical supplement to the information extracted from traditional methods used to study human behaviour. This has given rise to a new field of data-driven research, often referred to as Computational Social Science or Social Data Science (Conte et al., 2012; King, 2011; Lazer et al., 2009; Moat et al., 2014).
In the first part of this chapter we demonstrate a wide range of studies that fall within the field of Computational Social Science. We provide a detailed discussion of how these studies exploit online data extracted from numerous channels to provide insights into various aspects of human behaviour. In the second part of this chapter, we present a review of the methods used for analysing images, which is useful for the work we present in the following chapters.
2.1
Computational Social Science
The increasing quantities of available data documenting human behaviour is opening up new ways to address problems arising in social sciences, even offering possibilities to tackle problems that were previously intractable using traditional data sources. From search en-gines to social media platforms, a diverse set of channels are contributing to this expanding data generation process. In recent years with improved Internet connectivity, the form of online data has shifted from being solely text based to multimedia such as pictures and videos. Ignited by the vast quantities of online data in many forms, an increasing number of studies have been undertaken in the emerging field of Computational Social Science (Conte et al., 2012; King, 2011; Lazer et al., 2009; Moat et al., 2014). By drawing on the methods developed across a wide range of disciplines such as computer science and
statistics, these studies aim to create a new form of “mass ethnography” (Bentley et al., 2014).
In the following sections, we will focus on individual examples operating on a di-verse set of online data. Despite the amount of data available online, it is naive to assume that an online user profile is an exact representation of the entire demographic. We there-fore provide a discussion on potential biases that online data might incorporate as well as the pitfalls that such biases might cause in any analysis. Data ethics and ownership are other crucial issues that need to be considered when working with online data. Thus, we include a brief review touching these issues before finalising our discussion on Computa-tional Social Science.
2.1.1
Internet as an information source
The proliferation of technology is changing multiple aspects of our daily lives. A significant change is happening in the way we collect information. Information gathering is a crucial step in the decision making process, as it enables us to refine the coarse prior knowledge upon which we base our initial opinion (Simon, 1955). Building upon the vast amount of easily accessible information, the Internet has become the ultimate information source for individuals making decisions in the modern world (Moat et al., 2016). As more and more people turn to the Internet in search of information, an increasing number of studies exploit this increased online activity as a proxy of collective consciousness.
Over the last few decades, search engines have made a big impact on how we search for information. Constantly improving their indexing and searching algorithms, they provide users with quick and effective ways to retrieve information.Google, without a doubt, is one of the most popular search engines. In addition to helping online users find infor-mation, it also makes search volume data publicly available via itsGoogle Trendsservice. Search terms are given a relative popularity, which is calculated by normalising the search frequency of a specific term with the total search volume coming from that location over a certain period of time. Relative search volumes are available since 2004 with a weekly granularity, however, if the requested historical data is closer to the time of the request, then the time granularity can go down to days or even hours. Motivated by the large amount of publicly available and easily accessible data combined with a user friendly interface that also provides basic visualisation of the underlying data,Google Trendshas been a popular source of data among researchers.
whether online users tend to search for information about the future rather than the past. Their findings suggest that nations with a higher Gross Domestic Product (GDP) tend to focus more on the future than the past. Building on this study, Noguchi et al. (2014) inves-tigated whether time-perspectives for nations change in relation with their GDP. Letchford et al. (2016) usedGoogle Correlateto compare search behaviour across US states. They illustrated how search behaviour varied with demographic variables such as infant mortality rates, providing evidence that search data might offer insight into the concerns of different demographics.
Changes in stock markets have an impact on the lives of many individuals both from the financial sector and beyond. Understanding and predicting the behaviour of this complex system therefore has obvious benefits. Hence, a number of studies have focused on usingGoogle Trendsdata to create early warning signals before stock market moves. Preis et al. (2013b) demonstrated that changes in the number of finance related terms sub-mitted toGooglecan be used as indicators of stock market movements. They constructed a hypothetical trading strategy to buy or sell the Dow Jones Industrial Average (DJIA) by using the search volume of a wide range of terms related to the stock markets which which they refer to as the “Google Trendsstrategy”. They showed that theGoogle Trendsstrategy implemented for the search volume of the term “debt” within a three week window would have increased the portfolio by 326% whereas the buy and hold investment strategy yielded an increase of only 16%. Similar results were found when usingGoogle searches for the names of Dow Jones companies to anticipate movements in the value of the company’s stock (Preis and Moat, 2015). A separate study showed how data fromGooglesearches can be used in portfolio selection and risk diversification (Kristoufek, 2013b).
Another prominent scenario in which search engine data has proved to be useful is monitoring public health. Timely detection of disease activity is crucial for taking rapid actions to prevent the further spread of the disease. A whole body of research has focused on creating timely estimates for the spread of influenza like epidemics using search data. Ginsberg et al. (2009) provided evidence that spread of the influenza like diseases can be predicted by analysing the search volume of flu related words onGoogleIt was also turned into aGoogleservice; “Google Flu Trends” which was releasing an estimate for the number of cases of an epidemic disease such as flu and dengue. This service no longer releases new estimates however historical data is available to download.
Despite being a big success when published, Google Flu trends failed between 2012-2013 by overestimating the flu spread. Alternative studies were published discussing the potential reasons causing the failure as well as enhancing the initial method to show that search engine data may provide significant information on the key health indicators (Lazer et al., 2014; Preis and Moat, 2014). Kristoufek et al. (2016) detailed another application of search data in the area of public health, investigating whetherGoogledata can be used to improve estimates of suicide occurrence statistics.
There are a number of other studies that exploit data from alternative search en-gines or tools. Goel et al. (2010) used data fromYahoosearch results to predict consumer
activity including box office revenue, sales of video games and music charts. In Bordino et al. (2012), the authors extracted search volume for the queries made toYahoo related to the companies listed in NASDAQ-100. They found evidence of a positive correlation be-tween stock related search volume and the trading volume of the same stocks on following days.
Instead of focusing on search volume data from a single search engine, Ettredge et al. (2005) used WordTracker, which extracts data from the “Web’s largest meta search engines”. In Hulth et al. (2009), the authors took a different approach by analysing the volume of search queries sent to a Swedish medical website to show the potential of web queries in syndromic surveillance.
Search engines are not the only source that online users turn to when seeking in-formation.Wikipediais a web-based free encyclopedia created and updated by millions of volunteers around the world. With more than 16 billion page views in March 2018 (Wikime-dia, 2018),Wikipediais one of the most visited websites on the World Wide Web. The num-bers of visits and edits for each individual page are recorded and made publicly available. Just like the data on search volumes, this large dataset has quickly become popular among researchers as a valuable source of information documenting online activity ofWikipedia
users. Moat et al. (2013) provided evidence that the amount of traffic attracted by finance relatedWikipediapages can be used as early indicators of stock market moves. Another study utilisedWikipediaedit logs in order to investigate the behaviour of multilingual users, which are defined as users editingWikipedia pages in multiple languages (Hale, 2014). The authors showed that on average, multilingual editors tend to be 2.3 times more active in editing compared to monolingual editors. Another study illustrated how the popularity of a film can be predicted before its release by analysingWikipediaactivity (Mesty ´an et al., 2013).
Several studies have exploited data generated by combined interactions with both
Google and Wikipedia. Kristoufek (2013a) showed that fluctuations in BitCoin price are positively correlated with both BitCoin related search volume onGoogle and page views on Wikipedia, and demonstrated a strong bidirectional causal link between the BitCoin price dynamics and the change in search and page view frequencies. Another example of research utilising data from bothGoogleandWikipediais Curme et al. (2014). In their paper, the authors analysed the Google search volume of a large set of keywords that were extracted by analysing the entire set of articles in the English version ofWikipedia. They showed that keywords related to politics or business are linked to movements in stock markets.
finan-cial news and that company’s stock in the stock market. They focused on the companies that are listed in DJIA and for each company extracted the daily number of mentions of its name in theFinancial Times. Figure 2.1 depicts the correlation between daily mentions and transaction volume of the company’s stock. They showed the existence of a positive correlation between the number of mentions and the transaction volume. They unveiled a similar relationship between the number of mentions and the absolute return price of a company’s stock, however they found no evidence of a relationship between the number of mentions and the return price once the direction of the change is taken into account.
Figure 2.1: Correlation between the daily number of mentions of a company name and transaction volume of a company’s stock.
Figure taken from Alanyali et al. (2013).
Data extracted from online news articles are also widely used as a proxy in the absence of reliable ground truth data. Braha (2012) analysed civil unrest across 170 coun-tries over a 90 year period. As the main source of unrest data, they used articles from theNew York Times. They showed that the distribution of unrest events that happened over any given year can be modelled using a dynamical model highlighting the similarity between the spread of the unrest events and dynamics of the spread of the other events
such as natural disasters and epidemics.
2.1.2
Internet as a communication channel
Apart from how we gather information, yet another facet of our daily lives that is experi-encing a major makeover due to the changes introduced by technological devices is the way we interact with one another. Social interactions either professional or personal which used to be in person have been shifting online. With the emergence of social media chan-nels, forms and tools of communication have been changing remarkably. Nowadays, it is common to hold international meetings online without the need to travel between coun-tries; connect with geographically-distant friends for face-to-face conversations; or share daily snapshots of our lives with family, friends or even people that we haven’t met and may never meet.
As a result of widespread usage of social media, the large amounts of data gen-erated are offering insights into what people are thinking along with snapshots of what is happening around the world at a national or even global scale. Hence, an increasing number of studies have been conducted to understand the dynamics of these social media platforms (Liu et al., 2018; Traud et al., 2012; V ´azquez et al., 2002). Furthermore, in the hope of measuring collective consciousness, social media has also become a main focus for researchers, as well as being a top agenda item for many businesses.
Soon after its creation in 2004 as a tool for an online multiplayer game,Flickr has been turned into an image and video hosting platform, qne is now one of the most popular image sharing platforms on the Web.Flickris providing a platform where people can upload and manage their pictures. It is a social network where users can follow other users, create groups, and like and comment on each others photos and videos. When uploading visual media content,Flickr allows users to include a user-defined textual tag, title and description as well as further information about the media such as the date and location where it was taken, which are typically added automatically if the media is being uploaded from a mobile device.
In order to provide easy access to the large amounts of pictures shared online
Flickr offers an open API that enables non-commercial users and developers to exploit the database of publicFlickr data. Not surprisingly, the existence of this API has placedFlickr
in the focus of many scientific studies.
(Figure 2.2).
Figure 2.2: Comparison between the proportion of Hurricane Sandy relatedFlickr pictures and the atmospheric pressure.
(A) The number of Hurricane Sandy related pictures normalised with the daily number of
Flickrpictures at an hourly granularity. (B) The change in the atmospheric pressure in New Jersey, US at hourly granularity. Figure taken from Preis et al. (2013a).
Geotagged data can also be extremely useful to identify characteristics of different areas across cities. In Aiello et al. (2016), the authors analysed tags of 17 millionFlickr
pictures taken between 2005 and 2015 in order to create maps of sounds around the streets of London and Barcelona.
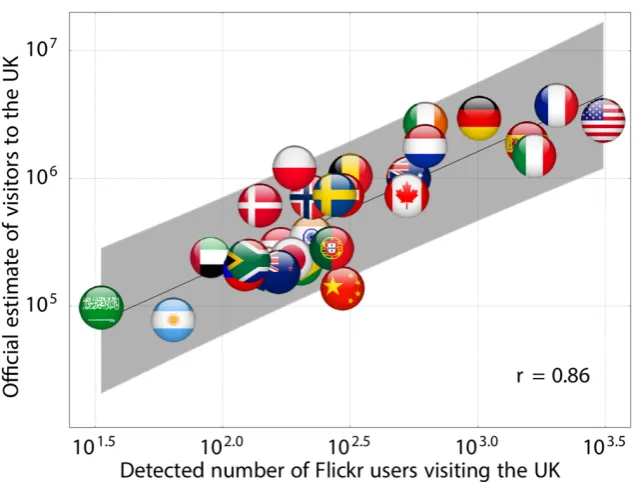
Exploiting the broad spatial and temporal coverage offered by the pictures uploaded toFlickr, Barchiesi et al. (2015a) focused on quantifying international travel flows to the UK usingFlickr pictures. The authors extracted user profiles with pictures taken in the UK between 2008 and 2013. For each user, by analysing the location of the other pictures they uploaded toFlickr, the authors identified their potential country of origin. Using this data, they generated estimates of traffic flows to the UK, and compared them with the data collected via International Passenger Survey to provide evidence of a significant link be-tween the estimated numbers and the official statistics. Figure 2.3 depicts the relationship between the official statistics and theFlickr based estimates of UK visitors from 28 coun-tries which are represented by the flag of the corresponding country. A different study on modelling mobility also exploited data fromFlickr users to show that human mobility pat-terns obey Levy flights (Barchiesi et al., 2015b). Similarly, Wood et al. (2013) estimated
where the visitors to 836 recreational sites across 31 countries come from by analysing the profiles of the users who shared a picture from these recreational sites.
Figure 2.3: Link between the official statistics andFlickr based estimates of the number of UK visitors.
The authors demonstrated a significant correlation between the number of visitors from each one the 28 countries represented here by their flags and the number of users ex-tracted fromFlickr (r =0.86,N = 28,p <0.001, Pearsons correlation test). Figure taken from Barchiesi et al. (2015a).
Other studies focusing on Flickr data have investigated whether tags and visual characteristics of the images can help identify spatial and temporal patterns such as fa-mous landmarks and significant events (Kennedy et al., 2007), analysed general patterns of tag usage focusing on pictures from the university groups (Angus et al., 2008), explored the relationship between house prices and art (Seresinhe et al., 2016), and used data on
Flickr photographs to inform estimates of the beauty of the environment (Seresinhe et al., 2018).
Shortly after the launch of the multimedia sharing platformFlickr, in 2006 a new form of microblogging website was introduced into the social media space.Twitter started mainly as text-based social media platform originally restricting its users to 140 character posts called “tweets”. Now, as wel as enjoying a higher character limit, users can share text and multimedia, follow or send direct messages to other users, and like and respond to others’ tweets. Just likeFlickr, Twitter also provides an API that makes a selection of public tweets available to download.
human behaviour. Steinert-Threlkeld et al. (2015) used 14 million geolocalised tweets from 16 countries during the period of the Arab Spring in 2010-2011 to show a significant link between certain hashtags and the number of protests the following day. Exploiting data on
Twitter activity recorded over two months in and around the Milan area, Botta et al. (2015) showed that it is possible to estimate the crowd size within a certain area. Alis et al. (2015) investigated whetherTwitter data can provide quantitative evidence of regional differences in how talkative people are. Ciulla et al. (2012) used geoataggedTwitter data to map where fans of individual contestants of the TV show American Idol are populated both within US and abroad as well as predicting the outcome of the show. In Bollen et al. (2011a), the authors showed a significant correlation between socio-economic, cultural and political events and the public mood extracted from a corpus of nearly 10 million tweets.Twitter data was also used to gain insights into the movement of stock markets. Bollen et al. (2011b) provided evidence of a relationship between changes in public mood and fluctuations of Dow Jones Industrial Average (DJIA) values. They also showed that predictions of the DJIA are significantly more accurate once the public mood, which was extracted from a large set of tweets, was included.
In recent years, online political propaganda, as a supplement to standard offline campaigns has an extensive role in a leader’s campaign programme. A selection of stud-ies therefore have usedTwitter to analyse public opinion and predict outcomes of political elections. Focusing on the German federal elections, Tumasjan et al. (2010) analysed a set ofTwitter messages referring to a political party or a politician and extracted the sentiment of these messages. Their findings highlight the widespread usage ofTwitterfor political dis-cussions as well as showing a relationship between sentiment and political programmes. In Conover et al. (2011), the authors analysed the underlying tweet-retweet network from the two opposing sides of a political discussion of the US Congressional Elections. They showed that users tend to retweet posts of other users that share similar political views while there is a very limited connection between left-leaning and right-leaning sympathis-ers. On the other hand, several studies have criticised applications that overemphasise predictions of electoral outcomes usingTwitterdata. For instance, Gayo Avello et al. (2011) performed analysis which have proven to perform well in predicting election results using
Twitter data but failed to find a correlation between their findings and the actual electoral outcome. Hence they concluded that findings of analyses based onTwitter data should be interpreted with caution due to the potential bias introduced by the fact that theTwitter user base is not an exact representation of the entire population.
Another popular social media platform isFacebook, which was originally released around the same time as Flickr, although it wasn’t until 2006 that it was opened to the general public. Nowadays, 68% of Americans useFacebook and 75% of them report that they use the platform on a daily basis Smith and Monica (2018). Although it has been widely used since its public launch, not many studies have been conducted usingFacebookdata, as unlike the previous platforms discussed above, there is no public API allowing data access. The only way to extract data is via applications, mainly the Graph Explorer API
provided byFacebook, however, it only lets users download the data that they have access to; their own profile, data from their friend network and public profiles and pages. Due to the restricted access to this giganticFacebook dataset, among the studies exploiting data from social media,Facebook does not have the lion’s share.
In order to analyse the influence and spread of information on social networks, Aral and Walker (2012) exploitedFacebook data from 1.3 million users. They revealed striking findings suggesting that younger users are more susceptible to influence than older users and married users are the least susceptible group in using the product that was offered. In addition to the traditional interview-based methods, Boichak (2017) usedFacebook to analyse civilian resistance networks during the Ukraine conflicts.
Facebook have themselves attracted negative media attention with the controver-sial study they conducted on the user profiles without the user’s consent (Kramer et al., 2014) as well as the security breach regarding to Cambridge Analytica case.
Starting as an application only for iOS devices in 2010 and bought byFacebook in 2012,Instagramis a photo sharing platform with more than 800 million active monthly users and 40 billion total pictures (Instagram, 2017). It allows users to share visual content such as pictures and short videos either publicly or to a user-defined audience. The pictures can be uploaded with extra information embedded such as a timestamp indicating when the picture was taken or a georeference showing where the picture was taken. In addition, users can indicate the name of the place where the picture was taken by choosing from a list of location names or by creating their own location name.
Instagramprovides an API that allows access to data from public profiles however, there has been a major change in the Terms of Use, effective since June 1, 2016, making data access far more restricted. Especially before the change took place, a number of studies were published usingInstagramdata to investigate human behaviour.
Hochman and Manovich (2013) compared visual aspects of Instagram pictures from 13 different cities. By analysing pictures from Tel Aviv taken over a three month period as a case study, they showed how online photographs can offer social, political and cultural insights. Similar studies have also been conducted using visual elements ofInstagram
data to trace visual cultural rhythms in New York City and Tokyo (Hochman and Schwartz, 2012) and to identify elements that differentiate one city from another by using Paris as an example (Doersch et al., 2012).
A considerable number of studies combined data extracted from different social media platforms in order to investigate whether diversifying the data would bring additional input as well as to compare the dynamics and power of distinct platforms in answering their research problems. For instance, In Zhang et al. (2017), the authors used data ex-tracted fromTwitter andFacebook to analyse and compare how politicians use different social media channels to communicate their party programme during the 2016 US pres-idential campaign. Another example is by Quercia et al. (2015), a similar study to Aiello et al. (2016), where the authors extracted geotagged pictures fromFlickr andInstagram
together with georeferenced tweets fromTwitter to generate a map of smells in London and Barcelona.
2.1.3
Internet as a crowdsourcing platform
In addition to information gathering and communication, another innovation the Internet has introduced is crowdsourcing platforms. Traditional techniques in analysing human be-haviour involve rigorous surveys, interviews and laboratory experiments with controlled conditions. Although they provide rich and valuable information, conducting studies at scale can be very costly as well as having inherent difficulties such as finding participants. Crowdsourcing platforms offer scientists working with the most complex system – humans – an alternative medium to orchestrate surveys at large scale at ease.
In order to analyse the relationship between wellbeing and environmental factors, MacKerron and Mourato (2013) created a smartphone application that asks its users to re-port on their mood several times a day, and records their answers along with their location. They found that users feel happier when they are around natural environments, while also reporting limitations on drawing conclusions on causal relationships. In a different study, Seresinhe et al. (2015) utilised data from a crowdsourcing platform that gathers ratings of “scenicness” for photographs of areas across Great Britain. Their results showed that perceived beauty of an environment may have an effect on our wellbeing.
Amazon’sMechanical Turk is another famous example of a crowdsourcing plat-forms. Unlike the previous examples, Mechanical Turk is a micro-task website where stake-holders can upload tasks with a specific price for the human users to complete. The tasks can vary with the most common cases being creating annotated datasets for computer vi-sion or natural language processing tasks. Kittur et al. (2008) discussed the usage of Me-chanical Turk in user studies highlighting the importance of formulating the tasks. Widely used image benchmark datasets ImageNet, Places Database and SUN Database, which will be discussed in the following parts of this thesis also benefited from the large user base of theMechanical Turk platform.
Another sector that benefits immensely from crowdsourcing platforms is the com-mercial sector. It is crucial for a business to be part of a crowdsourced review platform due to numerous reasons such as increasing their online presence, measuring customer satisfaction and interacting with their customers. This two way interaction is creating an
enormous amount of data. As in the examples discussed in the previous sections, some of these platforms make their data publicly available via APIs. One example of such a platform isYelp.
Yelpis a crowdsourcing platform designed to collect users’ reviews of businesses that include, but are not limited to, rating businesses by giving them a score out of 5, writing free-text reviews and uploading pictures of a given business. In addition to crowd sourcing reviews for businesses, Yelp provides its users a range of extra options such as posting on forum pages, finding nearby events or as on social media platforms, connecting with friends. Yelppublished an extensive dataset on the data science challenge platform Kaggle, comprising more than 5 million reviews from over 150 000 businesses spanning 11 major cities as well as releasing a restaurant photo classification challenge on the same platform in 2016. Apart from the data made available on Kaggle, through the free APIYelp Fusion,Yelpprovides access to its data on more than 50 million businesses in 32 countries Yelp (2018) which makes it an attractive resource for researchers.
Luca (2016) analysed a set of restaurant reviews onYelptogether with restaurant data from the Washington State Department of Revenue in order to investigate whether online reviews have an effect on restaurant demand. Another study focused on review fraud (Luca and Zervas, 2016). The authors analysed reviews that are identified as fake by Yelp’s filtering algorithm. They present four main findings including that a it is more likely for a restaurant to commit review fraud given that it does not have many reviews and when it has recently received a bad review. McAuley and Leskovec (2013) utilised reviews posted on Yelp to suggest including review text together with the ratings to improve the performance of a recommender system.
2.1.4
Issues with online data and privacy
Studies presented in the previous sections set an example of how online data can be used to shed light on various questions arising in social sciences, however, the limitations of these gigantic datasets should be carefully considered and reported. One important limitation is the bias in usage. Online user groups are not an exact representation of the offline population groups. The lack of demographic information therefore forms a critical impediment in using online data to analyse human behaviour and collective consciousness. For instance, Internet usage varies profoundly between different age groups and countries yielding an uneven representation of different groups online. Hence, several studies have been conducted to infer user demographics on social media through analysing users’ posts. In Sloan et al. (2015), the authors compared the age, occupation and social class of the
methods.
Training data is crucial when building supervised machine learning systems. Even though the designer of the system knows the details of the underlying algorithm, training data can make the end product biased. For instance, Microsoft launched a chat bot called Tay on Twitter with the training set being tweets of the other users. It was shut down after only 16 hours after posting a number of offensive tweets. On a blog post shared on Microsoft’s official website, Peter Lee, Corporate Vice President of Microsoft AI and Research apologised for the incident and noted “AI systems feed off of both positive and negative interactions with people” highlighting the importance of the underlying training data in creating a fair machine learning system (Lee, 2016).
Although providing rich information about human behaviour and collective con-sciousness, high granularity data retains several dangers. In particular, the metadata at-tached to these large datasets documenting human behaviour may contain sensitive infor-mation that raises concerns about privacy. Previous studies provided evidence that it is possible to uniquely identify the majority of the individuals in an anonymised dataset from mobility patterns (De Montjoye et al., 2013) and credit card metadata (De Montjoye et al., 2015). A whole body of research therefore has been formed to effectively anonymise data in order to protect the privacy of the data subjects (Cormode, 2011; Zhu et al., 2010) using various techniques such as differential privacy (Chen et al., 2011).
One final issue that needs attention is the data ownership. The majority of the digital traces we leave behind are being recorded by online platforms and technological devices we interact with. This raises a big ethical question about who the actual owner of the data is: the person who generates the data or the platform on which the data has been generated. Another issue that needs to be addressed carefully is automated systems. For instance, who is liable when an autonomous vehicle has an accident? In order to address these issues and more as well as to provide guidelines for the data controllers, General Data Protection Regulation (GDPR) in EU law has been introduced which also brought discussions. Numerous studies in the field of data ethics are therefore being conducted to discuss the advantages and limitations of the GDPR.
Wachter (2018) presented guidelines to protect data subjects’ identities and privacy by providing two example cases on how the regulations can be applied. Much discussion has been shaped around the GDPR’s focus on “right to explanation”, which involves data-driven automated decision making process being explained to the individuals. In their paper, Wachter et al. (2017) proposed three goals for automated decision making including the “right to explain” and discuss to which extent they are supported by the GDPR.
2.2
Image analysis and deep learning
As discussed in the previous section, large quantities of online data are being generated through daily interaction with everyday technological devices. In order to gain insights into everyday human behaviour, we need an automatic way to analyse these gigantic datasets
to extract meaningful information.
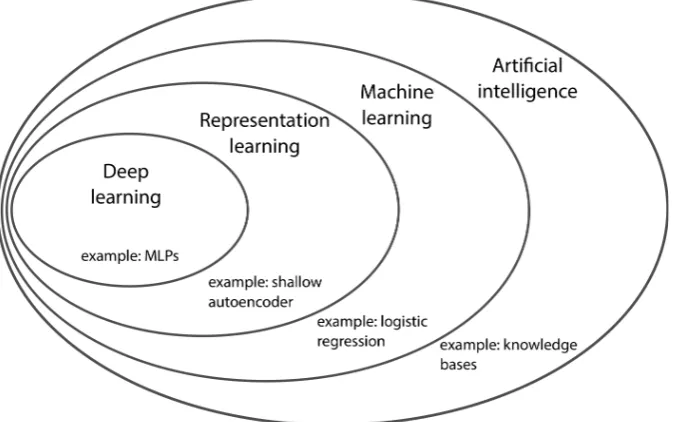
[image:29.595.154.491.249.460.2]Creating intelligent machines has been a dream for hundreds of years. A passion to build machines that can help with laborious work, understand commands or images, and assist scientists with their research has led to the creation of Artificial Intelligence (AI). AI, which is formed of a wide range of topics with rapidly increasing applications, is the general name for an intelligent software. Figure 2.4 depicts the relationship between different subfields of AI.
Figure 2.4: A Venn diagram illustrating the relationship between different subfields of AI. Each subfield contains an example application. The sketch is adapted from Goodfellow et al. (2016).
The early applications of AI involved hard-coding knowledge to the computers, which is not feasible for most cases. Researchers therefore came up with a set of methods that enable computers to extract their own knowledge from a given dataset. These group of methods are known as “machine learning algorithms”. Throughout this thesis, we will exploit various machine learning algorithms such as logistic regression and elastic net.
In machine learning algorithms, creating representations of the data is the key. These data representations, which are called features, enable the machine learning algo-rithm to identify similarities and differences across different categories. Traditionally, feature extraction involves careful hand-engineering of the features where domain expertise is a necessity. It is fair to say that the introduction of representation learning methods was a major breakthrough for the advancement of machine learning algorithms.
nature to new tasks with minimal human intervention. A number of representation learning approaches have been developed over the years including shallow autoencoders and re-stricted Boltzmann machines. Although these methods have proven to be useful in many cases, a main problem still remains: they cannot capture the unseen factors behind the features. In their book, Goodfellow et al. (2016) defined these factors as the “concepts or abstractions that help us make rich sense of the rich variability in the data”. There is however, a special set of representation learning algorithms that addresses this problem.
Deep learning is a type of representation learning used in both supervised and un-supervised learning problems. Deep learning architectures are composed of several layers that are trained to extract features using the output from the previous layer. Each layer is composed of simple modules called neurons that create multiple levels of representations and abstractions of the input data. These modules increase selectivity and invariance of representation aiming to capture the underlying complex patterns ingrained in the input data.
Like the other representation learning approaches, deep learning architectures take raw data as an input. The main difference however comes from how they identify features layer by layer in a hierarchical manner. As we move higher up in the deep architecture, each feature is defined through its relation to simpler features, identified in the preceding layers. For instance, let us assume we have a deep network trained to detect a particular object. Initial layers would identify simpler and more generic features such as edges followed by motifs whereas the latter layers will detect parts of the object and finally detect the main object.
There are various types of deep architectures exploiting different characteristics of the input data of different forms. A typical and probably the simplest example of such architectures is the feedforward neural network or multilayer perceptron (MLP). Due to their simple yet efficient way of learning complex non-linear mappings from the raw input data, previous studies have exploited MLPs to address a number of problems including speech recognition (Bourlard and Wellekens, 1989; Waibel et al., 1990) and face detection (Sung and Poggio, 1998), facial expression recognition (Zhang et al., 1998) as well as creating recommender systems (Alashkar et al., 2017; Huang et al., 2015).
MLPs also play a very crucial role as they form the basis of the most widely used deep learning applications. One example of these applications is natural language process-ing. In the last decade, many natural language processing applications exploit a special type of a deep architecture that uses MLPs as a “conceptual stepping stone” (Goodfellow et al., 2016): recurrent neural networks (RNNs) (Rumelhart et al., 1986). RNNs prove their success with a diverse range of problems such as speech recognition (Graves et al., 2013; Mikolov et al., 2010), time series prediction (Connor et al., 1994) and object and gesture tracking in videos (Ng et al., 2015) where the underlying dataset is of a sequential form.
Another field that immensely benefits from the perks of MLP is computer vision. Ballard and Brown (1982) defined computer vision as “the enterprise of automating and integrating a wide range of processes and representations used for vision perception”,
which is formed of a wide range of sub-fields such as video tracking, pose estimation, image processing and most importantly for our studies; image analysis.
Image analysis is the general name for a collection of methods aiming to extract meaningful information from 2D images generally by using machine learning and image processing techniques. Although comprehending photographic information might seem to be a trivial task for us humans, it has proved to be a challenging problem for computers. Benefiting from the hierarchical nature of the algorithms, deep learning methods achieve ground breaking performance in renowned image classification and object detection chal-lenges.
In addition to the new state-of-the-art algorithms, deep learning methods proposed decades ago such as convolutional neural networks are experiencing a resurgence of inter-est owing to improvements in the processing power of computers as well as the availability of extensive datasets for training, these deep architectures are outperforming image anal-ysis methods using traditional features such as Fisher Vectors (Chatfield et al., 2014) and SIFT features (Krizhevsky et al., 2012).
In the next section, we will have a closer look at the convolutional neural networks that we will be widely using throughout this thesis.
Figure 2.5: Structure of a regular neural network (left) versus convolutional neural network (right).
CNNs organise their neurons in a 3D structure where every layer transforms a 3D input to a 3D output. Here, on the right sketch, the red block represents the input image where width and heigh represents the size of the input image and depth is three due to three colour channels; red, green and blue. Figure taken fromhttps://cs231n.github.io/ convolutional-networks/.
2.2.1
Convolutional neural networks: an overview
In order to better illustrate the advantages of using CNNs, we first need to introduce their building blocks.
2.2.2
Building blocks of a CNN
2.2.2.1 Convolutional layer
The very first layer and one of the main building blocks of a CNN is the convolutional layer. Before explaining the details of this layer, we first need to describe what convolution is and in order to do so, we will use the example from Goodfellow et al. (2016).
Convolution is simply a mathematical operation on two functions. For example, imagine a noisy laser sensor providing the position of a vehicle,x(t), at timet. In order to reduce the effect of noise and get a better estimate of the current position of the vehicle, we can take the average of several measurements over different time t. However, we also need to give more emphasis on the recent measurements, which can be done by introducing a weight functionw(a)whereadenotes the recency of the measurement. We then calculate the weighted average of measurements at every moment which will give us a smooth estimate of the vehicle’s current position,s(t):
s(t) =
Z ∞
−∞
x(a)w(t−a)da. (2.1)
This operation is called convolution and is typically shown with an asterisk
(x∗w)(t). (2.2)
In CNN terminology,x is the input, w is referred to as the kernel or convolutional filter in image processing and the output is called the feature map.
Unlike the laser example, data on a computer is discrete. We therefore change the integral to summation, and the convolution operation becomes:
s(t) = (x∗w)(t) =
∞ X
a=−∞
x(a)w(t−a). (2.3)
Here, the input is a multidimensional array, for instance an image, and the kernel is a multidimensional array of parameters. In Figure 2.6, we depict a toy example of a 2D input array convolved with a filter, i.e. the filter is sliding over the input array to compute dot products. The size of the output is then determined by the size of the input, filter and stride with which we move the filter. For instance, considering this example, an input array of size 4×4convolved with a filter of size3×3with stride 1, will produce a2×2output. We can generalise this relationship as follows:
Sizeoutput=
(Sizeinput−Sizef ilter)
Sizestride
+ 1. (2.4)
Alternatively, in order to have a better control of the size of the output, we can
introduce zero-padding, which is an approach to add zeros around the borders of a matrix, to increase the size. By incorporating the size of padding, the general formula of the output size then changes to:
Sizeoutput=
(Sizeinput−Sizef ilter+ 2Sizepadding)
Sizestride
+ 1 (2.5)
In cases where we want to preserve the input size in the output, it is a common approach to have stride 1 with zero padding of(Sizef ilter−1)/2.
0 0 -1
-2 0 1
1 1 0
1 0 2 0
0 3 1 1
2 1 0 1
0 2 2 1
2 -4
-4 2
0 0 -1
-2 0 1
1 1 0
4x4 input data
3x3 convolutional
lter
2x2 output data
Figure 2.6: Toy example of a convolution operation.
A4×4input is convolved with a3×3filter where we compute the sum of dot products at each cell. We repeat the same operation at each position by moving the filter by one cell at a time (stride 1).
The convolutional layer as the name suggests consists of a set of three dimensional “convolution” filters that are learned from the input data. The forward-pass of this layer involves each filter to convolve across the input image. Each of these filters will produce a separate activation map, also called a feature map.
1 0 2 0
0 3 1 1
2 1 0 1
0 2 2 1
0.55
0.64
0 0 -1
-2 0 1
1 1 0
0.93
0 1 1
-2 0 1
2 1 0
0 0 2 0
4 1 1 3
2 2 0 1
1 0 0 2
4 0 1 1
2 0 1 3
3 2 0 1
1 0 0 0
16 9
6
*
1 0 -1
2 -1 1
0 1 0
*
*
[image:34.595.153.490.219.569.2]-1
+
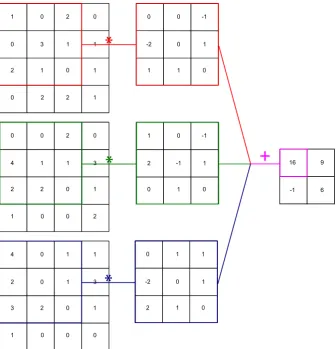
Figure 2.7: Creating the activation map of a 3D input.
We convolve three dimensional input data, which is also called an input volume with a filter of size3×3×3to generate an output volume of size2×2. The depth of the output volume is the same as the number of filters, for instance if we havek filters of size3×3×3, then the output volume would be of size2×2×k.
of magnitude smaller than the input size to reduce the number of parameters required in the architecture. For instance, standard neural nets such as MLPs, are fully connected meaning that in each layer, every input unit is directly connected to every output unit. This type of architecture does not scale well with large images causing long running times as well as increased storage needs to store the expanding number of parameters. However, by utilising local connectivity with filters of a size much smaller than the input, CNNs reduce the time and space required to train the network without a critical performance loss.
The other critical feature of the convolutional layer is parameter sharing. In contrast to fully connected architectures, which require learning every parameter shared between an input unit, such as a pixel in an image, and an output unit, CNNs enable sharing of the weights. Instead of learning weights of each connection at each location, they learn one set that will sweep over the entire input matrix. Considering the previous example, for a framework withk number of filters, for each unit in the convolutional layer output, the CNN will learn one set of weights. Hence, with a filter size of3×3×3, the network will need to learn3×3×3×kweights in total for the specified convolutional layer. This has no effect on the run time however it reduces the number of parameters greatly.
The final important advantage of incorporating convolution in a neural network structure is the equivariance in representations also referred to as translation invariance. If we move some pixels in an image to a different location, the convolution will still produce the same output but in a different location. This makes CNNs location invariant. However, this can’t be generalised to invariance in scale or rotation. This feature is useful especially when we want to identify similar patterns repeated across the image such as edges or certain objects.
These are the three core features that the convolution operation brings to neural networks. However, there are certain scenarios where special adjustments need to be made, such as images centred to human faces. In such cases, we need to learn different features in different areas of the face like eyes or mouth. Hence, it is useful to implement a slightly different version of a convolutional layer for instance by relaxing the shared weights restriction. Nevertheless, in general, by exploiting the advantage of the sparse connections via local connectivity, shared weights and equivariant representations, convolutional layers help to identify intricate relationships embedded in the underlying data, and are one of the core building blocks of a CNN architecture.
2.2.2.2 Non-linearity
simply picks the maximum between zero and a given value.
Previous studies suggest that compared to other non-linear functions used in a CNN setting, ReLU is better at finding the minima during training and is also better at bring-ing networks without unsupervised pretrainbring-ing to a similar level to networks with pretrainbring-ing (Glorot et al., 2011). Models with ReLU are also shown to be faster to train especially with a very large training set (Krizhevsky et al., 2012). Using ReLU also simplifies backpropa-gation as well as avoiding saturation issues.
2.2.2.3 Pooling
Another important element that forms the backbone of a CNN is the pooling layer. Running on an individual feature map, pooling combines nearby features into one with a chosen op-erator such as max-pooling, i.e. picking the maximum feature value given a set of features, or sum-pooling which involves summing all feature values that fall within the pooling frame. By creating a summary of nearby features, a pooling layer helps to create features that are robust to small changes in the input. A pooling layer also helps to avoid overfitting via gradually reducing the number of parameters as well as the computational time. It is also very useful for tackling input images of varying sizes. A pooling layer can create subsets of the same size that can then be transformed to classification layer; for instance regardless of the original dimensions, the pooling layer can create four sets of features by focusing on the quadrants of each image.
However, pooling layers are not universally popular. In Springenberg et al. (2014), the authors dropped their pooling layer and instead utilised larger strides in the convolu-tional layer in order to further reduce the input dimensions.
2.2.2.4 Normalisation
Normalisation is another building block of a CNN. Various types of normalisation over dif-ferent levels including feature map level or image level have been proposed however, to the minimal improvement the layer brings to the CNN’s performance, normalisation has mostly been abandoned.
2.2.2.5 Combining layers
Convolutional, non-linear and pooling layers, in some cases with normalisation layer are the main building blocks of a CNN architecture. In practice, different architectures are created by stacking several layers composed of a combination of these building blocks before adding the final fully-connected and classification layers.
2.2.3
Training and knowledge transfer
Once we create the network architecture, the next step is to train the network, i.e. to learn the parameters. Like most of the other deep learning architectures, CNNs are also trained
using supervised learning. Let us take a classification problem as an example. The training process includes passing an image to a network as the input, for which the architecture will then generate a set of scores representing the likelihood that the image belongs to each of a set of categories. The image will then be grouped under the category with the highest score. In order to determine whether the image is classified into the right category, we compute an objective function, also referred to as the loss function, which is the distance between the actual set of scores and scores calculated by the network. Taking the objective function into account, the network will then make necessary adjustments to its parameters aiming to minimise the error between the actual and generated output scores.
To correctly adjust the parameters, for each weight the learning framework will cre-ate a gradient vector that measures the amount of change in the error when there is a slight change in the weight. The weight vector will then be updated in the opposite direction of this gradient vector. In LeCun et al. (2015), the authors portrayed the objective function generated by the mean objective values calculated for each training instance as a “hilly landscape in the high-dimensional space of weight values” where the negative gradient vector will take the objective value close to minimum.
One of the most common methods utilised in calculating gradient vectors is Stochas-tic Gradient Descent (SGD). Using a small subset of the training data, the SGD algorithm computes the output and errors that will later be used to update the weights of the network. This process will then be repeated for a number of small sets created from the initial training set until the algorithm converges, i.e. the error becomes very small.
Despite its simplicity, the performance of the SGD is competitive with more intricate optimisation algorithms (Bottou and Bousquet, 2008). SGD’s capability of calculating a good set of weights considerably quickly has made it one of the most preferred approaches among practitioners.
If the neurons use fairly smooth activation functions, which have continuous deriva-tives, then the gradients of an objective function can be computed with a method called backpropagation. Drawing on the chain rule for derivatives, the main idea behind the back-propagation method is as follows: for a given neuron the derivative of an objective with respect to the input can be computed from the gradient of the objective with respect to the output of the neuron. It is calculated for every neuron within a layer and applied over and over again to pass the gradients through all layers, as the name suggests working its way backwards from output to the input layer. With a series of forward and backwards passes, the weights of CNN including filters can then be trained using a gradient-based method utilising backpropagation.