warwick.ac.uk/lib-publications
Original citation:
Yuan, Hu, Maple, Carsten and Ghirardello, Kevin (2018) Dynamic route selection for vehicular
store-carry-forward networks and misbehaviour vehicles analysis. In: 2018 IEEE 88th
Vehicular Technology Conference: VTC2018-Fall, Chicago, USA, 27–30 Aug 2018
Permanent WRAP URL:
http://wrap.warwick.ac.uk/104378
Copyright and reuse:
The Warwick Research Archive Portal (WRAP) makes this work by researchers of the
University of Warwick available open access under the following conditions. Copyright ©
and all moral rights to the version of the paper presented here belong to the individual
author(s) and/or other copyright owners. To the extent reasonable and practicable the
material made available in WRAP has been checked for eligibility before being made
available.
Copies of full items can be used for personal research or study, educational, or not-for profit
purposes without prior permission or charge. Provided that the authors, title and full
bibliographic details are credited, a hyperlink and/or URL is given for the original metadata
page and the content is not changed in any way.
Publisher’s statement:
“© 2018 IEEE. Personal use of this material is permitted. Permission from IEEE must be
obtained for all other uses, in any current or future media, including reprinting
/republishing this material for advertising or promotional purposes, creating new collective
works, for resale or redistribution to servers or lists, or reuse of any copyrighted component
of this work in other works.”
A note on versions:
The version presented here may differ from the published version or, version of record, if
you wish to cite this item you are advised to consult the publisher’s version. Please see the
‘permanent WRAP URL’ above for details on accessing the published version and note that
access may require a subscription.
Dynamic Route Selection for Vehicular
Store-Carry-Forward Networks and Misbehaviour
Vehicles Analysis
Hu Yuan, Carsten Maple and Kevin Ghirardello
Cyber Security Centre, WMG, University of Warwick, Coventry, CV4 7AL, United Kingdom
Email:
{
h.yuan.4, cm and k.ghirardello.1
}
@warwick.ac.uk
Abstract—In this paper, we present realistic urban simula-tion results for store-carry-forward (SCF) relay communicasimula-tions within a cellular network. We describe two dynamic routing algorithms, minimising outage and minimising data packet travel time, which feature enhancements to increase the routing flexi-bility. It is shown that these enhancements to increase flexibility in re-routing the data leads to a dramatic decrease in the outage probability while only increasing packet travel time slightly. A misbehaviour model is analysed in this paper, in which misbehaving vehicles fail to follow the rules of the SCF routing algorithms. There are various reasons for a rogue vehicle to fail to obey the routing algorithm, including an intention to modify the message before onward transmission. Misbehaviour is detected by considering expected traffic density distributions. A Hidden Markov Model (HMM) is used to detect misbehaviour based on how data is passed by vehicles. Results show that the probability that misbehaviour is detected is 87% using this approach.
I. INTRODUCTION
A. Store-carry-forward Networks
In recent years store-carry-forward (SCF) relaying has received attention for its potential to deliver extra cellular capacity for delay tolerant data delivery [1], [2]. The principle idea is to transmit data close to the intended destination by physically carrying the data packets across the majority of the original transmission distance. It has been shown that it can lead to greater energy efficiency for transmission [3]. What has been lacking however, is the design of route selection algorithms that are optimised and efficient for application in large scale urban simulations, using real vehicular traffic, to examine performance trade-offs. In this paper, we model the city of Boston with the deployment of a 3GPP Long Term Evolution (LTE) system with an underlying SCF system to analyse different routing algorithms.
B. Misbehaviour Detection Process
Unfortunately, the inherent nature of SCF relaying networks inevitably exposes its users to a number of privacy issues, both common to regular Intelligent Transportation Systems and particular to the considered technology. Since messages are physically transported by each node that composes such vehicular SCF Networks, it is possible for a driver with access to their own on-board storage unit to not only infer the source of each message (therefore revealing the identity of the sender)
and the location from which it originated to a certain level of accuracy [4], but could also access the contents of the transported data packets. As such, potential adversarial drivers wishing to collect large amounts of sensitive information could randomly drive their vehicle within a certain area in an effort to increase the number of times their particular vehicle partakes in the SCF process.
The second part of this paper consequently proposes a novel node-centric Misbehavior Detection Technique which uses HMM and data on each driver route selection to detect any kind of abnormal driving behaviour that is deviant from the behavior expected of a normal, well-behaved vehicle. Various Misbehaviour Detection techniques have been proposed for vehicular ad hoc networks and vehicle-to-everything appli-cations, with notable examples including methodologies that consider the type of data transmitted among nodes [5], [6] or the volume of messages created, dropped or duplicated by a single node [7], [8]. However to the best knowledge of the authors, none consider the driver’s route selection, nor are they optimized for SCF relaying network, as it has been noted that privacy solutions for normal ad hoc networks do not perform particularly well in [9].
C. Contribution and Organisation
In this paper we present the technical details regarding:(1) the routing selection based on the requirements (minimum outage and minimum package travel time), (2) the detection method of the hidden misbehaviour. The rest of paper is organized as fellows. In Section II the system model is defined, in Section III the route selection algorithms are presented, in Section IV the misbehavior detection model is explained, in Section V are the numerical results and analysis and conclusions in Section VI.
II. EXPERIMENTSETUP
A. Cellular Architecture
7.66 7.68 7.7 7.72 7.74 7.76 7.78
105 2.952
2.954
2.956
2.958
2.96
[image:3.612.48.306.53.223.2]2.962 106
Fig. 1. Roads classification in Boston city centre.
noncooperative SCF relays attached to vehicles, either public or private. The SCF DF relays operate on the uplink channel and behave in the following manner: (1) Receive data and store it in buffer; (2) Transmit the data to another relay or BSs when certain conditions are met. The specific conditions are discussed in detail below.
B. Vehicular Traffic Model
The urban environment used in this study is a 1.8 km × 1.2 km section of the city of Boston, USA. It presents six different road classification categories, as shown in Fig. 1. Each different category relates to different vehicle traffic intensities and maximum vehicular speed limits. For example, the magenta road is a residential (class 5) road with vehicular traffic intensityφi= 2.3per minute per unit distance at peak time, with a maximum speed limit of υMax
i = 48 km/h. We define the road set asN={1, ...,f}, where the average speed of vehicles on the road i∈ [1,f] is set as a function of the maximum speed, e.g., υi = A(viMax), where A is the speed factor in this study. The overall number of vehicles nlocated along a road is modelled as Poisson distributed [11], with a probability density function:
pi(n) =e−l/φi (l/φ
i)n
n!
, (1)
where l is the road length in meters and nis the number of the vehicles.
Furthermore, the vehicular traffic data used for this study represents over 10 years (2007-2017) of Boston traffic infor-mation from both private and public vehicles.1.
C. Performance Metrics
An outage occurs if the vehicle fails to find a relay at a hand over junction within the vehicle maximum communication range. As such, the probability that an outage occurs at the
k-th hop on road i can be defined as the probability that
1http://mhd.ms2soft.com/tcds/tsearch.asp?loc=Mhd&mod=
Source
Destination
Junction 1
𝑃11, 𝑇11
𝑃13, 𝑇13
𝑃12, 𝑇12 Junction 2
Junction 3
Junction 4
[image:3.612.309.565.62.208.2]Mini Outage Travel time
Fig. 2. The route selection algorithm: Min. outage and min. travel time.
no vehicles are present within the communication range d.
d is furthermore defined as d = PVλ/σ2ζ− 1
α and PV is
represented the radio transmission power of vehicles, λ is the frequency dependent pathloss constant, αis the pathloss distance exponent, ζ is the required minimum signal-noise-ratio (SNR) andσ2 is the additive white Gaussian noise. The
resulting probability is defined as
P[D > d] =P[no vehicle closer thand] =e−d/φi, (2)
Therefore, the cumulative distribution function (CDF) of at least one vehicle in the certain communication range d is
FD(d) = 1−e−l/φi and, consequently,the probability density function (pdf) can be found as
fD(l) =
dFD(d) dd =
e−φid φi
, (3)
Therefore, the probability of incurring an outage during any point within the whole SCF transmission is defined as:
Poutage= 1−
T Y
i=1
1−
e−φid φi
. (4)
whereT is the total number of hops.
The travel time is defined as the data packages total travel time from source to destination, and is approximated by the following equation:
T=
T X
i=1 l∗i AvMax
i
(5)
wherel∗i is the length of the portion of roadithrough which the data package has travelled. It should be noted that it does not consider the time needed to process such data, as it is negligible compared to a vehicle’s travel time, and the time spent waiting at traffic lights.
III. ROUTESELECTIONALGORITHMS
in-cludes the destination of the data package and the utilized route selection algorithm. For this particular study two different routing algorithms were considered: minimum time delay and minimum transmission outage, as illustrated in Fig. 2. Both algorithms use the Dijkstra algorithm to select the optimal routing path [12] based on the chosen performance metric. Assuming that all vehicles have information regarding the citys road map, traffic intensity and average traffic velocity and that the destination of a data package is fixed, the SCF relaying process can therefore be specified as follows:
A. Minimum Outage and Travel time Routing
1) The source UE passes the data to the closest vehicle, then the first vehicle calculate the outage probability from Eq.(4) or the travel time from Eq.(5) for each possible route at the first junction.
2) use Dijkstraalgorithm to choose routing paths that can achieve the minimum outage probability or minimum total travel time.
3) transfer the information data to the relay vehicle, the relay vehicle store it and transfer to next relay vehicle until the packet reaches the destination.
Because this communication process can potentially incur an outages, which would lead to the message not reaching its destination, a persistent version of the considered SCF process is explained in next subsection to ensure that each message is delivered correctly.
B. Persist Modification
This modification is applicable to both the original mini-mum outage and minimini-mum travel time algorithms.
1) when the relay vehicle cannot find the next relay vehicle, it continues on its current route and sets itself as a new source for re-calculation.
2) UseDijkstraalgorithm to choose routing paths that can get the desired performance (minimum travel time or outage).
3) transfer the information data to the relay vehicle, the relay vehicle store it and transfer to next relay vehicle until the packet reaches the destination.
The entirety of the above described process is captured by the following algorithm. This re-calculation is computationally taxing and we explore in the results for 1, 2, and 3 re-calculations. The number of re-calculation times is defined as persist factor.
IV. SELF-DETECTIONMODEL
This section describes the dynamic Markov model used to detect misbehaving vehicles which seek to collect high volumes of data through the SCF relaying process. This analysis is based on the assumption that an individual vehicle does not travel randomly, but rather follows a specific direction which has a starting point and a destination. Therefore, a vehicle is considered misbehaving if it follows a non-standard way of driving, turning at intersections into roads that have a low probability of being traversed.
Algorithm 1 Routing selection
function RELAYING(φi,vMax
i ,A,r,T,l∗i,[x, y])
The Source UE signals the SCF request with destination information[x, y]
Candidates relays replay the acknowledgement with distance to the destinationD1= [d1, d2, ..., di].
The first relayz1 is selected with minD1
if z1 is not the destination UEthen z1 signals the request with[x, y]
if The number of acknowledged candidates i 6= 0 then
Set the relay numberT = 2 fori6= 0 do
ifMin outagethen
Call Eq.(4){φi, r} →Poutagei ;
minPi
outage
elseMin travel time Call Eq.(5){l∗i, A, vMax
i } →Ti; minTi
Pass the information;
Record the routing information; ifThe destination is reachedthen
Break
T =T+ 1
Poutage= 1−
QT i=1P
i
outage,T=
PT i=1T
i else
Break
The considered Hidden Markov Model uses a set of non-visible states (X1, X2, ..., Xn) which determine whether any vehicle is misbehaving or not, while the visible states (Z1, Z2, ..., Zn) represent the roads selec-tion at each juncselec-tion during the entire SCF relaying pro-cess. Their associated conditional probabilities are: [13],
P Zi|Zi−1,Xi−1,Zi−2, ...,Z1,X1
= P Zi|Zi−1, and P Xi|Z,X,Zi−1,Xi−1, ...,Z1,X1
=P Xi|Z
The problem can thus be modeled as a Hidden Markov Model, with a transition probability matrixAfor the observed states andB for the unobserved states.
A=
P1,1 P1,2 ... P1,n
P2,1 P2,2 ... P2,n
... ... ... ...
Pm,1 Pm,2 ... Pm,n
(6)
wherePi,j is the probability that from junction i the vehicle will next visit junctionj. Similarly, Bis specified as
B=
P10,1 P10,2 ... P10,n P20,1 P20,2 ... P20,n
... ... ... ...
Pm,0 1 Pm,0 2 ... Pm,n0
(7)
Let set a hidden status ofωr=
ω1
O1:T of is
P
O1:T|ωr
= T Y
t=1
P o(t)|ωr
, (8)
whereO1:T is the observed status andT is the total number of the route selections. This is the product of the hidden status probability.
P
V1:T|ωr
= T Y
t=1
P o(t)|ωr
= T Y
t=1
Pω0(t)o(t), (9)
where Pω0(t)o(t) is the probability of the hidden probability under the hidden status condition.
The whole set of the possible hidden status is Ω, so the expectation probability of the observed status O1:T is
P
V1:T=X r∈Ω
PV1:T|ωr
P(ωr),
=X
r∈Ω
PV1:T|ωr
Pnω1r, ω2r, ..., ωrTo
(10)
then,
P
V1:T=X r∈Ω
PV1:T|ωr YT
t=1
P ωt|ωt−1
=X
r∈Ω
T Y
t=1
P o(t)|ωrP ωr(t))|ωr(t−1)
=X
r∈Ω
T Y
t=1 Pω0
r(t)o(t)Pωr(t)ωr(t−1).
(11)
By recursing the Eq. (11), the expectation observed status probability is
P
O1:T= X ω(T)
PV1:T, ω(T)
= X
ω(T)
PO1:T−1, OT, ω(T)
= X
ω(T)
POT|O1:T−1, ω(T)PO1:T−1, ω(T),
(12)
from the conditions theOT andO1:T−1 are independent, so
P
O1:T= X ω(T)
PO1:T, ω(T)
= X
ω(T)
POT|ω(T) X ω(T−1)
P ω(T)|ω(T−1)
×PO1:T−1, ω(T−1).
(13)
where
P
V1:T, ω(T)=Pω0(T)OT
X
ω(T−1)
Pω(T−1)ω(T)
×PO1:T−1ω(T−1),
(14)
1 1.5 2 2.5 3 3.5 4 4.5
Vehicle Intensity Ratio
0.1 0.15 0.2 0.25 0.3 0.35 0.4 Outage Probability
Original Minimum Outage Algorithm Persist Factor 1
[image:5.612.323.549.50.175.2]Persist Factor 2 Persist Factor 3
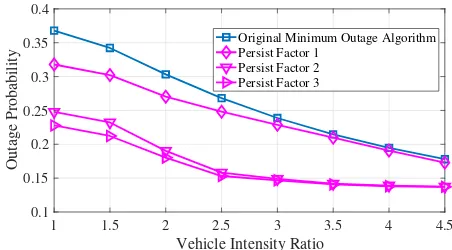
Fig. 3. Outage Probability vs. Vehicle Intensity
set as
ϕj =P
O1:T, ω(t) =j
=PjO0 T
N X
i
Pi,jϕi(t−1)
.
(15)
After the data package reaches its destination, the Hidden Markov Model can calculate the observed status probability of each relay selection and compare it with the route selection probabilities of the considered routing algorithm. The misbe-haviour detection process is shown in Algorithm 2.
Algorithm 2 Misbehaviour Detection function DETECTION(ωr,T,P0
i,j,Pi,j)
When the data reached, check the recorded routing information getωr
fori=1:1:Tdo
Calculate probability P O1:T
from Eq.(10),Eq.(14),Eq.(15)
if(P O1:imatchedthen
i is a normal UE
else
i is a misbehaviour
V. NUMERICALRESULTS ANDANALYSIS
In this paper, the simulation area is 1.8 km × 1.2 km in the city of Boston, transmission power PV is 31 w, pathloss
200 400 600 800 1000 1200 1400 1600 1800
The distance between Source and destination (m)
0 200 400 600 800 1000 1200
Data travel time (s) Persist Factor 3
[image:6.612.329.550.52.177.2]Persist Factor 1 Persist Factor 2
Fig. 4. Packet Travel Time vs. Total Transmission Distance
The results in Fig. 3 show that the outage probability can be feasibly reduced to below 15% provided that sufficient re-calculation times are permitted (persistence factor ≥ 2),and that the vehicle intensity is 3 times greater than standard values. It is furthermore interesting that at higher values of vehicle intensities, the persist modified algorithm performs similarly to the original algorithm. Fig. 4 presents the rates at which data package travel time increases as the distance between the source and the destination increases for each of the three persist modified algorithms. It is evident that the algorithms that allow a higher number of route re-calculations (persistence factor) incur a higher rate of time delay increase, indicating that there is a fundamental trade-off between data package delivery times and lower outage probabilities.
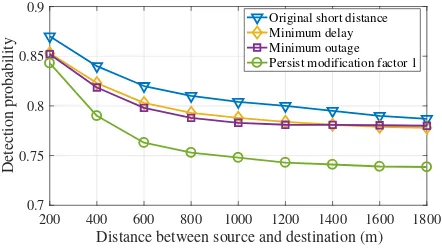
Fig. 5 presents the effectiveness of the misbehaviour de-tection model with SCF processes using the minimum time delay, minimum outage probability, original short distance and Persist Factor 1 algorithms. The probability of detecting misbehaving vehicles is especially high for short distance routes, reaching 87% with the original short distance algo-rithm. However, such probabilities decrease as the distance between source and destination increases. In fact, the detection probabilities for the minimum delay, minimum outage and persistence factor 1 algorithms decrease to 78.5%, 77.9% and 74%, respectively, at distances of 1800 m.
VI. CONCLUSIONS
In this paper, we present realistic results for store-carry-forward (SCF) relay communications within a cellular network in urban Boston. As baseline, minimum outage and minimum packet delay algorithms are presented, which are enhanced to increase the routing flexibility. It was found that increased spatial flexibility in re-routing the data will decrease outage probability dramatically, but cause a high packet delay time. The trade-off and its theoretical bounds deserves further ex-ploration.
Depending on the relaying route selection, the observed SCF route selection for each data package sent is compared with the expected route selection at each junction to determine whether vehicles are misbehaving. The results show a high probability of successful misbehaviour detection for each of the different routing algorithms.
200 400 600 800 1000 1200 1400 1600 1800
Distance between source and destination (m)
0.7 0.75 0.8 0.85 0.9
Detection probability
Original short distance Minimum delay Minimum outage Persist modification factor 1
Fig. 5. misbehaviour detection probability vs. Total Transmission Distance
ACKNOWLEDGMENT
This work was supported in part by the EPSRC project PETRAS Internet of Things Research Hub under Grant EP/N02298X/1.
REFERENCES
[1] Y. Zhou, N. Cheng, N. Lu, and X. S. Shen, “Multi-UAV-aided networks: aerial-ground cooperative vehicular networking architecture,”IEEE
ve-hicular technology magazine, vol. 10, no. 4, pp. 36–44, 2015.
[2] Y. Wang, Y. Liu, J. Zhang, H. Ye, and Z. Tan, “Cooperative store–carry– forward scheme for intermittently connected vehicular networks,”IEEE
Transactions on Vehicular Technology, vol. 66, no. 1, pp. 777–784, 2017.
[3] P. Kolios, V. Friderikos, and K. Papadaki, “Energy efficient relaying via store-carry and forward within the cell,” inIEEE Transactions on Mobile
Computing, vol. 13, no. 1, Nov. 2012, pp. 202–215.
[4] C. P. A. Ogah, H. Cruickshank, Z. Sun, G. Chandrasekaran, Y. Cao, P. M. Asuquo, and M. Al Tawqi, “Privacy-enhanced group communication for vehicular delay tolerant networks,” inIEEE 9th International Conference
on Next Generation Mobile Applications, Services and Technologies,
Cambridge, 2015, pp. 193–198.
[5] S. Ruj, M. A. Cavenaghi, Z. Huang, A. Nayak, and I. Stojmenovic, “On data-centric misbehavior detection in vanets,” in IEEE Vehicular
technology conference (VTC Fall), San Francisco, 2011, pp. 1–5.
[6] D. Huang, S. A. Williams, and S. Shere, “Cheater detection in vehicular networks,” in IEEE 11th International Conference on Trust, Security
and Privacy in Computing and Communications (TrustCom), Liverpool,
2012, pp. 193–200.
[7] O. A. Wahab, H. Otrok, and A. Mourad, “A cooperative watchdog model based on dempster–shafer for detecting misbehaving vehicles,”
Computer Communications, vol. 41, pp. 43–54, 2014.
[8] A. Daeinabi and A. G. Rahbar, “Detection of malicious vehicles (dmv) through monitoring in vehicular ad-hoc networks,”Multimedia tools and
applications, vol. 66, no. 2, pp. 325–338, 2013.
[9] P. R. Pereira, A. Casaca, J. J. Rodrigues, V. N. Soares, J. Triay, and C. Cervell´o-Pastor, “From tolerant networks to vehicular delay-tolerant networks,”IEEE Communications Surveys & Tutorials, vol. 14, no. 4, pp. 1166–1182, 2012.
[10] C. Campolo, A. Molinaro, A. Iera, and F. Menichella, “5g network slic-ing for vehicle-to-everythslic-ing services,”IEEE Wireless Communications, vol. 24, no. 6, pp. 38–45, 2017.
[11] S.-I. Sou and Y. Lee, “End-to-end performance for SCF-based vehicular routing over multiple communication gaps,” in IEEE Communication
Letters, vol. 18, no. 6, Jun. 2014, pp. 1015–1018.
[12] S. Skiena, “Dijkstras algorithm,”Implementing Discrete Mathematics: Combinatorics and Graph Theory with Mathematica, Reading, MA:
Addison-Wesley, pp. 225–227, 1990.
[image:6.612.66.288.52.172.2]