Abstract—This paper studies the modified sensitivity analysis
applied into an elastic-plastic finite element analysis of a 3D blank design in sheet metal forming. Originally the sensitivity method has successfully been applied to several arbitrary shapes. In the present paper the sensitivity coefficients are not considered constant during the analysis. The presented approach computes the new coefficients from the two last iterations. This method can produce an initial blank boundary shape that has any arbitrary flange shape. A cup with uniform flange has been studied in detail and results show a faster solution convergence than the published sensitivity method. Experimental tests were conducted to compare with the numerical simulations. The optimum blank shape obtained from the numerical simulations was used during the experimental trials. The results of experimental tests for both square and optimum blank are presented here.
Index Terms— Finite element method, modified sensitivity
analysis, optimum blank, sheet metal forming.
I. INTRODUCTION
The numerical simulations of the stamping process are used extensively for the analysis and design of industrial parts to avoid long and expensive experimental try-out procedures [1-3]. Together with non-linearity of materials, the other important factors such as the unsteady nature of the process, large plastic deformation involved, and the complexity of contact and frictional effects make the study of stamping process very complicated. Sheet metal analysis justifies the use of sophisticated numerical algorithm and usually leads to large scale computer requirements [4].
Optimum blank design technology is required for net-shape cold forming using thin sheet-metals. The net-shape means that the trimming process is eliminated completely in the forming process. Therefore the optimum blank is referred to an initial blank shape to produce a desired shape which includes uniform flange around the part. The design of the initial blanks has used various methods such as the slip-line method [5], the geometric
Manuscript received April 9, 2007. This work was supported by Amirkabir University of Technology.
F. R. Biglari is associate professor in mechanical engineering at Amirkabir University of Technology, Hafez Avenue, Tehran, Iran. (corresponding author’s phone: 00982166405844; e-mail: biglari@ aut.ac.ir).
M. Dariani is associate professor in mechanical engineering at Amirkabir University of Technology, Hafez Avenue, Tehran, Iran. (e-mail: dariani@ aut.ac.ir).
K. Nikbin is professor of mechanical engineering at Imperial College London, Exhibition road, London. (e-mail: [email protected]).
mapping [6, 7], the trial and error method based on the FE simulations [8, 9], inverse method [10] which uses FE analysis for the direct prediction of the blank shapes and the strain distributions in the desired final shape, the backward tracing method [11] in which the key concept is to trace plastic deformation in backward direction from final desirable configuration to initial blank shape and intermediate deformed shapes.
In this study a modification for initial blank design in sheet forming has been developed and proven in its effectiveness by the application of square cup stamping process. In the blank design of square cup stamping, the modified sensitivity program can produce a net-shape cup with straight edges with lower iterations.
Finally the deformation with optimum blank is analyzed and its effects on thickness change (thinning distribution) and punch force are investigated.
II. BASIS FOR THE FINITE ELEMENT METHOD
The variational formulation approach is based on one of two variatonal principles. It requires that among admissible velocities,
u
i, that satisfy the conditions of compatibility and incompressibility, as well as the velocity boundary conditions, the actual solution gives the following functional a stationary value:∫
∫
−
=
Π
SF i i V
ds
u
F
dv
ε
σ
&
(1)where
σ
is the effective stress expressed as(
)
′ ′
= 12
2 3
ij
ij
σ
σ
σ
(2)and
ε
&
is the effective strain rate defined as(
)
=
123
2
ij
ij
ε
ε
ε
&
&
&
(3)In equation 1,
F
i represents surface traction,u
i are velocity components,σ
ij′
is the deviatoric stress tensor andε
&
ij is theComparison of Optimum and Square Blanks
Using the Sensitivity Approach
strain rate tensor component.
In sheet metal forming, under the plane stress conditions the Lagrange multiplier
λ
, is not necessary [12] therefore, the variational formulation becomes:0
=
−
=
Π
∫
∫
SF i i V
ds
u
F
dv
δ
ε
δ
σ
δ
&
(4)III. THEORETICAL BACKGROUND OF THE SENSITIVITY METHOD
During blank deformation in the deep drawing process, boundary nodes move along the nonlinear deformation path. Therefore the final moving direction is different from the initial direction. The desired shape after forming is obtained when every boundary nodes coincide with target contour at the end of the process. It must be noted that the target shape is a box with a 144*144 millimeter square flange. Table 1 shows the material property for the sheet metal used. In order to make nodes lie on the target contour, the initial position of the nodes should be changed, according to the amount of shape error [13].
Consider X represent a position vector of a material point located at the boundary of an initial blank before deformation and x represent a position vector of the material after final deformation.
Table 1 : ST12 material property
General property:
7800 / 2 ( ) Density m
Kg
= ρ
Mechanical properties:
) (
140
) ' (
31 . 0
) '
( 208
0
stress yield initial MPa
ratio s poisson
Modolus s
Young GPa E
y=
= =
σ υ
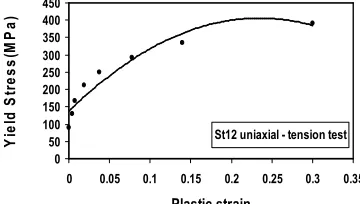
[image:2.595.364.498.114.240.2]With the initial blank defined by X, the deformation process is analyzed by ABAQUS/Explicit. In the first step of optimization, the deformation of a rectangular blank of 103 mm with, 103 mm length, and 1mm thickness from ST12 material is simulated. The computational conditions for the simulations are as Ku et al [4] reported. The friction coefficient is considered equal to 0.12 between the blank surface and forming tools. The material property of ST12 sheet material is shown in Table1. Fig. 1 shows the uniaxial tension curve used for plastic behavior definition.
St12 uniaxial - tension test
0 50 100 150 200 250 300 350 400 450
0 0.05 0.1 0.15 0.2 0.25 0.3 0.35
Plastic strain
Y
ie
ld
S
tr
e
s
s
(M
P
a
)
Fig.1: St 12 uniaxial tension curve
The result of first simulation is presented in Fig. 2. Because of part’s symmetrical geometry, only ¼ of the blank is modeled.
Fig.2: The result of initial square blank deformation. If x doesn’t lie on the target contour xT, as shown in Fig 3, the
[image:2.595.351.513.341.432.2]position of the material point before deformation X should be modified in order to make the deformed contour coincide with the target. In this method the shape of initial blank can be changed by the use of a shape sensitivity known as S.
Fig. 3: Schematic of blank deformation
The shape sensitivity is derived numerically by the original and the offset blank. The offset blank shape
(
X
δ)
determined from the result of FE analysis which has taken the initial blank as starting point [13]:N
X
X
δ=
+
δ
.
(5) [image:2.595.365.484.595.728.2]where N is the unit vector in the moving direction at the first increment and δ is amount of offset. Fig 4 shows the offset blank obtained when δ is considered as 2 mm.
Fig. 4: offset blank
[image:2.595.85.265.634.736.2]position of boundary nodes after deformation for the offset blank. Then the shape sensitivity for the deformation at each node is defined as:
x
x
X
X
S
−
−
=
δ δ (6)Unless x lies on the target contour, the corresponding initial position should be moved by
( ) ( )
N
S
X
X
i i.
1−
ε
=
−(7) where
ε
is the shape error, defined as the difference between xTand x. Superscript (i) refers to the number of iterations. After the first modification of the blank shape the deformation process is analyzed again and the contour of deformed blank is extracted. Fig. 5 shows the first blank modification and its deformed shape respectively.
(a) (b)
Fig.5: First blank modification: (a) blank shape; (b) deformed shape
[image:3.595.327.528.134.276.2] [image:3.595.77.264.335.438.2]The blank shape is repeatedly modified when the shape error at boundary nodes is grater than maximum allowable error (1mm in this study). In order to modify the blank for the second time, the new sensitivity coefficients are required. In despite of the research carried out by Shim et al [13], the sensitivity coefficients are changed in the second modification. Variation of sensitivity coefficients for top edge nodes are illustrated in Fig. 6.
Sensitiv ity coefficients for the top edge
0 0.5 1 1.5 2 2.5 1 1 9 1 1 1 9 2 1 1 9 3 1 1 9 4 1 1 9 5 1 1 9 6 1 1 9 7 1 1 9 8 1 1 9 9 1 2 0 0 1 2 0 1 1 2 0 2 1 2 0 3 1 2 0 4 1 2 0 5 1 2 0 6 1 2 0 7 1 2 0 8 1 2 0 9 1 2 1 0 1 2 1 1 1 2 1 2 1 2 1 3 1 2 1 4 1 2 1 5 1 2 1 6 1 2 1 7 1 2 1 8 1 2 1 9 1 2 2 0 1 2 2 1 1 2 2 2 1 2 2 3 1 2 2 4 1 2 2 5 node label Sx_first modification Sx_second modification
Sensitiv ity coefficients for the top edge
[image:3.595.355.503.384.533.2]0 0.2 0.4 0.6 0.8 1 1.2 1 1 9 1 1 1 9 2 1 1 9 3 1 1 9 4 1 1 9 5 1 1 9 6 1 1 9 7 1 1 9 8 1 1 9 9 1 2 0 0 1 2 0 1 1 2 0 2 1 2 0 3 1 2 0 4 1 2 0 5 1 2 0 6 1 2 0 7 1 2 0 8 1 2 0 9 1 2 1 0 1 2 1 1 1 2 1 2 1 2 1 3 1 2 1 4 1 2 1 5 1 2 1 6 1 2 1 7 1 2 1 8 1 2 1 9 1 2 2 0 1 2 2 1 1 2 2 2 1 2 2 3 1 2 2 4 1 2 2 5 node label Sy_first modification Sy_Second modification
Fig. 6: variation of sensitivity coefficients: (up) X component (Sx); (down) Y component (Sy)
According to the new sensitivity coefficients, blank boundary is modified and its deformation is simulated. Fig. 7 represents the modified and deformed blank respectively.
(a) (b) Fig.7: Results of second modification: (a) Optimal blank ;(b) deformed blank
IV. RESULTS AND DISCUSSIONS
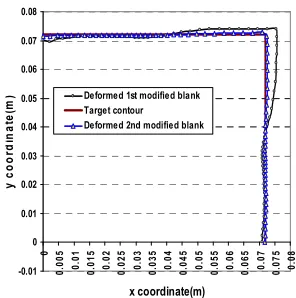
Fig. 8 shows the comparison between the flange contours in different steps of optimization. For the optimum blank determined by the second modification, the flange contour after deformation coincides with the target contour.
-0.01 0 0.01 0.02 0.03 0.04 0.05 0.06 0.07 0.08 0 0 .0 0 5 0 .0 1 0 .0 1 5 0 .0 2 0 .0 2 5 0 .0 3 0 .0 3 5 0 .0 4 0 .0 4 5 0 .0 5 0 .0 5 5 0 .0 6 0 .0 6 5 0 .0 7 0 .0 7 5 0 .0 8 x coordinate(m) y c o o rd in a te (m
) Deformed 1st modified blank Target contour Deformed 2nd modified blank
Fig. 8: The comparison between deformed contours Shape error distribution in the right edge of the blank is shown in Fig. 9. In the second modification, shape error values are less than 1 mm that is highly acceptable in this study.
-0.002 -0.001 0 0.001 0.002 0.003 0.004 0.005
0 5 10 15 20 25 30 35 40
Node Label (Right edge)
[image:3.595.64.269.575.734.2]s h a p e e rr o r( m ) Second modification_Error First modification_error
[image:3.595.338.497.605.719.2]The main purpose of the optimum blank is minimizing material consumption in deep drawing process. However this kind of blank optimization has some effects on forming parameters as well. In this paper, two most important parameters are investigated by the use of this optimum blank.
[image:4.595.345.496.89.208.2]The first parameter is deformation force (The force that punch applies to the sheet metal and deforms it successfully). Fig. 10 shows deformation force for two different initial blank (square blank and optimum blank) in the deep drawing process.
0 20000 40000 60000 80000 100000 120000
0 10 20 30 40 50 60
Time (s)
F
o
rc
e
(N
)
[image:4.595.58.241.206.316.2]Optimum First Blank
Fig. 10: Deformation force for two different initial blank (square blank and optimum blank)
According to Fig. 10, maximum deformation force decreases from 96KN to 61KN (almost 35% reduction) by means of optimum blank. This amount of reduction is highly significant for deep drawing process. This reduction can be referred to the area of initial blank. The area of optimum blank between die and blank holder is 25% smaller than the first square blank. Therefore, the punch force that is required to overcome frictional force has decreased accordingly.
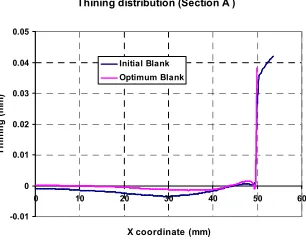
The next parameter is thickness distribution or amount of thinning in the deformed box. In Fig. 11, the values of thinning in two different sections A and B were obtained. These values are illustrated in Fig. 12 and 13.
A
Fig.11: Sections A and B; for thinning measurements.
Thining distribution (Section A )
-0.01 0 0.01 0.02 0.03 0.04 0.05
0 10 20 30 40 50 60
X coordinate (mm)
T
h
in
in
g
(
m
m
)
Initial Blank Optimum Blank
Fig.12: Thinning distribution in section A
Thining Distribution (Section B)
-0.15 -0.1 -0.05 0 0.05 0.1 0.15 0.2 0.25
0 10 20 30 40 50 60
X coordinate (mm)
T
h
in
in
g
(
m
m
)
[image:4.595.331.534.357.473.2]Initial Blank Optimuml Blank
Fig.13: Thinning distribution in section B
According to the thickness distribution curves, thinning values in the optimum blank drawing has been decreased compared to the first rectangular blank. The main reason of this reduction can be smaller radial force. This force is directly related to the material flow and thickness distribution. High radial force acts like a clamping system and do not let material to flow when the initial square blank is used. Fig. 14 shows the experimental results of square blank drawing and die set components.
Fig.14: (a) Die set components; (b) Drawn blank. In Fig. 14, earing defect is observed. To reduce the earing defect an optimum blank instead of square blank is used. Fig. 15 illustrates the optimum blank shape. The shape of deformed blank after drawing process is presented in Fig. 15b. It can be seen that the shape of optimum blank which were originally obtained from numerical analysis has significantly reduced the earing defect. However due to differences in material property and frictional contact conditions used in the numerical simulations compared to the experiments, the edge of the final product is not fully straight.
Fig.15: (a) Optimum blank; (b) Drawn optimum blank. Punch
Blank holder Die
[image:4.595.114.230.511.581.2] [image:4.595.90.243.613.733.2] [image:4.595.341.522.643.741.2]V. CONCLUSION
A program of optimum blank design based on modified sensitivity analysis for the deep drawing process has been developed. This program computes the components of shape sensitivity (Sx, Sy) for boundary nodes using deformation results. Then it determines the shape error for every boundary nodes and modifies the initial blank shape with the shape sensitivity in order to obtain the final target shape.
Deformation force decreased about 35% using the optimum blank shape. Finally it has been shown that optimum blank has changed the thinning distribution in deformed part significantly, the thickness distribution has become more uniform and the failure has been reduced.
Experimental tests showed that the shape of optimum blank has significantly reduced the earing defect. However due to differences in material property and frictional contact conditions used in numerical analysis compared to the experiments, the edge of the final product is not fully straight.
REFERENCES
[1] J. C. Gelin, P. Picart, “Numerical Simulation of 3D Sheet Metal Forming,” Proceedings of the Fourth International Conference on Numerical Simulation of 3D Sheet Metal Forming processes, NUMISHEET’99, Besançon, France, 1999.
[2] K. Mori, “Simulation of material processing: theory, methods and applications,” Proceedings of the Seventh International Conference on Numerical Methods in Industrial Forming Processes, NUMIFORM’2001, Toyohashi, Japan, 2001.
[3] A. Makinouchi, “Verification of simulation with experiment in metal forming and sheet drawing,” Proceedings of the Second International Conference on Numerical Simulation of 3D Sheet Forming processes, NUMISHEET’93, 1993.
[4] T. W. Ku, H. J. Lim, H. H. Choi, and S. M. Hwang, B.S. Kang,“ Implementation of backward tracing scheme of the FEM to blank design in sheet metal forming”, Int. J. Material processing technology , vol. 111, 2001, pp.90-97.
[5] M.Karma, “Blank development and tooling design for drawn parts using modified slip line field based approach” J. Eng. Ind, Trans. ASME vol. 111, 1989, pp. 345-350
[6] Sowerby, R., Duncan, J. L., and Chu, E., ‘‘The modeling of sheet metal stampings,’’ Int. J. Mech. Sci., vol. 28, 1986, pp. 415–430.
[7] Blount, G. N., and Fischer, B. V., ‘‘Computerized blank shape prediction for sheet metal components having doubly-curved surfaces,’’ Int. J. Prod. Res., vol.33, 1995, pp. 993–1005.
[8] Toh, C. H., and Kobayashi, S.,‘‘Deformation analysis and blank design in square cup drawing,’’ Int. J. Mech. Sci., vol. 25, 1985, pp. 15–32. [9] Kim, N., and Kobayashi, S., ‘‘Blank design in rectangular cup drawing by
an approximate method,’’ Int. J. Mach. Tool Des. Res., vol. 26, 1986, pp. 125–135.
[10] Lee, C. H., and Huh, H.,‘‘Blank design and strain prediction of automobile stamping parts by an inverse finite element approach,’’ J. Mater. Process. Techno., vol. 63, 1997, pp. 645–650.
[11] Kim, S. D., Park, M. H., Kim, S. J., and Seo, D. G., ‘‘Blank design and formability for non-circular deep drawing processes by the finite element method,’’ J. Mater. Process. Techno. Vol. 75, 1998, pp. 94–99. [12] S. Kobayashi, S.I. OH, T. Altan, Metal forming and the finite element
method, Oxford university press, 1989.