Clustered Architecture for Adaptive Multimedia
Streaming in WiMAX-based Cellular Networks
Hrishikesh Venkataraman
1,2,
Member, IAENG,
Aarthy Krishnamurthy,
1Member, IAENG,
Poornachand Kalyampudi
2, Jennifer McManis
1, Gabriel-Miro Muntean
1 ∗Abstract—In the recent years, there has been an in-creasing demand for high quality multimedia services over wireless networks. Triple play services (voice, data and video) require data-rates of the order of sev-eral megabits per second (Mbps). However, the large transmission distance and the limited battery power of the hand-held wireless device serves as a major bottleneck. In this paper, a novel cluster-based dou-ble dumbbell topology is proposed for adaptive multi-media streaming in WiMAX-based multihop cellular networks. The performance of the network is evalu-ated for a two-hop model and compared with a tra-ditional single-hop cellular design. Extensive simu-lations have been carried out in terms of different kinds of network traffic and over different protocols. It is observed that the performance of the proposed cluster-based design for WiMAX networks is signif-icantly superior to the one-hop design, not only in terms of the perceived quality, but also in terms of the loss rate and the average bit rate.
Keywords: bit rate, double dumbbell, loss rate, mul-timedia streaming, perceived quality, quality oriented adaptive scheme.
With the advent of third generation (3G) mobile systems, video conferencing and multimedia streaming have been in great demand. However, there are several technologi-cal challenges that hinders its deployment. Importantly, in case of a single-antenna system, the data rate required is very high which can be achieved either by increasing the bandwidth or by increasing the signal power at the receiver [1]. However, bandwidth is controlled by the Government and cannot be increased arbitrarily. Simi-larly, the wireless devices are energy-constrained units. Hence, the transmission power of these devices cannot be increased indiscriminately. In this scenario, an efficient mechanism to achieve high-data rate communication is to use multihop transmission between the source and desti-nation node [2]. In the multihop design, the relays reduce the transmission distance between a Tx-Rx pair which in turn reduces the power requirement and at the same time, increases the achievable maximum data rate of a
∗(1). Performance Engineering Laboratory (PEL), Dublin City
[image:1.595.327.526.214.413.2]University (DCU), Ireland; (2). Next Generation Wireless Systems, Dhirubhai Ambani Institute of Information and Communication Technology (DAIICT), India. Email: hrishikesh@eeng.dcu.ie
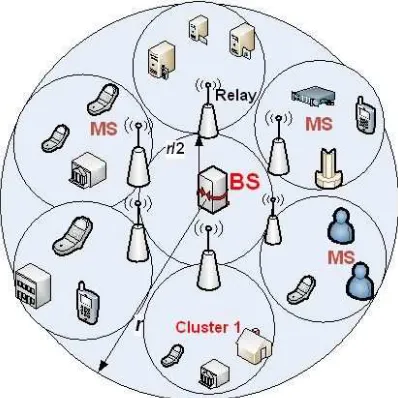
Figure 1: Cluster-based two-hop wireless networks
communicating link.
In their landmark paper, Gupta and Kumar [3] proved that the data rate, and hence, the system capacity in-creases asO(n2
perfor-mance is analyzed for both single-hop (dumbbell topol-ogy) and cluster-based two-hop design (double dumbbell topology). It is shown that the QOAS-based wireless network with double dumbbell topology performs sig-nificantly better than any other adaptive solutions and topology, not only in the perceived quality, but also in terms of the bit rate and the average loss rate. The paper is organized as follows: Section 1 describes the cluster-based two-hop wireless network model in detail, along with QOAS and other adaptive solutions. Section 2 describes the simulation model, the set up, and the simu-lation scenarios. The simusimu-lation results are explained in Section 3, and the conclusions are written in Section 4.
1
Architectural Design
1.1
Cluster-based
Two-Hop
Design
for
WiMAX Networks
A cluster-based hierarchical two-hop cellular design based on IEEE 9802.16j (multihop relay networks) is estab-lished between the server/base station (BS) and the end-user mobile stations (MSs), as shown in Fig. 1. As per this design, there aresix clusters in a coverage area. The circular coverage area has a radius,r, and is divided into two layers. The wireless nodes in the inner-layer commu-nicate directly with the server whereas the wireless ter-minals in the outer-layer are grouped into several clusters (six clusters in Fig. 1). In each cluster, a wireless termi-nal located at the boundary of the inner and outer layer of the network region is selected as a cluster-head node, alternately known as ‘relay’. The server always communi-cates with the users in the outer-layer through the relay. Hence, the maximum transmission distance of a commu-nicating pair in the network isr/2 [10].
In order to reduce the additional interference arising from the simultaneous communication of multiple communi-cating pairs, a Protocol Model is considered for inter-ference avoidance in the two-hop design [6, 10]. The reusability of the available spectrum resource (time slot in a time division multiple access system and a frequency band in a frequency division multiple access system) is in-creased in the cluster-based design by allowing two mul-tihop clusters in the network to utilize the same spec-trum resource. It should be noted that the number of clusters in the cluster-based design need not be always six [11]. But it should be an “even” number due to the basic principle of simultaneous transmission of communi-cation pairs located in the diametrically opposite clusters.
1.2
QOAS - Quality Oriented Adaptive
Scheme
The primary aim of integrating QOAS with the cluster-based design in the IEEE 802.16j wireless model is to maintain a high end-user perceived quality even with an increase in the number of wireless devices in the network.
QOAS relies on the fact that the impact on the end-user perceived quality is greater in case of random losses than that of controlled reduction in quality [12]. The sys-tem architecture of the feedback-based QOAS includes multiple instances of the end-to-end adaptive client and server applications [13]. Following ITU-T R. P.910 stan-dard [14], a five state model is defined for the multimedia streaming process. The QOAS client continuously moni-tors the transmission parameters and estimates the end-user perceived quality. The Quality of Delivery Grading Scheme (QoDGS) regularly computes Quality of Delivery (QoD) scores that reflect the multimedia streaming qual-ity in current delivery conditions. These grades are then sent as feedback to the server arbitration scheme (SAS). The SAS assesses the values of a number of consecutive QoD scores received as feedback in order to reduce the effect of noise in the adaptive decision taking process [15]. Based on these scores SAS suggests adjustments in the data rate and other parameters.
1.3
Other Adaptive Solutions
With an increase in the demand for multimedia streaming in wireless networks, there has been several approaches researched in the recent past. TFRCP is a unicast trans-port layer protocol, designed for multimedia streaming, and provides nearly the same amount of throughput as that of TCP on wired networks. The TFRCP controls rate based on network conditions expressed in terms of RTT and packet loss probability [8]. Similar to TFRCP, LDA+ (enhanced loss delay adaptation) also aims to reg-ulate the transmission behavior of multimedia transmit-ters in accordance with the network congestion state [7]. LDA+ uses RTP protocol for calculating loss and delay and uses them for regulating transmission rates of the senders. LDA+ adapts the streams in a manner simi-lar to that of TCP connections. In comparison, RBAR is a receiver based auto-rate mechanism. It is a MAC layer protocol and is based on RTS/CTS mechanism [9]. The main feature of RBAR is that both channel quality estimation and rate selection mechanism are on the re-ceiver side. This allows the channel quality estimation mechanism to directly access all of the information made available to it by the receiver (number of multipath com-ponents, symbol error rate, received signal strength, etc) for more accurate rate selection.
2
Simulation Model and Testing
2.1
Dumbbell and Double Dumbbell
Topol-ogy
Figure 2: Dumbbell network topology for single-hop client-server wireless architecture
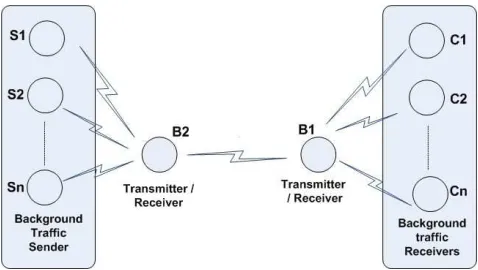
Figure 3: Double dumbbell network topology for two-hop client-server wireless architecture
forms the bottleneck link. B1 is the multimedia source and transmits information to the n clients C1, C2, ... Cn. In case of a two-hop communication, there is an inter-mediate relay between the web source and the end-user client. This can be represented by a double dumbbell topology, as shown in Fig. 3. The multimedia server is represented by B0, whereas the diametrically oppo-site relays are represented by B1 and B2. The end-users S1, S2, ... Sn on one end and C1, C2 ... Cn on the dia-metrically opposite cluster are the multimedia clients. B1 and B2 being relay nodes act as both transmitter and re-ceiver, depending on whether it receives information from B0 to the end-users, or sends feedback information from the end-users to B0. The major advantage of the double dumbbell topology over the dumbbell topology is the hi-erarchical formation of the network, and the provision for peer-to-peer communication among the wireless nodes.
In the simulation environment, B1-B2 in the dumbbell topology and B0-B1, B0-B2 links in the double dumbbell topology are the bottleneck links, with 2 Mbps band-width and 100ms latency. The other communicating links connected to the end-users in the network are over-provisioned. Hence, the congestion in the traffic, packet loss and delays occur mainly because of the bottleneck link. The bandwidth utilized at any time instant is mea-sured using a recently proposed method, iBE [16]. The buffering at the ends of the bottle-neck link uses a drop-tail queue of size proportional to the product of round trip time (RTT) and bottleneck link bandwidth.
2.2
Simulation Setup
The simulation setup consists of a number of mobile nodes distributed in the given coverage area. There is a server located at the center of the coverage area. In case of a one-hop network, the server communicates directly with all the wireless terminals in the network. However, in case of the cluster-based two-hop design, there are six gateways/relays at equidistant locations, mid-way across the coverage area, as shown in Fig. 1. The system is simulated using the server and client instances inbuilt in network simulator, NS-2. The length of all NS-2 sim-ulations is 250s. The video streams are modeled using Transform Expand Sample (TES) and then encoded us-ing MPEG4. The primary reason for usus-ing MPEG4 is that it supports media streaming and is suitable for home networking applications with its low bit rate as well as its interoperability of audio and video signals [17].
A binary phase shift keying (BPSK) modulation tech-nique is used at the physical layer. A slow varying flat fading channel is assumed throughout the simulations. In addition, a two-ray model with a lognormal shadow-ing of 4 dB standard deviation is considered [18]. At the MAC layer, an IEEE 802.11g based distributed co-ordination function (DCF) is used. The simulation is done at the packet level and the performance is evalu-ated in terms of average bit rate, loss rate and estimevalu-ated user perceived quality. The end-user perceived quality is measured by developing a relationship between coding bitrate, packet loss ratio and user-level quality. Traffic with different sizes and shapes are considered as in [12], so as to emulate the real life scenario of varieties of traf-fic sources with different average bit rates. The network performance is analyzed in terms of the perceived quality, the loss rate and the average bit rate, not only for QOAS technique, but also compared with other protocols, i.e., LDA+, TFRCP and RBAR.
3
Results
[image:3.595.52.288.240.359.2]Figure 4: Perceived quality of users for UDP-CBR peri-odic traffic in single-hop and cluster-based two-hop net-work design
3.9082 whereas LDA+ has a Q of 3.7025). However, in case of a cluster-based two-hop design, the improvement in the perceived quality between QOAS and LDA+ is atleast 9.97%, almost twice the benefit obtained from us-ing the ‘dumbbell’ topology. The performance of different adaptive schemes is shown in Table I and II for single-hop and clustered two-single-hop design. The adaptive proto-cols are represented by: ’Q’ for QOAS, ’L’ for LDA+, ’T’ for TFRCP and ’R’ for RBAR. It can be observed from the results that double dumbbell topology is superior to the plain dumbbell topology, for all kinds of UDP-CBR periodic traffic considered in the simulations.
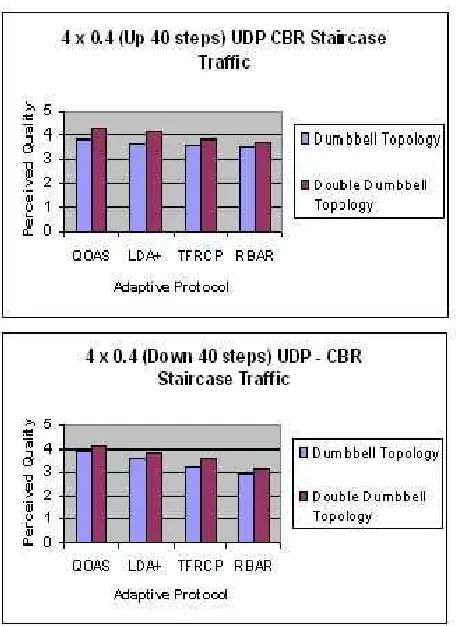
In a similar result, in case of UDP-CBR staircase traffic, the perceived quality obtained from the ‘double dumb-bell’ topology scores significantly over the ‘dumbdumb-bell’ scheme, as can be seen from Fig. 5. For example, in case of 4 x 0.4 Mbps (Up 40s steps), the perceived
qual-Figure 5: Perceived quality of users for UDP-CBR stair-case traffic in single-hop and cluster-based two-hop net-work design
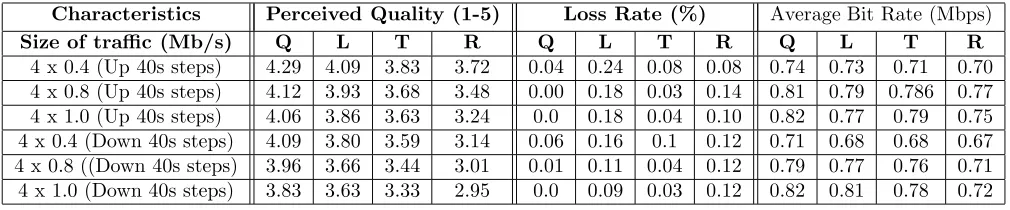
ity of QOAS using ‘dumbbell’ scheme is 3.8082, whereas the same using ’double dumbbell’ scheme is 4.2986, an increase of 12.87%. Not only with QOAS, but also with other methods like LDA+, TFRCP and RBAR, the per-ceived quality, loss rate and the average bit rate is notably superior when the double dumbbell topology is used. It can be seen from Table III and IV that the improvement in the average bit rate and the loss rate is also notably high in case of the double dumbbell topology, as com-pared to the dumbbell scheme. Similarly, the improve-ment in the loss rate for QOAS under the same traffic model is over six times (0.04 using ‘double dumbbell’ scheme and 0.24 using ‘dumbbell’ technique). Also, it should be noted that the performance improvement ob-tained from the two-hop design remains consistent over many different traffic scenarios of staircase traffic, as shown in Table III and IV.
4
Conclusions
[image:4.595.311.539.69.382.2]when combined with the cluster-based design not only results in superior multimedia transmission as compared to single-hop network, but also outperforms other proto-cols like LDA+, TFRCP and RBAR. In addition, the loss rate of the video frames is reduced,even up to a factor of 10, when the two-hop cluster-based design is used. This is a very significant result. It demonstrates the feasibility of multimedia streaming for the wireless network users. This would boost the network operator to incorporate the QOAS scheme and implement the cluster-based design in the design of next generation hierarchical multihop wire-less networks, in order to provide high quality video and multimedia streaming to the wireless end-users.
Acknowledgement
The authors would like to thank Irish Research Council for Science Engineering and Technology (IRCSET) for supporting this research work.
References
[1] H. Venkataraman, C. Michalke, V. Sinha and G. Fettweis, “An Improved Detection Technique for Re-ceiver Oriented MIMO-OFDM Systems,” in Proceed-ings of 9th
International OFDM Workshop, Dres-den, Germany, September 2004.
[2] H. Venkataraman and G.M. Muntean, “Analysis of Random Data Hopping in Distributed Multihop Wireless Networks,” in Proceedings of IEEE TEN-CON (Region 10) Conference, Hyderabad, India, 19-21 November 2008.
[3] P. Gupta and P.R. Kumar, “The Capacity of Wire-less Networks,”IEEE Transactions on Information Theory, vol. 46, no. 2, pp. 388–404, February 2000.
[4] H. Wu and C. Qao and S. De and O. Tonguz, “Integrated Cellular and Adhoc Relaying Systems,”
IEEE Journal on Selected Areas in Communication, vol. 19, no. 10, pp. 2105–2115, October 2001.
[5] Y. Liu, R. Hoshyar, X. Yang and R. Tafazolli, “Integrated Radio Resource Allocation for Multi-hop Cellular Networks with Fixed Relay stations,”
IEEE Journal on Selected Areas in Communications, vol. 24, no. 11, pp. 2137–2146, November 2006.
[6] H. Venkataraman, S. Sinanovic and H. Haas, “Cluster-based Design for Two-Hop Cellular Net-works,”International Journal for Communications, Networks and Systems (IJCNS), vol. 1, no. 4, 2008.
[7] D. Sisalem and A. Wolisz, “LDA+ TCP Friendly Adaptation: A Measurement and Comparison Study,” in ACM International Workshop on Net-work and Operating Systems Support for Digital Au-dio and Video (NOSSDAV), Chapel Hill, NC, USA, June 2000.
[8] M. Miyabayashi, N. Wakamiya, M. Murata and H. Miyahara, “MPEG-TFRCP: Video Transfer with TCP-Friendly Rate Control Protocol,” in Proceed-ings of IEEE International Conference on Commu-nications (ICC’01), Helsinki, Finland, vol. 1, June 2001, pp. 137–141.
[9] G. Holland, N. Vaidy, and V. Bahl, “A Rate-Adaptive MAC Protocol for Multihop Wireless Net-works, Rome, Italy,” inProceedings of ACM Mobile Computing and Networking (MOBICOM’ 01), 2001, pp. 236–251.
[10] H. Venkataraman, P.K. Jaini and S. Revanth, “Op-timal Positions of Relay Stations for Cluster-Based Two-Hop Cellular Network,” International Jour-nal for Communications, Networks and Systems (IJCNS), vol. 2, no. 5, 2009.
[11] H. Venkataraman, S. Nainwal and P. Srivastava, “Optimum Number of Gateways in cluster-based Two-Hop Cellular Networks,” AEUe Journal of Electronics and Communications, Elsevier Publica-tions, Available Online, March 19th 2009.
[12] G.M. Muntean and N. Cranley, “Resource Efficient Quality-Oriented Wireless Broadcasting of Adaptive Multimedia Content,”IEEE Transactions on Broad-casting, vol. 53, no. 1, pp. 362–368, March 2007.
[13] G.M. Muntean, L. Murphy and P. Perry, “A New Adaptive Multimedia Streaming System for All-IP Multi-Service Networks,”IEEE Transactions on Broadcasting, vol. 50, no. 1, pp. 1–10, March 2004.
[14] ITU-T Recommendation P.910, “Subjective Video Quality Assessment Methods for Multimedia Appli-cations,” September 1999.
[15] G.M. Muntean, P. Perry and L. Murphy, “A Comparison-Based Study of Quality-Oriented Video on Demand,” IEEE Transactions on Broadcasting, vol. 53, no. 1, pp. 92–102, March 2007.
[16] Z. Yuan, H. Venkataraman and G.M. Muntean, “iBE: A Novel Bandwidth estimation Algorithm for Multimedia Services over IEEE 802.11 Wireless Net-works,” Springer-Verlag, Management of Multime-dia Networks and Services (MMNS), 2009, To be published, October 2009.
[17] A. Matrawy, I. Lambadaris and C. Huang, “MPEG4 Traffic Modeling using The Transform Expand Sam-ple Methodology,” inProceedings of 4th IEEE Inter-national Workshop on Networked Appliances, 2002, pp. 249–256.
Characteristics Perceived Quality (1-5) Loss Rate (%) Average Bit Rate (Mbps)
Size of Traffic (Mb/s) Q L T R Q L T R Q L T R
[image:6.595.49.566.97.203.2]1 x 0.6 20s on-40s off 3.91 3.72 3.61 3.62 0.18 0.42 0.20 0.22 0.72 0.71 0.71 0.70 1 x 0.6 30s on - 60s off 3.81 3.62 3.49 3.46 0.18 0.42 0.18 0.20 0.73 0.72 0.72 0.71 1 x 0.8 20s on - 40s off 3.94 3.75 3.57 3.27 0.14 0.40 0.16 0.18 0.77 0.73 0.74 0.73 1 x 0.8 30s on - 60s off 3.61 3.58 3.22 3.01 0.14 0.38 0.16 0.16 0.76 0.73 0.74 0.75 1 x 1.0 20s on - 40s off 3.81 3.61 3.28 2.95 0.10 0.24 0.14 0.14 0.80 0.77 0.76 0.75 1 x 1.0 30s on - 60s off 3.56 3.41 3.17 2.83 0.10 0.24 0.14 0.14 0.80 0.77 0.77 0.76
Table 1: Performance Analysis for UDP-CBR Periodic Traffic using Dumbbell Topology
Characteristics Perceived Quality (1-5) Loss Rate (%) Average Bit Rate (Mbps)
Size of traffic (Mb/s) Q L T R Q L T R Q L T R
[image:6.595.53.549.268.373.2]1 x 0.6 20s on - 40s off 4.21 3.81 3.81 3.69 0.08 0.38 0.12 0.18 0.73 0.76 0.73 0.70 1 x 0.6 30s on - 60s off 4.03 3.72 3.69 3.42 0.08 0.38 0.12 0.18 0.73 0.76 0.74 0.72 1 x 0.8 20s on - 40s off 4.11 3.85 3.67 3.40 0.04 0.34 0.16 0.16 0.75 0.79 0.76 0.73 1 x 0.8 30s on - 60s off 3.88 3.59 3.31 3.02 0.04 0.34 0.16 0.16 0.75 0.79 0.77 0.76 1 x 1.0 20s on - 40s off 3.99 3.81 3.31 3.12 0.01 0.21 0.10 0.12 0.81 0.79 0.78 0.78 1 x 1.0 30s on - 60s off 3.69 3.50 3.26 3.08 0.01 0.21 0.10 0.12 0.81 0.79 0.79 0.79
Table 2: Performance Analysis for UDP-CBR Periodic Traffic using Double Dumbbell Topology
Characteristics Perceived Quality (1-5) Loss Rate (%) Average Bit Rate (Mbps)
Size of traffic (Mb/s) Q L T R Q L T R Q L T R
4 x 0.4 (Up 40s steps) 3.81 3.68 3.59 3.48 0.24 0.46 0.26 0.24 0.72 0.71 0.69 0.67 4 x 0.8 (Up 40s steps) 3.86 3.68 3.48 3.18 0.18 0.42 0.18 0.20 0.76 0.75 0.72 0.71 4 x 1.0 (Up 40s steps) 3.73 3.49 3.18 3.01 0.18 0.40 0.18 0.18 0.75 0.75 0.73 0.72 4 x 0.4 (Down 40s steps) 3.89 3.58 3.20 2.95 0.16 0.28 0.18 0.18 0.80 0.75 0.74 0.74 4 x 0.8 ((Down 40s steps) 3.73 3.56 2.87 2.78 0.14 0.24 0.14 0.16 0.85 0.81 0.80 0.76 4 x 1.0 (Down 40s steps) 3.58 3.32 2.69 2.68 0.14 0.24 0.13 0.16 0.86 0.80 0.81 0.80
Table 3: Performance Analysis for UDP-CBR Staircase Traffic using Dumbbell Topology
Characteristics Perceived Quality (1-5) Loss Rate (%) Average Bit Rate (Mbps)
Size of traffic (Mb/s) Q L T R Q L T R Q L T R
4 x 0.4 (Up 40s steps) 4.29 4.09 3.83 3.72 0.04 0.24 0.08 0.08 0.74 0.73 0.71 0.70 4 x 0.8 (Up 40s steps) 4.12 3.93 3.68 3.48 0.00 0.18 0.03 0.14 0.81 0.79 0.786 0.77 4 x 1.0 (Up 40s steps) 4.06 3.86 3.63 3.24 0.0 0.18 0.04 0.10 0.82 0.77 0.79 0.75 4 x 0.4 (Down 40s steps) 4.09 3.80 3.59 3.14 0.06 0.16 0.1 0.12 0.71 0.68 0.68 0.67 4 x 0.8 ((Down 40s steps) 3.96 3.66 3.44 3.01 0.01 0.11 0.04 0.12 0.79 0.77 0.76 0.71 4 x 1.0 (Down 40s steps) 3.83 3.63 3.33 2.95 0.0 0.09 0.03 0.12 0.82 0.81 0.78 0.72
[image:6.595.48.552.443.546.2] [image:6.595.47.552.614.719.2]