Abstract—This paper presents an approach for power saving of devices using activities of daily living (ADLs). In order to extract power-consuming patterns, we analyze daily activities which are collected from location sensors and electronic appliances. In addition, we construct a power management model using the incremental statistical method, which is improved by the ISM-based adaptive model using house construction and location of electronic devices. Furthermore, we provide a simulator that conducts the various functions using the power-consuming patterns and present the simulation results for the verification and efficiency of our model.
Index Terms—Activities of daily living, activity patterns, energy saving, power management, simulator
I. INTRODUCTION
Traditional context-aware systems accomplish complicate sensing tasks and employ some complicate context interpretation. Generally, a context-aware system for providing appropriate services should have four tasks involved in dealing with contexts: 1) context acquiring; 2) context interpreting; 3) disseminating context to interested parties; 4) service modeling [1], [2]. Furthermore, importance of saving the energy in a progress of the context computing system is being raised up recently.
EasyLiving and Independent LifeStyle Assistant (ILSA) are automation systems which are focused on constructing automatic home environments based on the internet infrastructure [3]. MARC (Medical Automation Research Center) at the University of Virginia has developed a communication module with a web-based data management server [4]. It analyzes the meal preparation patterns of people, including physiological signs such as heartbeat and body temperature.
MavHome at the University of Texas in Arlington is a home health monitoring system that assists in daily basic activities [5]. MavHome sensors track vital signs, movement patterns, medicine taking schedules, and interaction with devices in the home. The Center for Future Health at the University of Rochester provides an emergency response service [6]. Aware Home at the Georgia Institute of Technology has
E. Choi was with electrical and computer engineering, Ajou University, Suwon 443749, Korea. She is currently a Research Engineering in LG
Electronics, Seoul, Korea. (e-mail: [email protected]).
Y. J. Choi is with Dept. of Computer Science & Application Korean German Institute of Technology, Seoul, Korea (e-mail: [email protected]. suv.ac.kr).
Y. Nam is with the Center of Excellence for Ubiquitous System, Ajou University, Suwon, Korea. (corresponding author to provide phone: 82-31-219-1693; fax: 82-31-219-1695; e-mail:[email protected]).
focused on applications for supporting people with cognitive impairment in daily activities and communications [7]. Place Lab. of MIT has developed a portable kit that tracks movements of objects in the home, such as furniture and kitchen tool [8]. Adaptive House at the University of Colorado focuses on designing a self-programming home system, based on the lifestyle, needs, and preferences of the residents [9].
According the IEO2009 reference, world marketed energy consumption is projected to grow by 44 percent over the 2006 to 2030 period, and total world energy use is projected to rises by 472 quadrillion British thermal units (Btu) in 2006 to 678 quadrillion Btu in 2030 [10]. Furthermore, energy use in the residential sector accounted for about 15 percent of world delivered energy consumption in 2006 [10]. Although numerous autonomous systems are developed by the intelligence functions for energy saving, most researches have studied to save the energy using only control of sensors [11] – [19]. Moreover, existing systems are not considered of relationship between a power saving method and user activity patterns
To apply a developed intelligent function that reflect user’s habits in the context-aware computing system, the power saving model of the context-aware system should consider the human activity patterns. Because the user-based automatic system is dependent on a specific user’s activities, power management model using user activity patterns controls consumed power efficiently and effectively. To save various electrical device powers, the proposed power management system accomplishes potential power management by using control of devices from human activity patterns and real-time positioning data. Moreover, it is possible to infer an exact device which a user wishes to service using human activity patterns and real-time positioning data
The rest of this paper is organized as follows. In Section 2, we first introduce power management system using the simultaneous activity patterns. Section 3 shows our experimental environments and experimental results. Finally, the conclusion is given in Section 4.
II.SYSTEM ARCHITECTURE
In this section, we describe an overall architecture of activity patterns-based power management system. The system is designed by two models; the activity context model using the Incremental Statistical Method (ISM) [20] and the activity pattern-based power management model. The activity context model shows the possible activities’
Power Management Model using the
Incremental Simultaneous Method
sequence based on relative probabilities and temporal relations. The probability and temporal relation are saved and updated in an activity relation database.
The power management model extracts devices in use and devices out of use among working devices using user location and the electronic devices’ status. Then, the devices out of use are changed to standby mode. Through control of only out of devices, the potential power saving of an electronic device is possible in consideration of user convenience. Also, the amount of consumed power and saved power by the power management system are recorded periodically in the power measurement database. Lastly, the total consumed power and saved power are provided user daily, weekly, monthly, and yearly for informing data and arousing user’s attention about energy saving.
A.System Architecture
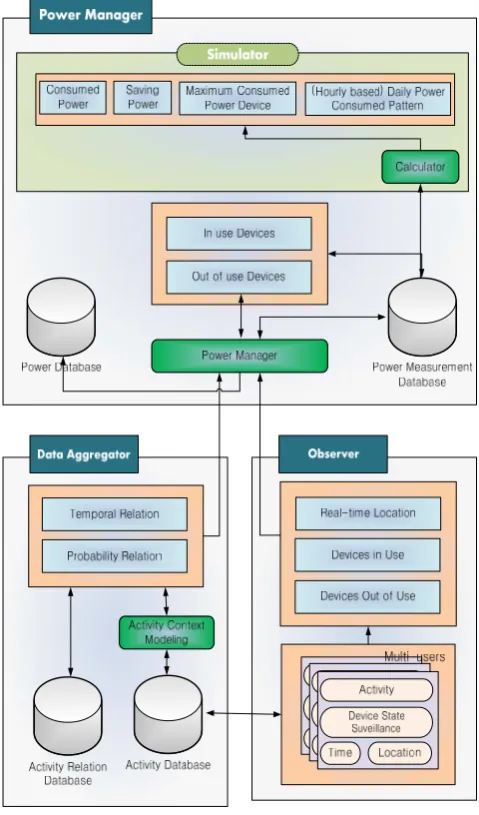
The proposed power management system controls the power mode of electronic devices by using the user’s absence from the space where the device, which the user can access, is placed. When a device that is placed in a certain room is used by a user, the system recognizes a user exists in the room. Whereas, the device mode is switched to standby mode when people leave the room that the device is placed. However, the user’s convenience should not be interrupted in smart environments. To prevent inconvenience, the electronic device wakes up from standby mode before a user comes back the room. Fig. 1 shows architecture of power management system for a smart environment.
The process of potential power management is divided into three parts; Data aggregator, Observer and Manager including Simulator. At the data aggregator, the context-aware system extracts relative probabilities and temporal relations which are related to the power management from human activity patterns. The observer has two roles; real-time multi-user observation and real-time electronic devices monitor. The observer watches out all users’ position at the real-time and checks the status of all devices. At the manager, the power is controlled automatically using by the temporal relation of activity patterns, real-time user position data and devices’ status. Among working electronic devices, the manager detects a device that is out of use as power saving target. Then, the system commands the device power mode to switch to standby mode.
[image:2.595.304.544.53.461.2]In addition, the consumed power is measured and amount of saved power is calculated at the real-time. The amount of the calculated power is periodically displayed to user with the consumed power of the maximum consumed device. The proposed power management system provides an automatic power managing service as well as a guide to power consume using the display service of amount of consumed power and amount of saved power.
Fig. 1 Architecture of power management system for a smart environment
III. POWER MANAGEMENT MODEL
Gynapse is a power management model based on a Hierarchical Hidden Markov Model to save energy by switching between different power modes of the electronic devices [21]. Gynapse tried to find an optimal way to handle On/Off switching of devices which can minimize the energy consumption while keeping the response time below the required level. The power management model of Gynapse is pre-designed by using house construction and electronic devices’ location. This model is simple to construct. However, the limitation of Gynapse is that the system does not manage the temporary use of devices and that the maintenance of device which is required in continuous use is interrupted by the temporary service.
sets in the process of constructing the simultaneous activity patterns set, that is, confusion of service control can occur by service activity duplication.
Only to extract the user activity patterns and to predict the next activity, ISM is very effective. However, the ISM is required the additional function for development in efficiency using removal of the overlapping service for supporting the predicted service and power saving service. In the process of switching the simultaneous activity patterns set, the native ISM-based system commands all existing services to stop and then services in the next set to start although some service devices should keep the previous status. In this process, unnecessary Off/On occurs.
Also, service time is delayed to keep the previous power status of electronic device because the native ISM-based system has to control device’s status after checking whether the device is the same one. The power management model should solve the problem of the duplicated service to abridge the delay time and to prevent unnecessary On/Off wasting. To remove duplicated service, the power management model using ISM should apply the HHMM. The duplication is removed by knowing house construction and existing electronic devices’ location.
To minimize the wasting of power, this paper proposes the power management model using user activity patterns and HHMM. First, we describe about a 3-level HHMM Power management model. Next, we introduce an adapted ISM-based power management model using ISM and HHMM. Lastly, the proposed simulator using ISM-based power management model is presented.
A.3 level HHMM Power Management System
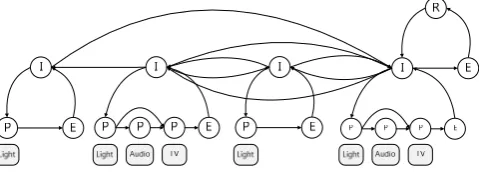
[image:3.595.50.290.625.712.2]A 3-level HHMM [21] which is depicted in Fig. 2 models the electronic device usage of a user. The component of the power management model is a device which is used by a user. The 3-level HHMM is organized based on electronic devices’ location. One node at the root level represents the state of a user when a user is home. Two nodes at the 2nd level represent the states that a user is in a room such as a living room, a bed room, a kitchen and a bathroom. Three nodes at the 3rd level represent the states of electronic devices such as a TV, a computer, an audio and a light of the each room. The key parameter between nodes is calculated probability from accumulated history data.
Fig. 2 3- level HHMM-based power management model
B.ISM-based Power Management System
An adapted ISM-based power management model proposes to control using electronic devices and to remove the duplicated service devices. First, data aggregator acquires a lot of contexts from sensors and electronic appliances. After acquiring context, the activity patterns and simultaneous activities patterns are extracted by analyzing the collected contexts. The simultaneous activity patterns are constructed as the simultaneous activity patterns set [20]. According the University of Oregon [22], the maximum activity number which person can do simultaneously is four. Therefore, the number of sub-activity is limited as four. Next, temporal relation of the simultaneous activity patterns set is determined between the sets by using the Allen’s temporal relation. In the simultaneous activity pattern set, the activity has probability relationship with another activity, and the simultaneous activity pattern set has probability relationship with another set. The probability is incrementally updated daily using the aggregator.
In Additional, separated sets which contain electronic devices in the same place are merged, and then the duplicated service devices are removed. For example, electronic devices of the Audio1 set and electronic devices of the TV1 set are in the same space, the lights of two sets are same one. Two sets are merged and the duplicated light is removed. Finally, the power management model using ISM is reconstructed without duplication service.
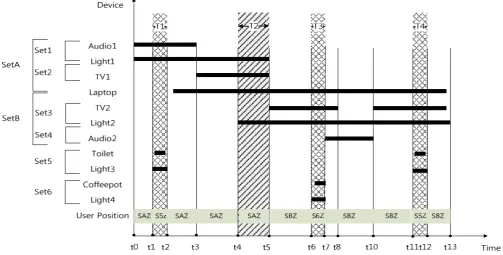
The goal of manager is to find only one set which keep on working using the ISM-based power management system and real-time user position and device status form data aggregator and to stop services in unnecessary sets. Figure 3 show an example of devices of simultaneous activity patterns set based on timeline. First, Set 1 and Set 2 are merged to become a Set A and duplicated services are removed to unnecessary On/off.
After merging without the duplicated service, the power management system commands unnecessary services to stop at the real time. In the figure 3, the system finds that Set A and Set B exist simultaneously in T2. Then, the system requests the observer real-time user position. In this case, the user is in Set A Zone (SAZ), that all service devices of Set B are stopped by the system.
Also, including temporary services as the components of the simultaneous activity patterns is possible to control electronic devices effectively and it leads to power saving. The device of temporary use is the device which a user can use temporarily or continuously by user intention. For example, the set of Toilet can be used for a long time when the user does shower, and the set of Toilet can be used for a short time when the user washes hands.
Fig. 3 Example of devices of simultaneous activity patterns set based on timeline.
IV. SIMULATION
A.Simulator
Simulator using the ISM-based power management model is designed to show consumed and saving power of all electronic devices and to encourage energy-saving as detecting electronic device which consumes maximum power. The result of the consumed and saving power is displayed the daily, weekly, monthly, and yearly.
First, the simulator is set up using number of room, total electronic device number, each device’s position (room-based), and number of existing person in the building. Next, the simulator calculates the consumed and saved power of the device using ISM-based power management system and shows the result of calculated power. As pass by day, the weekly, monthly and yearly, consumed power of each electronic device is saved accumulatively. In addition, the electronic device which has maximum consumed power amount is periodically (weekly, monthly, yearly) announced to user.
B.Results
We observed activity patterns of a single after arriving home, and before going to bed to corroborate efficiency of the ISM-based power management model. The power mode of electronic device is automatically set up by using the ISM-based power management model for power saving in a device. The mode of electronic device turns to stand-by mode immediately when the ISM-based power management system recognizes that the user is out of access range from the device. Also, the device is waked up before the user comes back to the room where the device is placed. Fig. 4 is the construction of the test-house which has living room, bedroom, kitchen and bathroom with devices for service.
[image:4.595.313.559.354.496.2]TV
Fig. 4 Construction of the test-house
Fig. 5 shows the result of ISM-based power management model. Four simultaneous activities pattern sets are constructed with probability relation between the sets. For example, one set has Audio, TV1, Laptop, and Light as simultaneous activities. The set has 100% relationship with the next set which is place on the right side.
[image:4.595.316.554.599.744.2]The simulator has significantly showed the energy efficiency of the ISM-based power management system. Using the simulator for applying the ISM-based power management system, saving rate is estimated daily, weekly, monthly, and yearly. Fig. 6 shows the saving power of each electronic device in the test-house that the ISM-based power management system is applied. Fig. 7 shows the result of wasted power in cased of ISM-based power management system and in case of the normal system without ISM. The wasted power without the power management system is average 2.64 times higher than wasted power using the ISM-based system daily. As estimated electronic power saving efficiency, 60.13%, monthly saving cost is 19.80 dollars and when we assume that the user maintains the same patterns. 0 200 400 600 800 1000 1200 1400 1600 1800
1 2 3 4 5 6
Sa vi ng p o w er [ k W ] Day
[image:5.595.324.540.47.347.2]Light of livingroom LCD TV TV Audio
Fig. 6 Saving power of devices in the test-house for applying the ISM-based power management system
0 500 1000 1500 2000 2500
1 2 3 4 5 6
C o ns um ed pow er [ k W] Day
Consumed power with the ISM Power Management System
[image:5.595.56.294.247.391.2]Consumed power without the power management system
Fig. 7 Total consumed power of the test-house for applying the proposed power management
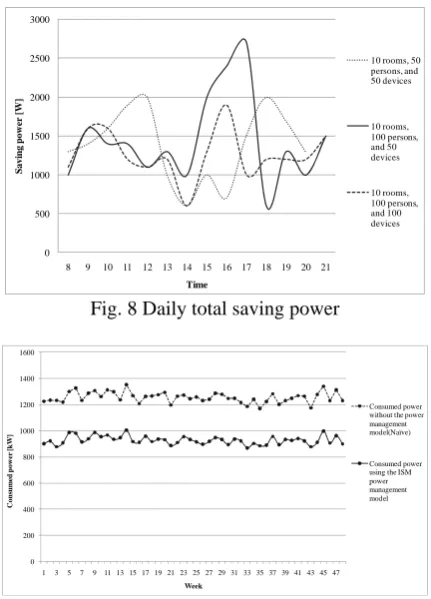
The simulator informs the saving and consumed power, and the overall mount of calculated power daily, weekly, monthly, and yearly from accumulated data. To cover the overall data in the proposed power management system, we assume an enormous amount of random activities. The duration of electronic device is applied using standard Gaussian random value. The hourly saved energy pattern is shown in Fig. 8. During work time, more people use device, save-efficiency increases. As the number of persons is double, minimum 3% to maximum 33% is saved. Fig. 9 shows the weekly consumed power of living TV during forty-seven weeks. Weekly saving power average using the ISM-based power management system is 327.69kW and weekly average of saving rate is 26%.
0 500 1000 1500 2000 2500 3000
8 9 10 11 12 13 14 15 16 17 18 19 20 21
Savi ng pow er [ W ] Time
10 rooms, 50 persons, and 50 devices 10 rooms, 100 persons, and 50 devices 10 rooms, 100 persons, and 100 devices
Fig. 8 Daily total saving power
0 200 400 600 800 1000 1200 1400 1600
1 3 5 7 911 13 15 17 19 21 23 25 27 29 31 33 35 37 39 41 43 45 47
C o ns um ed p o w er [ kW ] Week Consumed power without the power management model(Naïve)
Consumed power using the ISM power management model
Fig. 9 Weekly consumed power of living TV during 47 weeks (one year)
V.CONCLUSION
We have developed the ISM-based power management model including a 3-level HHMM model to manage the power of electronic devices based on analyzed activity patterns and real-time observed data. The activity contexts are collected from the environmental sensors and electronic appliances. Our proposed management system could control the unnecessary wasting power of electronic devices at the real time by using observing position data and device status. In addition, we presented the simulation results to verify power saving efficiency of the proposed power management model.
REFERENCES
[1] M. Satyanarayanan, “Pervasive Computing Vision and Challenges,” in
IEEE Personal Communications. vol. 8, no. 48, 2001, pp. 10–17.
[2] A.K. Dey, G.D Abowd, D. Salber, “A Context-Based Infrastructure for
Smart Environments,” in Proc. of 1st International Workshop on
Managing Interactions in Smart Environments, 1999, pp. 114–128.
[3] K. Z. Haigh, J. Phelps, C. W. Geib, “An open agent architecture for
assisting elder independence,” in Proceedings of the First international
Joint Conference on Autonomous Agents and Multiagent Systems: Part
2 ACM Press, New York, 2002, pp. 578–586.
[4] C. M. William, R. M. Bradley, “Home automation and smart homes to
support independence,” Smart technology for aging, disability, and independence, Wiley Interscience, 2005, pp. 33–66.
[5] R. Davenport, S. Helal, W. Mann, H. Zabadani, “Assistive
environments for elder care-integrating smart phones with smart
homes,” in the Proceedings of the International Conference on Aging,
Disability and Independence, 2003, pp. 128–129.
[6] D. Cook, S. Das, K. Gopalratnam, A. Roy, “Health monitoring in an
agent-based smart home,” in the Proceedings of the International
Conference on Aging, Disability and Independence, 2003, pp.
154–155.
[7] A. Pentland, P. Fauchet, “Personal health systems for the future,” in the
Proceedings of the International Conference on Aging, Disability and
[image:5.595.59.291.442.581.2][8] G. Abowd, A. Bobick, I. Essa, D. Fisk, B. Mynatt, W. Rogers, “Aware
home for aging in place,” in the Proceedings of the International
Conference on Aging, Disability and Independence, 2003, pp.
122–123.
[9] S. Intille, K. Larson, “Designing and evaluating technology for
independent aging in the home,” In the Proceedings of the
International
[10] Energy Information Administration: International energy outlook
2009. Technical Report DOE/EIA-0484 (2009), Available:
http://www.eia.doe.gov/oiaf/ieo/pdf/0484(2009).pdf.
[11] G. Anastasi, M. Conti, M. Di Francesco, A. Passarella. Energy
Conservation in Wireless Sensor Networks. Ad Hoc Networks [Online]
Available: http://info.iet.unipi.it/~anastasi/papers/adhoc08.pdf
[12] C. Tang, C. Raghavendra, “Compression Techniques for Wireless
Sensor Networks,” Chapter 10 in Wireless Sensor Networks, Kluwer
Academic Publishers, Boston, 2004
[13] C. Sadler, M. Martonosi, “Data Compression Algorithms for
Enegy-Constrained Devices in Delay Tolerant Networks,” in Proc. of
ACM SenSys, 2006
[14] S. Madden, M. Franklin, J. Hellerstein, W. Hong, “TAG: a Tiny
AGgregation Service for Ad-Hoc Sensor Networks,” in proceedings of
OSDI, 2002
[15] A. Boulis, S. Ganeriwal, M. B. Srivastava, “Aggregation in Sensor
Networks : an Energy-Accuracy Tradeoff,” in Ad Hoc Networks, Vol.
1, 2003 pp. 317–331.
[16] S. Goel, T. Imielinsky, “Prediction-Based Monitoring in Sensor
Networks: Taking Lessons from MPEG,” in ACM Computer
Communication Review, Vol. 31, No. 5, 2001
[17] A. Cerpa, D. Estrin, “ASCENT: Adaptive Self-Configuring Sensor
Networks Topologies,” in Proc. IEEE Infocom 2002, New York, 2002
[18] C. Schurgers, V. Tsiatsis, S. Ganeriwal, M. Srivastava, “Optimizing
Sensor Networks in the Energy-Latency-Density Design Space,” in
IEEE Trans. on Mobile Computing, Vol.1, No.1, 2002
[19] D. Ganesan, A. Cerpa, W. Ye, Y. Yu, J. Zhao, D. Estrin, “Networking
Issues in Wireless Sensor Networks,” in Journal of Parallel and
Distributed Computing, Vol. 64, 2004
[20] E. Choi, Y. Nam, B. Kim, W. Cho, “An incremental statistical method
for daily activity pattern extraction and user intention inference,” in
The KSII Transactions on Internet and Information Systems, 2009, pp.
219–234.
[21] H. Si, S. Saruwatari, M. Minami, H. Morikawa, “A Stochastic Scheme
to Balance Power Saving and Response Time of Electronic Devices,”
in Adjunct Proceedings of The 7th International Conference on
Pervasive Computing (Pervasive2009), Nara, Japan, 2009
[22] E. Vogel, E. Awh, “How to exploit diversity for scientific gain: Using