Bidirectional Phrase-based Statistical Machine Translation
Andrew Finch
NICT, Keihanna Science City, Kyoto, 619-0288, Japan
Eiichiro Sumita
NICT, Keihanna Science City, Kyoto, 619-0288, Japan
Abstract
This paper investigates the effect of di-rection in phrase-based statistial machine translation decoding. We compare a typ-ical phrase-based machine translation de-coder using a left-to-right decoding strat-egy to a right-to-left decoder. We also investigate the effectiveness of a bidirec-tional decoding strategy that integrates both mono-directional approaches, with the aim of reducing the effects due to lan-guage specificity. Our experimental eval-uation was extensive, based on 272 differ-ent language pairs, and gave the surprising result that for most of the language pairs, it was better decode from right-to-left than from left-to-right. As expected the rela-tive performance of left-to-right and right-to-left strategies proved to be highly lan-guage dependent. The bidirectional ap-proach outperformed the both the left-to-right strategy and the left-to-right-to-left strategy, showing consistent improvements that ap-peared to be unrelated to the specific lan-guages used for translation. Bidirectional decoding gave rise to an improvement in performance over a left-to-right decoding strategy in terms of the BLEU score in 99% of our experiments.
1 Introduction
Human language production by its very nature is an ordered process. That is to say, words are writ-ten/uttered in a sequence. The current genera-tion of phrase-based statistical machine translagenera-tion (SMT) systems also generate their target word se-quences according to an order. Since the gener-ation process is symmetrical, there are two pos-sible strategies that could be used to generate the target: from beginning to end; or from end to
be-ginning. Generating the target in the ‘wrong’ di-rection (the opposite didi-rection to the way in which humans do) is counter intuitive, and possibly as a result of this, SMT systems typically generate the target word sequence in the same order as human language production. However it is not necessar-ily the case that this is most effective strategy for all language pairs. In this paper we investigate the effect of direction in phrase-based SMT decoding. For the purposes of this paper, we will refer to target word sequence generation that follows the same order as human language production as
forward generation, and generation in the oppo-site direction to human language production as re-versegeneration. These are often referred ”left-to-right” and ”right-to-left” respectively in the litera-ture, but we avoid this notation as many languages are naturally written from right-to-left.
In earlier work (Watanabe and Sumita, 2002), it was hypothesized that the optimal direction for decoding was dependent on the characteristics of the target language. Their results show that for Japanese to English translation a reverse decod-ing strategy was the most effective, whereas for English to Japanese translation, a forward decod-ing strategy proved superior. In addition they im-plemented a bidirectional decoder, but their re-sults were mixed. For English to Japanese transla-tion, decoding bidirectionally gives higher perfor-mance, but for Japanese to English translation they were unable to improve performance by decod-ing bidirectionally. Their experiments were per-formed using a decoder based on IBM Model 4 using the translation techniques developed at IBM (Brown et al., 1993).
This work is closely related to the techniques proposed in (Watanabe and Sumita, 2002), but in our case we decode within the framework of a phrase-based SMT system, rather than the IBM model. Our intention was to explore the effect of direction in decoding within the context of a more
contemporary machine translation paradigm, and to experiment with a broader range of languages. The underlying motivation for our studies however remains the same. Languages have considerably different structure, and certain grammatical con-structs tend to occupy particular positions within sentences of the same language, but different po-sitions across languages. These differences may make it easier to tackle the automatic translation of a sentence in a given language from a partic-ular direction. Our approach differs in that the decoding process of a phrased-based decoder is quite different from that used by (Watanabe and Sumita, 2002) since decoding is done using larger units making the re-ordering process much sim-pler. In (Watanabe and Sumita, 2002) only one language pair is considered, for our experiments we extended this to include translation among 17 different languages including the Japanese and En-glish pair used in (Watanabe and Sumita, 2002). We felt that it was important to consider as many languages as possible in this study, as intuition and evidence from the original study suggests that the effect of direction in decoding is likely to be strongly language dependent.
The next section briefly describes the mecha-nisms underlying phrase-based decoding. Then we explain the principles behind the forward, re-verse and bidirectional decoding strategies used in our experiments. Section 3 presents the experi-ments we performed. Section 4 gives the results and some analysis. Finally in Section 5, we con-clude and offer possible directions for future re-search.
2 Phrase-based Translation
For our experiments we use the phrase-based ma-chine translation techniques described in (Koehn, 2004) and (Koehn et al., 2007), integrating our models within a log-linear framework (Och and Ney, 2002).
One of the advantages of a log-linear model is that it is possible to integrate a diverse set of fea-tures into the model. For the decoders used in the experiments in this paper, we included the follow-ing feature functions:
• An n-gram language model over the target word sequence
- Ensures the target word sequence is a likely sequence of words in the target language
• A phrase translation model
- Effects the segmentation of the source word sequence, and is also responsible for the transformation of source phrases into target phrases.
• A target word sequence length model - Controls the length of the target word
sequence. This is usually a constant term added for each word in the trans-lation hypothesis.
• A lexicalized distortion model
- Influences the reordering of the trans-lated source phrases in the target word sequence using lexical context on the boundaries of the phrases being re-ordered.
2.1 Decoding
In a phrabased SMT decoder, the word se-quence of the target language is typically gener-ated in order in a forward manner. The words at the start of the translation are generated first, then the subsequent words, in order until the fi-nal word of the target word sequence is gener-ated. As the process is phrase-based, the trans-lation is generated in a phrase-by-phrase manner, rather word-by-word. The basic idea is to seg-ment the source word sequence into subsequences (phrases), then translate each phrase individually, and finally compose the target word sequence by reordering the translations of the source phrases. This composition must occur in a particular order, such that target words are generated sequentially from the start (or end in the case of reverse de-coding) of the sentence. The reason that the target needs to be generated sequentially is to allow an
n-gram language model to be applied to the partial target word sequence at each step of the decoding process.
Left to right
Right to left
where is the station
<s>
<s> eki wa
<s> eki wa doko </s>
</s>
doko </s>
<s> eki wa doko </s>
P(eki | <s> ) P(wa | eki, <s>) P(doko | wa, eki, <s>) P(</s> | doko, wa, eki, <s>) PLM =
Generation
P(doko | </s> ) P(wa | doko, </s>) P(eki | wa, doko, </s>) P(<s> | eki, wa, doko, </s>) PLM =
[image:3.595.75.533.61.264.2]where is the station
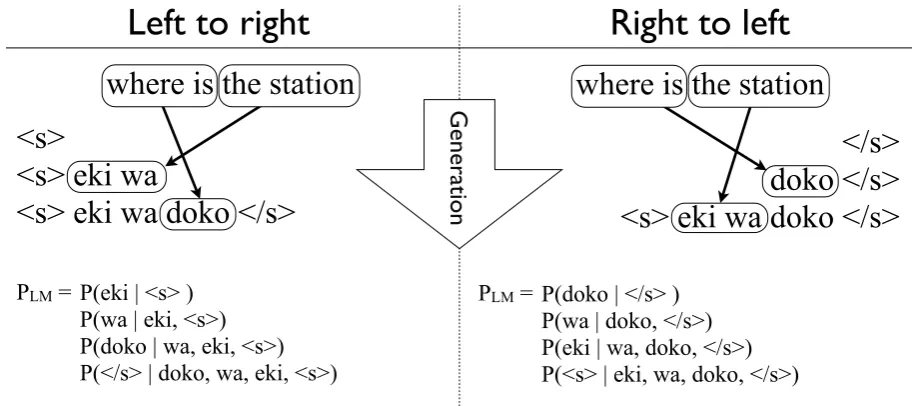
Figure 1: The phrase-based decoding process for an English to Japanese translation, in both forward and reverse directions. Then-gram language model probability calculation for the completed translation hypotheses are also shown on the bottom of the figure. See Section 2.1 for a description of the decoding process.
of only the start of sentence marker “hsi”. This marker only serves as context to indicate the start of the sequence for the benefit of the language model. The first target phrase is separated into its component words and each word is added in order to the target word sequence. Each addition causes an application of the language model, hence in Figure 1 the first term of PLM is P(eki|hsi), the second is P(wa|hsi) and so on. For reverse de-coding, the target sentence is generated starting from the end of sentence markerh/siwith the lan-guage model context being to the right of the cur-rent word. For the case of bidirectional decoding, the model probability for the hypothesis is a linear interpolation of the scores for both forward and re-verse hypotheses.
2.2 Direction in Decoding
Direction in decoding influences both the models used by the decoder and the search process itself. The direction of decoding determines the order in which target words are generated, the source phrases being translated in any order, therefore it is likely to be features of the target language rather than those of the the source language that deter-mine the effect that the decoding direction has on decoder performance.
2.2.1 The Language Model
The fundamental difference between the language models of a forward decoder and that of a reverse decoder is the direction in which the model looks for its context. The forward model looks back to the start of the sentence, whereas the reverse model looks forward to the end of the sentence.
2.2.2 The Search
Assuming a full search, a unigram language model and no limitations on reordering, the forward and reverse decoding processes are equivalent. When these constraints are lifted, as is the case in the experiments in this paper, the two search processes diverge and can give rise to hypotheses that are different in character.
se-quences in the partial hypotheses are used in the context of the models used in the subsequent de-coding. Thus, correctly decoding the start (or end for reverse decoding) of the sentence will benefit the subsequent decoding process.
3 Experiments
3.1 Experimental Data
The experiments were conducted on all possi-ble pairings among 17 languages. A key to the acronyms used for languages together with in-formation about their respective characteristics is given in Table 1.
We used all of the first ATR Basic Travel Ex-pression Corpus (BTEC1) (Kikui et al., 2003) for these experiments. This corpus contains the kind of expressions that one might expect to find in a phrase-book for travelers. The corpus is similar in character to the IWSLT06 Evaluation Campaign on Spoken Language Translation (Paul, 2006) J-E open track. The sentences are relatively short (see Table 1) with a simple structure and a fairly narrow range of vocabulary due to the limited domain.
The experiments were conducted on data that contained no case information, and also no punc-tuation (this was an arbitrary decision that we be-lieve had no impact on the results).
We used a 1000 sentence development corpus for all experiments, and the corpus used for eval-uation consisted of 5000 sentences with a single reference for each sentence.
3.2 Training
Each instance of the decoder is a standard phrase-based machine translation decoder that operates according to the same principles as the publicly available PHARAOH (Koehn, 2004) and MOSES (Koehn et al., 2007) SMT decoders. In these experiments 5-gram language models built with Witten-Bell smoothing were used along with a lex-icalized distortion model. The system was trained in a standard manner, using a minimum error-rate training (MERT) procedure (Och, 2003) with re-spect to the BLEU score (Papineni et al., 2001) on held-out development data to optimize the log-linear model weights. For simplicity, the MERT procedure was performed on independently on the forward and reverse decoders for the bidirectional system, rather them attempting to tune the param-eters for the full system.
3.3 Translation Engines 3.3.1 Forward
The forward decoding translation systems used in these experiments represent the baseline of our ex-periments. They consist of phrase-based, multi-stack, beam search decoders commonly used in the field.
3.3.2 Reverse
The reverse decoding translation systems used in these experiments were exactly the same as the forward decoding systems. The difference being the that word sequences in the training, develop-ment, and source side of the test corpora were re-versed prior to training the systems. The final out-put of the reverse decoders was reordered in a post processing step before evaluation.
3.3.3 Bidirectional
The decoder used for the bidirectional decoding experiments was modified in order to be able to decode both forward and reverse in separate in-stances of the decoder. Models for decoding in forward and reverse directions are loaded, and two decoding instances created. Scores for hypotheses that share the same target word sequence from the two decoders were combined at the end of the de-coding process linearly using equal interpolation weights. Hypotheses that were generated by only one of the component decoders were not pruned. The scores from these hypotheses only had a con-tribution from the decoder that was able to gener-ate them, the contribution from the other decoder being zero.
3.4 Decoding Constraints
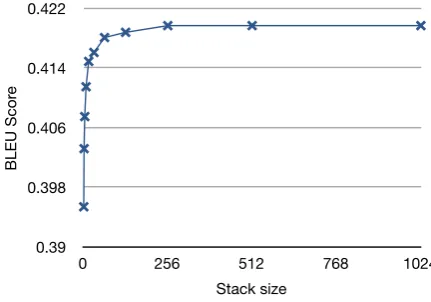
The experiments reported in this paper were con-ducted with loose constraints on the decoding as overconstraining the decoding process could lead to differences between unidirectional and bidirec-tional strategies. More specificially, the decod-ing was done with a beam width of 100, no beam thresholding and no constraints on the reordering process. Figure 2 shows the effect of varying the beam width (stack size) in the search for forward decoder of the English to Japanese translation ex-periment. At the beam width of 100 used in our experiments, the gains from doubling the beam with are small (0.07 BLEU percentage points).
Abbreviation Language #Words Avg. sent length Vocabulary Order
ar Arabic 806853 5.16 47093 SVO
da Danish 806853 5.16 47093 SVO
de German 907354 5.80 23443 SVO
en English 970252 6.21 12900 SVO
es Spanish 881709 5.64 18128 SVO
fr French 983402 6.29 17311 SVO
id Indonesian (Malay) 865572 5.54 15527 SVO
it Italian 865572 5.54 15527 SVO
ja Japanese 1149065 7.35 15405 SOV
ko Korean 1091874 6.98 17015 SOV
ms Malaysian (Malay) 873959 5.59 16182 SVO
nl Dutch 927861 5.94 19775 SVO
pt Portuguese 881428 5.64 18217 SVO
ru Russian 781848 5.00 32199 SVO
th Thai 1211690 7.75 6921 SVO
vi Vietnamese 1223341 7.83 8055 SVO
[image:5.595.96.503.60.316.2]zh Chinese 873375 5.59 14854 SVO
Table 1: Key to the languages, corpus statistics and word order. SVO denotes a language that predomi-nantly has subject-verb-object order, and SOV denotes a language that predomipredomi-nantly has subject-object-verb order
Stack size BLEU Score
1 0.3954
2 0.4032
4 0.4075
8 0.4115
16 0.4149
32 0.4161
64 0.4181
128 0.4188
256 0.4197
512 0.4197
1024 0.4197
0.39 0.398 0.406 0.414 0.422
0 256 512 768 1024
BLEU Scor
e
Stack size
Figure 2: The performance of a forward decoder (En-Ja) with increasing stack size.
(Koehn et al., 2007) was also included in the scores for partial hypothesis during the decoding.
3.5 Computational Overhead
In the current implementation, bidirectional de-coding takes twice as long as a mono-directional system. However, in a multi-threaded environ-ment, each instance of the decoder is able to run on its own thread in parallel, and so this slowdown can be mitigated in some circumstances. Future generations of the bidirectional decoder will more tightly couple the two decoders, and we believe
this will lead to faster and more effective search.
3.6 Evaluation
The results presented in this paper are given in terms of the BLEU score (Papineni et al., 2001). This metric measures the geometric mean of n -gram precision ofn-grams drawn from the output translation and a set of reference translations for that translation.
There are large number of proposed methods for carrying out machine translation evaluation. Methods differ in their focus of characteristics of the translation (for example fluency or adequacy), and moreover anomolous results can occur if a single metric is relied on. Therefore, we also carried out evaluations using the NIST (Dodding-ton, 2002), METEOR (Banerjee and Lavie, 2005), WER (Hunt, 1989), PER (Tillmann et al., 1997) and TER (Snover et al., 2005) machine translation evaluation techniques.
4 Results
[image:5.595.77.293.389.540.2]ar da de en es fr id it ja ko ms nl pt ru th vi zh ar - 47.8 48.8 51.7 48.8 47.3 46.5 49.2 29.8 27.8 46.9 49.0 49.0 47.8 39.7 43.0 27.8 da 58.3 - 58.7 63.0 58.6 55.7 53.5 58.5 37.5 35.1 54.4 59.6 59.0 55.4 48.1 51.7 35.2 de 53.8 55.5 - 59.4 55.9 51.9 50.3 55.3 34.2 32.0 50.8 57.0 55.9 51.2 45.7 48.9 32.7 en 63.6 65.8 64.8 - 67.0 61.0 58.4 65.8 41.1 38.7 59.1 67.6 66.7 58.7 52.8 57.7 38.6 es 57.6 58.2 58.0 65.6 - 56.6 54.2 61.1 38.3 36.4 54.3 59.6 62.6 55.1 47.6 51.3 36.0 fr 57.8 58.3 58.0 62.3 58.9 - 52.7 57.4 39.1 37.7 53.8 58.3 57.9 54.8 47.7 50.4 37.6 id 54.7 52.8 52.8 56.6 53.7 51.0 - 53.1 37.2 35.6 86.4 53.8 53.0 51.3 46.4 48.4 34.9 it 54.1 53.4 54.4 59.4 56.4 51.8 49.2 - 34.4 32.8 49.9 55.1 56.2 50.5 44.0 47.0 33.6 ja 38.2 39.2 38.6 41.9 39.9 40.2 40.7 39.5 - 69.4 40.4 39.5 39.7 37.8 37.3 37.2 52.1 ko 34.4 35.3 34.6 38.2 36.3 36.2 36.8 35.6 66.4 - 36.6 35.6 36.3 34.5 34.2 34.1 46.4 ms 54.5 52.7 52.6 56.2 53.4 50.6 82.5 53.2 36.8 34.9 - 53.6 53.4 51.3 46.7 49.2 34.8 nl 55.1 57.3 58.8 63.2 58.5 54.5 52.4 57.1 36.7 34.1 53.4 - 58.3 53.5 48.7 50.7 35.2 pt 56.8 57.7 57.6 63.8 62.0 55.5 52.7 59.7 37.8 36.4 53.4 58.7 - 54.2 47.1 50.6 35.8 ru 51.4 49.1 50.2 53.3 52.0 48.7 48.6 51.6 31.9 29.5 49.1 50.9 50.5 - 41.8 43.7 30.0 th 53.8 55.0 54.8 58.2 55.8 53.3 55.0 54.8 41.4 39.2 55.4 55.9 55.5 53.0 - 56.0 40.4 vi 53.6 53.6 54.2 57.4 54.2 51.4 52.3 53.3 37.6 35.8 53.3 54.6 54.4 51.7 50.3 - 36.2 zh 32.0 33.0 32.6 34.6 33.2 33.7 34.2 33.2 47.8 43.5 33.9 33.4 32.6 32.2 31.1 29.7 -Table 2: Baseline BLEU scores for all systems. The figures represent the scores in BLEU percentage points of the baseline left-to-right decoding systems. Source languages are indicated by the column headers, the row headers denoting the target languages.
the forward strategy outperformed the contrasting strategy are shaded in gray. The numbers in the cells represent the difference in BLEU percentage points for the systems being compared in that cell. It is clear from Table 3 that for most of the lan-guage pairs (67% of them for BLEU, and a simi-lar percentage for all the other metrics except ME-TEOR), better evaluation scores were achieved by using a reverse decoding strategy than a forward strategy. This is a surprising result because lan-guage is produced naturally in a forward manner (by definition), and therefore one might expect this to also be the optimal direction for word sequence generation in decoding.
4.1 Word Order Typography
Following (Watanabe and Sumita, 2002), to ex-plain the effects we observe in our results we look to the word order typography of the target lan-guage (Comrie and Vogel, 2000). The word or-der of a language is defined in terms of the oror-der in which you would expect to encounter the finite verb (V) and its arguments, subject (S) and ob-ject (O). In most languages S precedes O and V. Whether or not O precedes or follows V defines the two most prevalent word order types SOV and SVO (Comrie and Vogel, 2000).
Two of the target languages in this study
(Japanese and Korean) have the SOV word type, the remainder having the SVO word order type. In Table 3 looking at the rows for ja and ko we can see that for both of these languages reverse decoding outperformed forward decoding in only 4 out of 12 experiments. Furthermore these two languages were the two languages that benefited the most (in terms of the number of experimental cases) from forward decoding. The two languages also agree on the best decoding direction for 12 of the 16 language pairs. This apparent correlation may reflect similarities between the two languages (word order type, or other common features of the languages).
Given this evidence, it seems plausible that word order does account in part for the differences in performance when decoding in differing direc-tions, but this can only be part of the explanation since there are 4 source languages for which re-verse decoding yielded higher performance.
ap-ar da de en es fr id it ja ko ms nl pt ru th vi zh ar - 0.87 0.34 1.30 0.93 1.63 0.66 0.58 0.12 0.36 0.85 0.33 0.88 0.22 1.33 1.04 0.88 da 0.25 - 0.41 0.71 0.56 0.70 1.10 0.31 0.46 0.07 0.96 0.13 0.62 0.17 1.28 0.71 0.29 de 0.41 0.04 - 0.38 0.52 0.15 0.80 0.01 0.47 0.72 0.60 0.25 0.21 0.05 0.47 0.68 0.20 en 0.04 0.05 0.21 - 0.05 0.13 0.58 0.02 0.73 0.35 0.39 0.07 0.52 0.05 0.67 0.63 0.29 es 0.14 0.19 0.05 0.35 - 0.68 0.01 0.08 0.25 0.31 0.25 0.25 0.17 0.07 0.43 0.44 0.78 fr 0.37 0.57 0.38 0.66 0.21 - 0.36 0.28 0.15 0.45 0.22 0.46 0.64 0.10 0.25 0.58 0.31 id 0.16 0.02 0.31 1.45 0.58 0.50 - 0.34 0.03 0.27 0.00 0.42 0.57 0.36 0.53 1.04 0.59 it 0.28 0.72 0.36 0.27 0.08 0.30 0.11 - 0.07 0.12 0.37 0.23 0.05 0.37 0.04 0.63 0.37 ja 0.36 0.22 0.03 0.03 0.22 0.13 0.64 0.36 - 0.21 0.57 0.46 0.08 0.33 0.08 0.83 0.70 ko 0.35 0.01 0.31 0.03 0.12 0.07 0.13 0.21 0.42 - 0.29 0.07 0.42 0.40 0.44 0.62 0.05 ms 0.06 0.49 0.53 1.38 0.99 0.71 0.47 0.34 0.11 0.32 - 0.62 0.27 0.10 0.83 0.99 0.11 nl 0.26 0.03 0.26 0.30 0.20 0.19 0.47 0.23 0.13 0.06 0.06 - 0.08 0.09 0.06 1.00 0.15 pt 0.03 0.34 0.06 0.51 0.07 0.17 0.06 0.18 0.13 0.65 0.08 0.10 - 0.06 0.09 0.85 0.35 ru 0.25 0.58 0.67 0.74 0.01 0.48 0.50 0.27 0.41 0.38 0.13 0.38 0.46 - 0.88 0.56 0.49 th 0.19 0.28 0.21 0.41 0.05 0.23 0.30 0.00 0.34 0.04 0.25 0.07 0.21 0.08 - 0.46 0.25 vi 0.21 0.34 0.24 0.65 0.72 0.34 0.06 0.59 0.24 0.22 0.19 0.12 0.11 0.18 0.63 - 0.15 zh 0.43 0.26 0.42 0.05 0.15 0.31 0.16 0.28 0.00 0.31 0.40 0.14 0.67 0.18 0.39 0.21 -Table 3: Gains in BLEU score from reverse decoding over a forward decoding strategy The numbers in the cells are the differences in BLEU percentage points between the systems. Shaded cells indicate the cases where forward decoding give a higher score. Source languages are indicated by the column headers, the row headers denoting the target languages.
Metric Bi>For Bi>Rev Rev>For BLEU 98.90 84.93 67.65 NIST 98.53 78.31 75.00 METEOR 99.63 95.96 50.74
WER 99.26 92.85 66.18
PER 98.53 84.97 70.59
TER 99.63 91.18 68.75
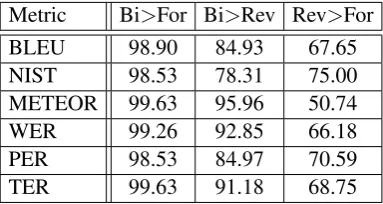
Table 4: Summary of the results using several au-tomatic metrics for evaluation. Numbers in the ta-ble correspond to the percentage of experiments in which the condition at the head of the column was true (for example figure in the first row and first column means that for 98.9 percent of the lan-guage pairs the BLEU score for the bidirectional decoder was better than that of the forward de-coder)
proach (Brown et al., 1993)).
The results were the similar in character when other MT evaluation methods were used. These results are summarized in Table 3.
4.2 Bidirectional Decoding
Table 5 shows the performance of the bidirectional decoder relative to a forward decoder. As can be
seen from the table, in 269 out of the 272 experi-ments the bidirectional decoder outperformed the unidirectional decoder. The gains ranged from a maximum of 1.81 BLEU (translating from Thai to Arabic) points, to a minimum of -0.04 BLEU points (translating from Indonesian to Japanese) with the average gain over all experiments being 0.56 BLEU points. It is clear from our experi-ments that there is much to be gained from decod-ing bidirectionally. Our results were almost unani-mously positive, and in all three negative cases the drop in performance was small.
5 Conclusion
[image:7.595.84.276.397.499.2]usu-ar da de en es fr id it ja ko ms nl pt ru th vi zh ar - 0.66 0.51 1.03 0.65 0.75 0.59 0.47 0.46 0.85 0.59 0.69 0.39 0.30 1.81 1.30 0.85 da 0.27 - 0.61 0.63 0.38 0.60 0.59 0.29 1.04 0.79 0.69 0.45 0.89 0.27 1.28 0.87 0.47 de 0.52 0.51 - 0.54 0.44 0.42 0.70 0.40 0.74 0.45 0.83 0.37 0.28 0.34 0.77 0.90 0.84 en 0.53 0.01 0.32 - 0.23 0.25 0.56 0.19 1.11 0.59 0.28 0.27 0.45 0.60 0.89 0.61 0.58 es 0.28 0.48 0.45 0.56 - 0.43 0.12 0.26 0.57 0.64 0.56 0.06 0.04 0.24 1.16 1.23 0.68 fr 0.70 0.33 0.54 0.66 0.46 - 0.49 0.57 0.24 0.13 0.11 0.43 0.33 0.55 0.91 1.09 0.57 id 0.24 0.32 0.36 0.93 0.70 0.65 - 0.35 0.75 0.77 0.11 0.46 0.69 0.57 0.99 0.85 0.47 it 0.13 0.55 0.32 0.43 0.47 0.51 0.64 - 0.65 0.42 0.77 0.51 0.51 0.69 0.85 0.98 0.58 ja 0.38 0.62 0.60 0.61 0.38 0.73 0.04 0.43 - 0.35 0.05 0.70 0.30 0.38 0.53 0.17 0.02 ko 0.49 0.62 0.90 0.40 0.34 0.57 0.47 0.47 0.02 - 0.23 0.52 0.20 0.83 0.70 0.44 0.83 ms 0.37 0.57 0.63 0.92 0.81 0.75 0.36 0.54 0.70 1.31 - 0.76 0.35 0.51 1.14 0.70 0.35 nl 0.35 0.14 0.54 0.33 0.30 0.46 0.68 0.69 0.77 0.63 0.44 - 0.42 0.67 0.71 1.13 0.55 pt 0.46 0.21 0.37 0.21 0.17 0.49 0.47 0.24 0.88 0.45 0.54 0.39 - 0.41 0.94 1.15 0.90 ru 0.69 0.63 0.69 0.77 0.26 0.50 0.79 0.52 0.69 0.90 0.66 0.69 0.40 - 1.19 1.23 0.47 th 0.90 0.49 0.53 0.77 0.64 0.38 0.21 0.60 0.37 0.96 0.38 0.63 0.68 0.72 - 0.33 0.45 vi 0.64 0.61 0.42 1.09 0.84 0.63 0.34 0.70 0.59 0.39 0.16 0.56 0.36 0.50 0.77 - 0.53 zh 0.23 0.48 0.96 0.33 0.49 0.32 0.27 0.43 0.43 0.69 0.31 0.97 0.85 0.23 0.40 0.50 -Table 5: Gains in BLEU score from decoding bidirectionally over a forward decoding strategy. The numbers in the cells are the differences in BLEU percentage points between the systems. Shaded cells indicate the cases where forward decoding gave a higher score. Source languages are indicated by the column headers, the row headers denoting the target languages.
ally better to decode in a forward direction. Our main contribution has been to show that a bidirec-tional decoding strategy is superior to both mono-directional decoding strategies. It might be argued that the gains arise simply from system combina-tion. However, our systems are combined in a sim-ple linear fashion, and gains will only arise when the second system contributes novel and useful in-formation to into the combination. Furthermore, our systems are trained on two copies of the same data, no additional data is required. The gains from decoding bidirectionally were obtained very consistently, with only loose constraints on the de-coding. This can be seen clearly in Table 5 where the results are almost unanimously positive. More-over, these gains appear to be independent of the linguistic characteristics of the source and target languages.
In the future we would like to explore the pos-sibilities created by more tightly coupling the for-ward and reverse components of the bidirectional decoder. Scores from partial hypotheses of both processes could be combined and used at each step of the decoding, making the search more in-formed. Furthermore, forward partial hypotheses and reverse hypotheses would ‘meet’ during de-coding (when one dede-coding direction has covered
words in the source that the other has yet to cover), and provide paths for each other to a final state in the search.
Acknowledgment
This work is partly supported by the Grant-in-Aid for Scientific Research (C) Number 19500137 and ”Construction of speech translation founda-tion aiming to overcome the barrier between Asian languages”, the Special Coordination Funds for Promoting Science and Technology of the Min-istry of Education, Culture, Sports, Science and Technology, Japan.
References
Satanjeev Banerjee and Alon Lavie. 2005. Me-teor: an automatic metric for mt evaluation with im-proved correlation with human judgments. In ACL-2005: Workshop on Intrinsic and Extrinsic Evalua-tion Measures for Machine TranslaEvalua-tion and/or Sum-marization, pages 65–72.
P. Brown, S. Della Pietra, V. Della Pietra, and R.J. Mer-cer. 1993. The Mathematics of Statistical Machine Translation: Parameter Estimation. Computational Linguistics, 19(2):263–311.
G. Doddington. 2002. Automatic Evaluation of Machine Translation Quality Using N-gram Co-Occurrence Statistics. In Proceedings of the HLT Conference, San Diego, California.
Melvyn J. Hunt. 1989. Figures of merit for assess-ing connected-word recognisers. In In Proceed-ings of the ESCA Tutorial and Research Workshop on Speech Input/Output Assessment and Speech Databases, pages 127–131.
G. Kikui, E. Sumita, T. Takezawa, and S. Yamamoto. 2003. Creating corpora for speech-to-speech trans-lation. InProceedings of EUROSPEECH-03, pages 381–384.
Philipp Koehn, Hieu Hoang, Alexandra Birch, Chris Callison-Burch, Marcello Federico, Nicola Bertoldi, Brooke Cowa, Wade Shen, Christine Moran, Richard Zens, Chris Dyer, Ondrej Bojar, Alexan-dra Constantin, and Evan Herbst. 2007. Moses: open source toolkit for statistical machine transla-tion. InACL 2007: proceedings of demo and poster sessions, pages 177–180, Prague, Czeck Republic, June.
Philipp Koehn. 2004. Pharaoh: a beam search de-coder for phrase-based statistical machine transla-tion models. In Machine translation: from real users to research: 6th conference of AMTA, pages 115–124, Washington, DC.
Franz Josef Och and Hermann Ney. 2002. Discrimina-tive training and maximum entropy models for sta-tistical machine translation. InIn Proceedings of the 40th Annual Meeting of the Association for Compu-tational Linguistics (ACL 2002), pages 295–302. Franz J. Och. 2003. Minimum error rate training for
statistical machine trainslation. In Proceedings of the ACL.
Kishore Papineni, Salim Roukos, Todd Ward, and Wei-Jing Zhu. 2001. Bleu: a method for automatic eval-uation of machine translation. InACL ’02: Proceed-ings of the 40th Annual Meeting on Association for Computational Linguistics, pages 311–318, Morris-town, NJ, USA. Association for Computational Lin-guistics.
Michael Paul. 2006. Overview of the iwslt 2006 eval-uation campaign. InProceedings of the IWLST. Mathew Snover, Bonnie Dorr, Richard Schwartz, John
Makhoul, Linnea Micciula, and Ralph Weischedel. 2005. A study of translation error rate with tar-geted human annotation. Technical report, Univer-sity of Maryland, College Park and BBN Technolo-gies, July.
C. Tillmann, S. Vogel, H. Ney, A. Zubiaga, and H. Sawaf. 1997. Accelerated dp based search for statistical translation. In In European Conf. on Speech Communication and Technology, pages 2667–2670.