Development and validation of cellular models for studying
amyloid precursor protein isoforms.
POTIWAT, Natruedee.
Available from Sheffield Hallam University Research Archive (SHURA) at:
http://shura.shu.ac.uk/20244/
This document is the author deposited version. You are advised to consult the
publisher's version if you wish to cite from it.
Published version
POTIWAT, Natruedee. (2015). Development and validation of cellular models for
studying amyloid precursor protein isoforms. Doctoral, Sheffield Hallam University
(United Kingdom)..
Copyright and re-use policy
See
http://shura.shu.ac.uk/information.html
Sheffield Hallam University Research Archive
SHEFFIELD HALLAM UNIVERSITY
ADSETTS LEARNING CENTRE
CITY CAMPUS SHEFFIELD
S1 1WB
Sheffield Hallam University Learning and Information Services
Adsetis Centre, City Campus Sheffield S1 1WD
ProQuest Number: 10700889
All rights reserved
INFORMATION TO ALL USERS
The qu ality of this repro d u ctio n is d e p e n d e n t upon the q u ality of the copy subm itted.
In the unlikely e v e n t that the a u th o r did not send a c o m p le te m anuscript and there are missing pages, these will be note d . Also, if m aterial had to be rem oved,
a n o te will in d ica te the deletion.
uest
ProQuest 10700889
Published by ProQuest LLC(2017). C op yrig ht of the Dissertation is held by the Author.
All rights reserved.
This work is protected against unauthorized copying under Title 17, United States C o d e M icroform Edition © ProQuest LLC.
ProQuest LLC.
789 East Eisenhower Parkway P.O. Box 1346
Development and validation of cellular models for studying amyloid
precursor protein isoforms
Natruedee Potiwat
A thesis submitted in partial fulfilment of the requirements of Sheffield Hallam University
for the degree of Doctor of Philosophy
Abstract
The development and validation of cellular model for studying amyloid precursor
protein isoforms
Amyloid 3 peptide (A(3) is the major constituent o f neuritic plaques in the brains of patients w ith Alzheimer's disease (AD). A(3 is a small insoluble 39-43 amino acid peptide derived from the Amyloid Precursor Protein (APP) by proteolytic cleavage. Different gene splicing produces variant isoforms ranging from 365 to 770 amino acids in length. The main three isoforms are: APP695, APP751 and APP770 and all are potentially sources o f A(3.
The project aimed to investigate the hypothesis that one o f these APP isoforms (APP695, APP751 and APP770) is more likely to be the source o f A3 in Alzheimer's disease under normal and stress-induced conditions. The clones o f HEK293 cells stably expressing human APP695, APP751 and APP770 at comparable levels were put under stress inducing conditions: Serum alteration and energy deprivation.
By altering FBS concentration in culture medium, more APP751 was secreted than APP695 and APP770 at all concentrations o f FBS. The serum alteration in culture medium had no significant effect on cell number, secreted APP and APP gene expression. Energy deprivation was achieved using 2-deoxy-D-glucose (2DG). There was a significant reduction in cell number to a similar level fo r all three clones while the level o f secreted APP and APP gene expression increased significantly. Also, the trend o f APP secretion from each clone under the same concentration of 2DG was the same: more APP751 was secreted than APP695 and APP770.
Table of contents
Chapter 1: Introduction... 1
1.1 Alzheimer's disease... 1
1.1.1 Epidemiology... 1
1.1.2 Clinical feature s... 2
1.2 Neuropathological hallmarks... 4
1.2.1 Amyloid plaques... 4
1.2.2 Neurofibrillary tangles...6
1.2.3 Cerebral amyloid angiopathy...8
1.2.4 Synaptic deficits and neuron loss... 9
1.3 Amyloid precursor protein... 9
1.3.1 Amyloid precursor p ro te in ... 9
1.3.2 Proteolytic processing o f APP... 11
1.3.3 Function o f APP and its derivatives... 18
1.4 Other pathologies associated in A D ... 19
1.4.1 Inflammation and A D ...19
1.4.2 Oxidative stress and AD... 22
1.4.3 Metallobiology in AD ...25
1.5 Genetics aspects o f A D ...27
1.5.1 Amyloid Precursor Protein (APP) m utations... 28
1.5.2 Presenilin m utations... 29
1.5.3 Apolipoprotein E (ApoE) allelles... 30
1.5.4 SORLA... 31
1.6 Hypotheses proposed to account fo r A D ...32
1.6.1 Cholinergic hypothesis... 32
1.6.2 Tau hypothesis... 33
1.7 Current trea tm ents...36
1.8 Background of the p ro je ct... 38
1.9 Aim and objectives... 42
Chapter 2: Materials and methods...43
2.1 Bacterial cu ltu re ...43
2.2 Cryopreservation and recovery o f bacteria...43
2.4 Restriction enzyme d ig e stio n ... 46
2.5 Ligation...46
2.6 Agarose gel electrophoresis... 46
2.7 Gel extraction... 48
2.8 Plasmid preparation... 48
2.9 Transformation of NEB 5-a competent E.coli... 49
2.10 Sequencing... 50
2.11 Cell c u ltu re ... 50
2.11.1 Cell line stock... 50
2.11.2 CHO c u ltu re ... 51
2.11.3 HEK293 c u ltu re ...51
2.11.4 Cell counting... 51
2.12 Cryopreservation and resurrection of mammalian cells... 52
2.13 Antibiotic kill c u rv e ... 52
2.14 Transfection... 53
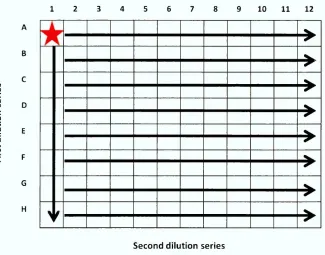
2.15 Limited dilution clo nin g... 54
2.16 Im m unoprecipitation... 56
2.17 Reduction and alkylation o f disulphide bo n d s...56
2.18 Sodium Dodecyl Sulfate polyacrylamide gel electrophoresis... 57
2.19 SDS-PAGE running conditions and im m unoblotting...58
2.21 Quantification o f RNA samples using NanoDrop ND-1000 UV-VIS
S pectrophotom eter... 61
2.22 The principle o f Reverse Transcriptase PCR (RT-PCR) and quantitative Real-Time RT-PCR...61
2.23 Complementary DNA synthesis from RNA sample fo r real-time RT-PCR...64
2.24 Reference gene assessment fo r use in real-time RT-PCR... 64
2.25 Reference gene stability assessment... 68
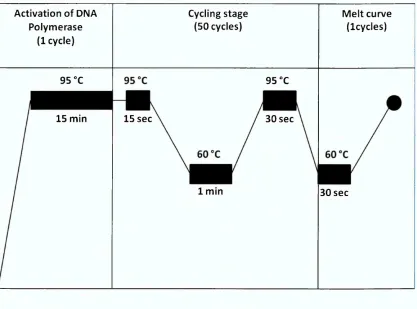
2.26 Conditions and components of TaqMan® real-time RT-PCR re a c tio n ... 69
2.27 Primer efficiency assessment... 71
2.28 Real-time RT-PCR data analysis...71
2.29 Statistics... 73
Chapter 3: Confirmation of APP770 construct and generation of APP751 and APP695 constructs (plREShyg2)... 74
3.1 In tro d u ctio n...74
3.2 Method fo r confirm ation of APP770 construct... 74
3.2.1 Primer design... 74
3.2.2 Sequence alignm ent... 75
3.3 Expression vector expressing APP751 construct...80
3.3.1 Primer Design...80
3.3.2 Generation o f APP751 cDNA and expression v e c to r...80
3.3.3 Sequence alignm ent... 81
3.4 Expression vector expressing APP695 construct...85
3.4.1 Primer design...85
3.4.2 Generation o f APP695 cDNA and expression v e c to r...85
3.4.3 Sequence alignm ent...86
3.5.1 Introdu ction ...90
3.5.2 Hygromycin B kill cu rve ...91
3.5.3 Generation of CHO cells stably expressing APP695, APP751 and APP770 using plREShyg2 expression ve cto r... 96
3.6 Quantification o f APP secretion... 105
3.7 Discussion... 107
Chapter 4: Generation of CHO and HEK293 stably expressed APP695 APP751 and APP770 (pcDNA3.1)... 112
4.1 Expression o f APP695, APP751 and APP770 in CHO cells using the pcDNA3.1 expression vector... 112
4.1.1 Introduction...112
4.1.2 Geneticin kill curve fo r CHO...113
4.1.3 Generation of CHO cells stably expressing APP695 and APP751 using pcDNA 3.1 expression v e cto r...117
4.2 Expression of APP695, APP751 and APP770 by HEK293 cells using pcDNA3.1 expression vector... 125
4.2.1 Introduction...125
4.2.2 Geneticin kill curve for HEK293... 126
4.2.3 Generation of HEK293 stably expressed APP695, APP751 and APP770 using pcDNA3.1 expression v e c to r... 130
4.3 Discussion... 140
Chapter 5: Effects of foetal bovine serum on HEK293 cells transfected with APP isoforms... 144
5.1 In tro d u ctio n ... 144
5.2 Effects of FBS in cell culture medium on cell num ber... 146
5.3 Effects o f FBS in cell culture medium on APP secretion... 154
5.4 Effects o f FBS in cell culture medium on APP mRNA le v e l...167
5.4.2 Primer efficiency...170
5.4.3 Effects o f FBS on APP mRNA level...177
5.5 mRNA: protein ra tio ... 184
5.6 Discussion... 185
Chapter 6: Effects of 2-Deoxy-D-glucose on APP secretion in HEK293 cells transfected with APP isoforms... 189
6.1 In tro d u ctio n ... 189
6.2 Effects o f 2DG in cell culture medium on cell num ber...193
6.3 Effects o f 2DG in cell culture medium on APP secretion...203
6.4 Effects o f 2DG in cell culture medium on APP mRNA le vel... 216
6.5 mRNA: protein ra tio ... 223
6.6 Discussion... 224
Chapter 7: General discussion...227
7.1 To provide an appropriate model o f APP processing fo r pathological study o f Alzheimer's disease... 227
7.2 To confirm the use of novel antibodies fo r the detection o f secreted human APP expression... 228
7.3 Efficiency o f mRNA translation by each isoform of APP... 229
7.4 To investigate the hypothesis that APP secretion of one o f these APP isoforms (APP695, APP751 and APP770) is more likely to be affected by stress. 232 7.5 Future w o rk... 236
7.6 Final conclusion...237
Table of Figures
Figure 1.2.1 The main classical pathological hallmarks of Alzheimer's disease; amyloid
plaque and neurofibrillary tangle...4
Figure 1.2.2 Different types of amyloid plaque; diffuse plaque, burnt-out plaque and neuritic plaque...5
Figure 1.2.3 The relationship between microtubule and tau protein...7
Figure 1.3.1 The three main isoforms o f amyloid precursor protein; APP696, APP751 and APP770... 11
Figure 1.3.2 The organisation o f secretases including a-secretase, (3-secretase and part o f y-secretase; Presenilin and Nicastrin...13
Figure 1.3.3 The processing pathway of amyloid precursor protein (APP)... 14
Figure 1.3.4 The y-secretase complex; presenilin 1 & 2, anterior pharynx defective 1, presenilin enhancer 2 and nicastrin... 17
Figure 1.6.1 The order of events occurring in amyloid hypothesis... 35
Figure 2.15.1 A plate set up fo r limited dilution cloning procedure in a 96-well plate..55
Figure 2.19.1 Antibodies used in imm unoprecipitation and im m m unoblotting procedure. Antibodies recognition o f APP... 59
Figure 2.22.1 The mechanism of action o f Taqman probe in real-time RT-PCR... 62
Figure 2.22.2 Quantitative real-time RT-PCR semi-log graph consisted of exponential phase and plateau phase...63
Figure 2.24.1 Table reference genes analyzed fo r expression stability in gene expression experiments...66
Figure 2.24.2 SYBR green® real-time RT-PCR thermocycler protocol... 67
Figure 2.26.1 The thermocycle used fo r TaqMan® real-time RT-PCR... 70
Figure 3.2.1 Table stating prim er names, sequences and purposes... 76
Figure 3.2.2 The purified plasmid using QIAprep Spin M iniprep Kit® on 1% agarose gel. ... 77
Figure 3.2.3 The restriction enzyme digestion o f plasmid DNA containing APP770 sequence...78
Figure 3.2.4 The alignments of the reference human APP770 obtained from EMBL online database and the results obtained from sequencing...79
Figure 3.3.1 APP751 fragments generated by Touchdown PCR... 82
Figure 3.3.3 The alignments o f the reference human APP751 obtained from the EMBL
online database and the sequencing results...84
Figure 3.4.1 APP695 fragments generated by Touchdown PCR... 87
Figure 3.4.2 The assembly o f tw o of APP695 fragments by Overlap Extension PCR 88
Figure 3.4.3 The alignments between the reference human APP695 obtained from
EMBL online database and the sequencing results obtained from sequencing... 89
Figure 3.5.1 The plREShyg2 vector map w ith restriction sites...92
Figure 3.5.2 CHO cell viability during hygromycin B kill curve... 94
Figure 3.5.3 Protein analysis using DE2 antibody against processed pooled selective
media o f secreted APP by plREShyg2 transfected CHO cells over 96-hour incubation
period in 6-well plates... 98
Figure 3.5.4 Protein analysis of secreted APP by plREShyg2 transfected CHO cells in
complete medium w ith DE2 antibody... 100
Figure 3.5.5 Protein analysis of secreted APP by plREShyg2 transfected CHO cells in the
complete medium w ith DE2 antibody... 102
Figure 3.5.6. Protein analysis of secreted APP by plREShyg2 transfected CHO cells in the
complete medium w ith 993 antibody... 103
Figure 3.5.7 Protein analysis of secreted APP by plREShyg2 transfected CHO cells in the
complete medium w ith 23/2 antibody... 104
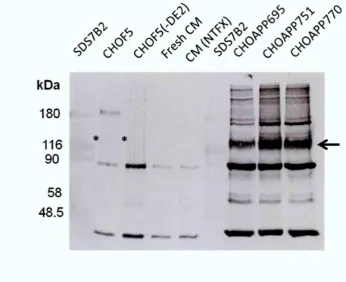
Figure 3.6.1 Quantification of secreted APP using conditioned culture medium of
CHO770H4...106
Figure 3.7.1 The confirm ation o f APP 695, APP751 and APP770 cDNA visualised on 1%
agarose gel... 108
Figure 4.1.1 The vector map of pcDNA3.1 w ith restriction sites...114
Figure 4.1.2 CHO cells viability during geneticin kill curve... 115
Figure 4.1.3 Protein expression analysis of secreted APP by APP695 pcDNA3.1
transfected CHO cells in the culture medium w ith four primary antibodies; DE2, 1151,
993 and 23/2... 119
Figure 4.1.4 Protein expression analysis o f secreted APP by APP751 pcDNA3.1
transfected CHO cells in the culture medium w ith four primary antibodies; DE2, 1151,
Figure 4.1.5 Protein expression analysis o f secreted APP by APP770 pcDNA3.1
transfected CHO cells in the culture medium w ith four primary antibodies; DE2, 1151,
993 and 23/2...123
Figure 4.2.1 HEK293 cells viability during geneticin kill curve... 128
Figure 4.2.2 Protein expression analysis of secreted APP by APP695 pcDNA3.1
transfected HEK293 cells in culture medium w ith four primary antibodies; DE2, 1151,
993 and 23/2...133
Figure 4.2.3 Protein expression analysis of secreted APP by APP751 pcDNA3.1
transfected HEK293 cells in culture medium w ith four primary antibodies; DE2, 1151,
993 and 23/2...135
Figure 4.2.4 Protein expression analysis o f secreted APP by APP770 pcDNA3.1
transfected HEK293 cells in culture medium w ith four primary antibodies; DE2, 1151,
993 and 23/2...137
Figure 4.2.5 Protein analysis of secreted APP by HEK293 transfected pcDNA3.1
expression vector containing APP695, APP751 and APP770 cDNA, in selective culture
medium over a 24-hour period w ith four primary antibodies; DE2, 1151, 993 and 23/2.
...139
Figure 5.2.1 Overview of cell count data as mean ± SEM which were sub-grouped
according to variable factors; cell types and concentration o f FBS in culture medium.
...149
Figure 5.2.2 Non-transfected 293 cells cultured in medium containing various
concentrations of FBS: (a) 0%, (b) 1%, (c) 5% and (d) 10%...150
Figure 5.2.3 HEK695.C5 cultured in medium containing various concentrations o f FBS:
(a) 0%, (b) 1%, (c) 5% and (d) 10%...151
Figure 5.2.4 HEK751.C1 cultured in medium containing various concentrations o f FBS:
(a) 0%, (b) 1%, (c) 5% and (d) 10%...152
Figure 5.2.5 HEK770.C6 cultured in medium containing various concentrations o f FBS:
(a) 0%, (b) 1%, (c) 5% and (d) 10%...153
Figure 5.3.1 Protein analysis o f APP secretion by non-transfected HEK293 cells which
were cultured in medium containing varying concentrations of FBS: 0%, 1%, 5% and
10% over 24-hour period w ith four primary antibodies; (a) 1151, (b) 993, (c) 23/2 and
Figure 5.3.2 Protein analysis o f APP secretion by HEK695.C5 cells which were cultured
in medium containing varying concentrations of FBS: 0%, 1%, 5% and 10% over a
24-hour period w ith four primary antibodies; (a) 1151, (b) 993, (c) 23/2 and (d) DE2 159
Figure 5.3.3 Protein analysis o f APP secretion by HEK751.C1 cells which were cultured
in medium containing varying concentrations of FBS: 0%, 1%, 5% and 10% over a
24-hour period w ith four primary antibodies; (a) 1151, (b) 993, (c) 23/2 and (d) DE2 160
Figure 5.3.4 Protein analysis of APP secretion by HEK770.C6 cells which were cultured
in medium containing varying concentrations of FBS: 0%, 1%, 5% and 10% over
24-hour period w ith four primary antibodies; (a) 1151, (b) 993, (c) 23/2 and (d) DE2 161
Figure 5.3.5 The APP secretion level as mean ± SEM. (a) the APP secretion (a.u.) o f each
cell typ e ... 162
Figure 5.3.6 The APP secretion level as mean ± SEM: cell types... 163
Figure 5.3.7 The APP secretion level as mean ± SEM: concentration of FBS... 165
Figure 5.4.1 The reference genes transcript stability assessments...169
Figure 5.4.2 Standard curves o f primer efficiency using diluted cDNA obtained from non-transfected HEK293... 172
Figure 5.4.3 Standard curves o f primer efficiency using diluted cDNA obtained from HEK695.C5...173
Figure 5.4.4 Standard curves of primer efficiency using diluted cDNA obtained from HEK751.C1...174
Figure 5.4.5 Standard curves o f primer efficiency using diluted cDNA obtained from HEK770.C6... 175
Figure 5.4.6 Summary of R2 values and slopes from semi-log graphs using data obtained from real-time RT-PCR... 176
Figure 5.4.7 The APP mRNA level results as mean ± S.E.M.: cell types...180
Figure 5.4.8 The APP mRNA level results as mean ± S.E.M.: concentrations o f FBS. .. 182
Figure 6.1.1 A simplified overview o f glucose metabolism pathways... 192
Figure 6.2.1 Cell count data as mean ± SEM. Each graph illustrated each concentration o f 2DG in culture medium; (a) 5 mM, (b) 25 mM and (c) 50 m M ...197
Figure 6.2.3 Photographs of non-transfected HEK293 cells which were cultured in
culture medium containing various concentrations o f 2DG; (a) control, (b) 5 mM, (c) 25
mM and (d) 50 m M ... 199
Figure 6.2.4 Photographs o f HEK695.C5 cells which were cultured in culture medium containing various concentrations of 2DG; (a) control, (b) 5 mM, (c) 25 mM and (d) 50 m M ...200
Figure 6.2.5 Photographs of HEK751.C1 cells which were cultured in the culture medium containing various concentrations o f 2DG; (a) control, (b) 5 mM, (c) 25 mM and (d) 50 m M ... 201
Figure 6.2.6 Photographs o f HEK770.C6 cells which were cultured in the culture medium containing various concentrations of 2DG; (a) control, (b) 5 mM, (c) 25 mM and (d) 50 m M ... 202
Figure 6.3.1 Protein analysis of secreted APP by non-transfected HEK293 cells which were cultured in culture medium containing various concentrations o f 2DG; 5 mM, 25 mM and 50 mM over 24-hour period w ith four primary antibodies; (a) 1151, (b) 993, (c) 23/2 and (d) DE2... 207
Figure 6.3.2 Protein analysis of secreted APP by HEK695.C5 which were cultured in culture medium containing various concentration o f 2DG; 5 mM, 25 mM and 50 mM over 24-hour period w ith four primary antibodies; (a) 1151, (b) 993, (c) 23/2 and (d) DE2... 208
Figure 6.3.3 Protein analysis o f secreted APP by HEK751.C1 which was cultured in culture medium containing various concentrations of 2DG; 5 mM, 25 mM and 50 mM over 24-hour period w ith four primary antibodies; (a) 1151, (b) 993, (c) 23/2 and (d) DE2... 209
Figure 6.3.4 Protein analysis of secreted APP by HEK770.C6 which was cultured in culture medium containing various concentrations o f 2DG; 5 mM, 25 mM and 50 mM over 24-hour period w ith four primary antibodies; (a) 1151, (b) 993, (c) 23/2 and (d) DE2... 210
Figure 6.3.5 The APP secretion level as mean ± SEM...211
Figure 6.3.6 The APP secretion level as mean ± S.E.M.: cell type...212
Figure 6.3.7 The APP secretion level as mean ± S.E.M.: concentrations of 2DG...214
Figure 6.4.1 The APP mRNA level as mean ± S.E.M.: cell types... 219
Figure 7.3.1 The first possible outcome of the further experiments with new clones.230
Figure 7.3.2 The second possible outcome of the further experiments with new clones.
...231
Figure 7.3.3 The third possible outcome of the further experiment with new clones.232
Figure 7.4.1 The possible mechanism of effects of FBS alteration and 2DG...234
Personal statement
First of all, I would like to thank my parents fo r their support both m entally and
financially, and fo r allowing me to become who I am today.
Secondly, I would like to thank my Director of studies, Professor David Parkinson who
gave me the PhD opportunity and fo r being so patient w ith me while I was adapting to
scientific research from my pharmacy background. Thirdly, I would like to thank my
BMRC colleagues fo r being helpful and sharing their thoughts and suggestions
throughout the PhD experience
Fourthly, I would like to thank:
Yu-Su Chen fo r creating the fun and crazy environment to keep me sane.
Umarat Srisawat fo r giving me academia and moral support (especially when
things were too difficult to explain in English).
Rachel Smith fo r the sneaky coffee break and moaning session.
Finally, I would like to personally thank Dr. Malcolm Lock fo r being so to le ra n t and
Chapter 1: Introduction
1.1 A lzheim er's disease
Alzheimer's disease (AD) is a major neurodegenerative disease of the elderly. AD
accounts fo r at least 60% o f dementia cases which makes AD the most common form
o f dementia (Causevic et al. 2011; Xu, Ferrari and Wang 2013). AD was fully described
in 1906 by German psychiatrist and pathologist, Alois Alzheimer. However, Alzheimer
published his finding which became public knowledge in 1907. In his publication, he
mentioned the case o f a 51 years old female patient, Auguste Deter whom at the tim e
experienced memory loss and disorientation to places and tim e. Her condition
deteriorated rapidly, she became bed-bound and passed away four and a half years
after the onset of her condition. At post-mortem examination o f Auguste Deter's brain,
Alzheimer discovered tw o major pathological hallmarks o f AD: neurofibrillary tangles
and amyloid plaques (Small, Klaver and Foa 2010).
1.1.1 Epidemiology
According to a consensus study in 2005 on the prevalence and incidence o f dementia,
there were 24.3 million people in the world who have dementia and there were 4.5
million new cases per year (Ferri et al. 2005). However, the estimation o f the number
o f people w ith dementia around the globe was changed to 44.4 million in 2013 and
this number was predicted to double every 20 years. It was estimated th a t there will
be 75.6 million people living w ith dementia in 2030 and 135.5 million in 2050. Among
these numbers more than tw o thirds are associated with AD and almost 62% o f the
cases live in developing countries such as China and India (Alzheimer's disease
international 2014). In addition, there are more than 850,000 people in the UK
currently living w ith dementia (Alzheimer's Society 2015).
The prevalence of AD correlates w ith age which means the prevalence doubles every 5
years after the age of 65 and the prevalence increases from 3% in 65-74 year old the
elderly to 50% in the elderly older than 85. Due to prevalence rates of AD consistently
process (Castellani, Rolston and Smith 2010; Xu, Ferrari and Wang 2013). Moreover,
the world population age structure has been undergoing significant changes from high
birth and m ortality rates to low birth and m ortality rates coupled w ith advances in
health care which increases life expectancy. As a consequence, while the total number
o f population has stopped growing, the ageing population is increasing markedly and
there has been sharp increase in the incidence of chronic diseases (Prince, Prina and
Guerchet 2013).
As a result of rapid growth of the ageing population, the demand in healthcare and
social services has also increased, which has caused significant impacts on national
economies. The total worldwide estimated cost of dementia in 2010 was 604 billion US
Dollars and 23 billion pounds in the UK alone in 2012 (Alzheimer's Society 2015; W imo
and Prince 2010). It is claimed that the changes in demography and its impact on
economies have turned dementia into one of many great challenges fo r the world
(Alzheimer's disease international 2014).
1.1.2 Clinical features
AD affects each individual in different ways however there are some common
patterns. The clinical manifestation o f AD typically begins w ith short-term memory
loss, disorientation to places and tim e, cognitive decline including not able to judge or
reason, having language difficulties, long-term memory loss and, finally, patients
become bed-bound due to m otor function activities impairment. At the same tim e,
patients might develop behavioral symptoms such as depression, anti-social behavior,
delusions or hallucinations (Forstl and Kurz 1999; Yiannopoulou and Papageorgiou
2013).
There are many possible causes o f dementia such as Alzheimer's disease, vascular
disease or Parkinson's disease therefore the National Institute o f Neurological and
Communicative Disorders and Stroke (NINCDS) and the Alzheimer' Disease and Related
Disorder Association (ADRDA) has established the criteria fo r staging the clinical
diagnosis of AD to distinguish AD causing dementia from others. These criteria were
described in 1984 and it has been known as NINCDS-ADRDA criteria until 2011. In
2011, the NINCDS and ADRDA revised and updated the criteria to take into account
o f AD. The latest criteria can not only be used as criteria for dementia caused by AD
but also all possible causes of dementia. Also it includes brain imaging, genetic and
biochemical understanding o f AD and neuropsychological assessment (Mayeux and
Stern 2012; McKhann et al. 2011).
According to the criteria from NINDCA-ADRDA in 2011, the AD dementia is classified
into one o f three categories: (1) Probable AD dementia, (2) Possible AD dementia and
(3) Probable or possible AD w ith pathological evidence. There are tw o sub-categories
in main criteria fo r probable AD dementia:
(1) "Probable AD dem entia" is used when a patient meets main dementia
criteria and has one of the following scenarios: long-onset symptoms,
pronounced signs of cognitive function deterioration, dem onstration of
cognitive deficiency by either amnestic or non-amnestic presentations and
absence o f medical history containing diseases which might possibly involve
dementia AD.
(2) Probable AD dementia couples w ith document represented reduction in
cognitive functions or a causative genetic mutation of AD.
The "possible AD dem entia" is classified into either atypical course or etiologically
mixed presentations. In order to be diagnosed as atypical course possible AD
dementia, a patient has to meet the main criteria set fo r probable AD dementia but
instead of long-onset of cognitive impairment, the patient has fast-onset of
impairment. If the patient has a medical history containing causative disease o f AD, the
patient is classified as etiologically mixed presentation of possible AD dementia.
Finally, the probable or possible AD dementia w ith pathological evidence is currently
1.2 Neuropathological hallm arks
The outstanding neuropathological changes in the brain of AD patients are amyloid
plaques and neurofibrillary tangles (see Figure 1.2.1) as first described by Alois
Alzheimer (Small and Cappai 2006). Also, there are other changes in the brain which
are considered to be m inor lesions namely cerebral amyloid angiopathy, synaptic
deficit and neuronal loss.
Amyloid plaque Neurofibrillary Tangle
Figure 1.2.1 The main classical pathological hallmarks of Alzheimer's disease;
amyloid plaque and neurofibrillary tangle (adapted from Colorado's Dementia News
and Resource Center 2014).
1.2.1 Amyloid plaques
Amyloid means a starch-like protein which is deposited in the liver, kidneys, spleen, or
other tissues in certain diseases and Plaque means a small, distinct, typically raised
patch or region on or w ithin the body resulting from local damage or deposition of
material. Therefore amyloid plaque means a deposition o f amyloid protein in the
organs and tissues in the body. Also, amyloid plaque, which is also known as senile
plaque, is one o f the major pathological hallmarks of AD (Ng and Chan 1993; Perl
2010). As shown in Figure 1.2.1, amyloid plaques are globular-like complex
extracellular structures which vary from 10- 200 pm in diameter. The plaque core
consists of 4 kDa protein which is known as Ap peptide. The amyloid plaques are
classified practically into diffuse plaques, neuritic plaques and burnt-o ut plaques
(Castellani, Rolston and Smith 2010; Perl 2010). The types of amyloid plaque are shown
With core
Without core
Diffuse plaque Burnt-out plaque Neuritic plaque
Figure 1.2.2 Different types of amyloid plaque; diffuse plaque, burnt-out plaque and
neuritic plaque (Murray et al. 2011).
The diffuse plaques are commonly found in the cerebral cortex region of the brain
w ith out the presence of dystrophic neurites and it is usually found in the brains o f
normal aged individuals. It was reported that the number of diffuse plaques
corresponded to the severity o f cognitive im pairment (Perl 2010). Also, diffuse plaques
are believed to occur early on in the progression of AD before turning into neuritic
plaques and this type of plaque exhibits no correlation to inflammation. The diffuse
plaques are highly varied in size w ith the inversion to the distribution. For example, the
smaller diffuse plaques tended to have higher distribution areas. The silver based
staining method is routinely used to identify the diffuse plaques (Castellani, Rolston
and Smith 2010).
The classical compact form of amyloid plaques is commonly known as a neuritic
plaque. The neuritic plaques vary from 10-50 pm in diameter (Castellani, Rolston and
Smith 2010). Similarly to other amyloid plaques, the core o f neuritic plaques is
composed of A(3 peptide. The A(3 peptide in the core of neuritic plaques are arranged
in a spiral form and surrounded by dystrophic neurites. Structurally, the neuritic
plaques exhibit a dense core, alteration of membrane and paired helical filaments. Also
neuritic plaques are positively stained by silver stain procedure (Perl 2010). Unlike
diffuse plaques, neuritic plaques showed a great relation to inflam m atory process due
to the presence of active microglia and astrocyte (Castellani, Rolston and Smith 2010).
The other type o f amyloid plaque is called burnt-out plaques. The outstanding feature
o f this type of plaques is a solely dense core w ith an absence of dystrophic neurites. It
1.2.2 Neurofibrillary tangles
Apart from amyloid plaques in the brains o f patients w ith Alzheimer's disease, another
crucial neuropathological hallmark of AD is neurofibrillary tangles (NFTs) which are
often found mainly in the cerebral cortex and large pyramidal neurons o f Ammon's
horn in the hippocampus (Castellani, Rolston and Smith 2010; Causevic et al. 2011).
The NFT is an intracellular aggregation o f hyperphosphorylated m icrotubule-related
protein (MAP) tau. NFTs start to develop inside neurons which slowly and eventually
fill the intracellular space causing neuronal cell death. However, these dead neuronal
cells still maintain their external and internal morphology and they are called ghost
tangles (Bhatia and Hall 2013; Yates and McLoughlin 2007). The main component of
NFTs is several 80 nm diameter paired helical filament. Although tau protein is the
main component o f NFTs, there are several other proteins involved in NTFs form ation
including Ap peptide and ubiquitin (Yen et al. 1995). Under normal conditions tau plays
roles in microtubule structural stabilization and functional maintenance. As
microtubules are responsible fo r neuronal and axonal transportation, therefore tau is
indirectly responsible fo r those functions (Brunden et al. 2010). The proline directed
serine-threonine protein kinase and non-proline directed protein kinase are the tw o
main kinases involved in tau phosphorylation. The glycogen synthase kinase (GSK3)
and cyclin dependent kinase 5 (cdk5) are the most frequently m entioned proline
directed serine-threonine protein kinase and the protein kinase A, B and C are the
most common non-proline directed protein kinases. The balance between the
phosphorylation and dephosphorylation of tau designates the normal physiological
functions of tau. Therefore, the aberrant and unusual phosphorylation of tau results in
increased paired helical filaments form ation and self-aggregation, indirect disruption
o f m icrotubule functions and biological activity impairment including an ability to bind
to microtubules, as shown in Figure 1.2.3 (Iqbal et al. 2010; Obulesu, Venu and
Somashekhar 2011). Also, it was reported that phosphorylated tau showed higher
potential fo r fib ril form ation (Brunden et al. 2010). In addition, NFTs can be visualized
D estab ilized M ic ro tu b u le s
M ic r
Kinases
P hosphatases
J
%
P aired H elic al F ila m e n ts P h o sp h o rylated TAU
P ro te in
Figure 1.2.3 The relationship between microtubule and tau protein. Under the
normal conditions, tau protein stabilises m icrotubule which facilitates axonal
transportation. Once tau protein is phosphorylated, the m icrotubule is destabilised.
The phosphorylated tau proteins start to aggregate and form Paired Helical Filament
(PHF) which is the main component o f neurofibrillary tangle (NTF) (adapted from de
Paula et al. 2009).
The longest form o f tau protein could potentially carry up to 80 phosphorylation sites
(Kolarova et al. 2012). It was observed that the NFTs in the brain of AD patient
contained almost nine phosphates per molecule o f protein which is approxim ately
three times higher than the healthy brains of the control subjects (Wang et al. 2013).
Also, it was reported that cdk5 and GSK3 phosphorylated of Thr231 and Ser235 were
the starting point in paired helical filam ent form ation in AD (Obulesu, Venu and
Somashekhar 2011). The work by Eva Braak and co-workers has pioneered the
relationship between tau and AD pathogenesis by showing the strong correlation
between the clinical manifestation of AD and NFTs lesions (Bhatia and Hall 2013).
Although the development o f NFTs found strictly correlated to the severity o f cognitive
impairment, it is not limited only to AD as it was also found in other
neurodegenerative disease including Parkinson's disease, Down's syndrome and Pick's
1.2.3 Cerebral amyloid angiopathy
The Cerebral Amyloid Angiopathy (CAA) was first described by Gustav Oppenheim in
1909. At the tim e he discovered necrosis in the brain parenchyma and capillary walls at
the post-mortem examination o f AD patients w ith clinical manifestations which later
established CAA: the complex diversity of biochemical and genetic disorders in the
central nervous system (Biffi and Greenberg 2011). The term CAA is also used to
describe amyloid deposition in the walls of small and medium sized cerebral blood
vessels, especially arteries and arterioles (Ghiso et al. 2010; Resink et al. 2003).
Practically, CAA is characterized by a positive staining w ith Congo-red dye which gave
rise to an alternative name of CAA; Congophilic Angiopathy. Like neurofibrillary
tangles, the CAA is common among aged-individuals. It is found in both familial and
sporadic cases and it is not specific to AD (Attems et al. 2011). However, the
researchers paid little to no attention to CAA in the pathogenesis o f AD. More recently,
CAA is considered to be one of the main contributors to AD pathogenesis (Arvanitakis
et al. 2011).
In general, the main component of CAA is the short form o f Ap peptide; A(340 and the
Ap40/ Ap42 ratio obtained from CAA is greater than the one obtained from amyloid
plaques (Attems et al. 2011). Although CAA is found in both cerebral blood vessels and
brain parenchyma, they can be distinguished by the distribution pattern and the A(3
peptide form . For example, the deposition in the brain parenchyma composes mainly
o f A(342 and the cerebrovascular deposition consists of A(340 as the main com ponent
(Ghiso et al. 2010). Pathologically, the CAA begins w ith the small am ount o f Ap peptide
deposition on the wall o f blood vessels in the brain and at this stage the deposition
neither blocks vessels lumen nor interferes w ith its biological functions (Perl 2010).
Once the degree of deposition increases to moderate or severe, the blood vessel walls
are thickening or thinning and the lumen of the vessels are either bigger or smaller,
depending on severity of deposition. For instance, the moderate deposition, the blood
vessel wall was thickened and the lumen appears smaller due to the blockage, while
the wall was thinned and the lumen appeared bigger in severe deposition (Attems et
al. 2011). In brief, the beginning of Ap deposition causes the thickening o f vessel walls
which causes the size reduction of vessel lumen, whereas the continuous deposition of
lumen (Attems et al. 2011). The histochemistry procedure using Congo-red or
Thioflavin S, or the immunhistochemistry procedure using Ap peptide antibody are
required to visualize the CAA (Attems et al. 2011; Perl 2010). In addition, it was
reported that around 30% o f individuals age over 60 years old have CAA while up to
90% o f diagnosed AD patients exhibited CAA.
1.2.4 Synaptic deficits and neuron loss
Neuronal cell death and synaptic loss were found throughout the area where the
deposition of amyloid p peptide (AP) and neurofibrillary tangles were observed (Yates
and McLoughlin 2007). It has been reported that patients w ith AD showed an
exaggeration o f Ap related to intricate neuronal dysfunction. For example, amyloid
plaque reduced the strength and plasticity o f glutamatergic synaptic transmission
(Palop and Mucke 2010). Moreover, the previous study on APP transgenic mice
showed th a t the magnitude of neuronal loss is correlated to the number o f amyloid
plaques in the brain. (Bayer and W irths 2010).
Learning and memorising functions require long-term potentiation o f transmission
(LTP) at synapses which mainly takes place in hippocampal area. In mouse model-A(3-
induced Alzheimer's disease showed an im pairment of hippocampal long-term
potentiation transmission. The recent study revealed that NMDA receptor is
responsible fo r the loss of an essential protein which is involved in the synaptic
process. Under normal conditions, NMDA receptor is responsible fo r inducing LTP and
memory development. Also an increased A(3 level suggested intercellular synaptic loss
which corresponded to the severity of cognitive impairment in humans (Malenka and
M anilow 2011).
1.3 Am yloid precursor p rotein
1.3.1 Amyloid precursor protein
The amyloid precursor protein (APP) is a type 1 transmembrane protein comprised o f a
large extracellular N-terminal domain, a hydrophobic transmembrane domain and a
reticulum to the cell surface to be modified either by glycosylations or
phosphorylations before being proteolysed by secretase or re-internalised into the
endosomal com partm ent (O'Brien and Wong 2011).
Amyloid precursor protein (APP) expresses in several organs and tissues (Nalivaeva and
Turner 2013). Several isoforms of APP ranging from 365 to 770 amino acid remnants
result from the alternative splicing w ithin 18 exons o f amyloid precursor protein (APP)
by secretases, three o f which are the most common in Alzheimer's disease; APP695,
APP751 and APP770, as shown in Figure 1.3.1. The APP isoforms are distinguished by
both expression and structure (Zheng and Koo 2011).
Although the expression level o f APP in the brain varies between regions, the
expression level o f APP695 is significantly higher in comparison to APP751 and APP770.
The mRNA ratio between different isoforms o f APP is APP695: APP751: APP770 = 20:
10: 1 (Nalivaeva and Turner 2013). Also, the APP695 is mainly expressed in the CNS
while the APP751 and APP770 are mainly expressed in non-neuronal tissues. (Cappai
2014; Nalivaeva and Turner 2013; O'Brien and Wong 2011; de Silva et al. 1997).
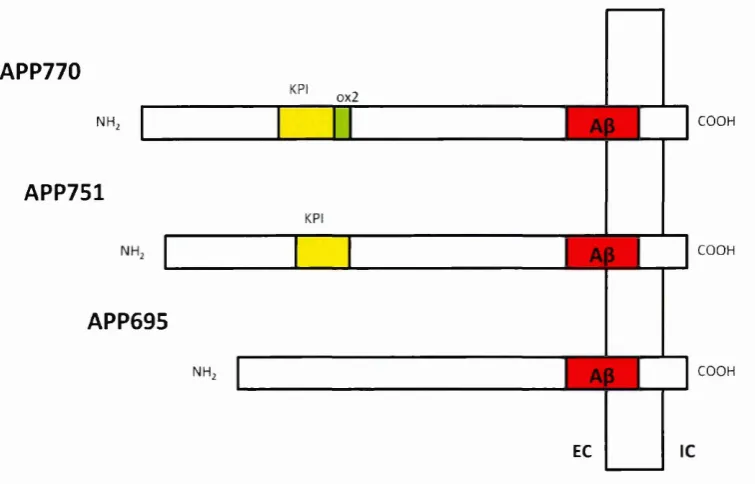
All three main isoforms of APP contain A|3 domain at exon 16 and 17. Structurally, they
are distinguished by the presence and/or the absence o f exon encoding a 56-amino
acid Kunitz protease inhibitor (KPI domain) and/or exon 8 encoding a 19-amino acid
OX2 domain, which shares the similar sequence to thymus-derived lymphoid cells
(Belyaev et al. 2010; Preece et al. 2004; de Silva et al. 1997). The APP770 contains both
KPI and OX2 domains while the APP751 contains only KPI domain. Both KPI and OX2
domains are absence in APP695 (Zhang et al. 2012). The KPI domain has been
suggested to play role in blood coagulation and wound repair based on the highly
expressed of APP751 and APP770 in platelets (Dawkins and Small 2014). Also, the KPI
domain has been suggested to play role in dimerization and processing o f APP (Khalifa
et al. 2012). The 0X2 domain has been suggested to play role in cell-surface binding
and recognition since it contains immunoglobulin loops which are com monly found in
cell surface receptor (Dawkins and Small 2014).
APP is a member of a fam ily o f related proteins including amyloid precursor-like
proteins 1 and 2 (APLP1 and APLP2) in mammals and amyloid precursor protein-like
(APPL) in Drosophilia. Also members o f this protein family share the same conserved
domains among them such as E l and E2 which are located in extracellular N-terminal
part o f APP. The E l domain is believed to be involved in the dimerisation of APP and
APLPs but there has been no solid evidence to suggest the function o f E2 domain.
However, APP is the only member of this protein family that contains the
amyloidogenic A(3 sequence (O'Brien and Wong 2011; Zheng and Koo 2011; Zhang et
al. 2012).
APP770
KPI 0x2
COOH NH2
APP751
KPI
COOH
APP695
COOH NH2
EC
Figure 1.3.1 The three main isoforms of amyloid precursor protein; APP696, APP751
and APP770. The APP770 contains tw o additional domains which are Kunitz-type
serine protease inhibitor (KPI) and 0X2 domains while APP751 only contains one
additional domain; the KPI domain and there is no additional domain found in APP695.
1.3.2 Proteolytic processing of APP
Neurons do not only have a large capacity when it comes to producing APP but have
the ability to metabolize APP prom ptly as well (Lee et al. 2008). Once APP is produced,
it is categorized in the endoplasmic reticulum and Golgi before being packed and
distributed to axon and synaptic term inal via fast axonal transport. The tw o main vital
steps in APP processing take place at the cell surface and in the trans-Golgi netw ork
(TGN). In brief, APP on the cell surface is either cleaved by a-secretase then
y-secretase, which does not result in A3 fragment form ation, or reinternalised into an
endosomal com partm ent which contains 3“ and y-secretase, which generates the A3
fragment. The A3 fragment is then transported to the extracellular space. On the other
[image:28.613.93.471.153.395.2]hand, APP processing which occurs at the TGN is simpler than the process at the cell
surface. APP from TGN is either transported directly to the cell surface or to an
endosomal com partm ent; the latter is mediated by retromers (O'Brien and Wong
2011).
Amyloid 3 peptide (Ap) is the major constituent o f amyloid plaques in the brains o f AD
patients. Ap consists of 39-43 amino acids and the most common form is Ap40 but
Ap42 is considered to play a crucial role in plaque development. Also there are a
number of studies which suggested that Ap42 is the most abundant in plaques and it
also has greater potential to aggregate, oligomerise and form fibrils in comparison to
A|340. These accumulations may cause deleterious effects to neurons (Vetrivel and
Thinakaran 2010; Zheng and Koo 2011).
As already mentioned, APP is metabolically processed by different secretases, mainly
a-, p- and y-secreatase (see Figure 1.3.2), at different subcellular sites via either
amyloidogenic or non-amyloidogenic pathways as shown in Figure 1.3.3.
The non-amyloidogenic pathway mainly occurs at the cell surface due to the
availability o f the secretases. In this pathway, APP is initially cleaved by a-secretase at
Ap sequence (between lysine 16 and leucine 17) resulting in the release o f the soluble
APPa (sAPPa) fragment into the extracellular matrix (Anderson et al. 1991; Sisodia et
al. 1990). Cleavage o f APP by a-secretase is the main and universal pathway o f APP
metabolism in most cells (Ling, Morgan and Kalsheker 2003). The a-secretase is a
membrane bound enzyme and mainly works at the cell surface (Sisodia 1992). Also it
has been reported that several zinc metalloproteinases share similar functions to a-
secretase. In other words, the enzymatic activity o f a-secretase is being shared by a
group o f the disintegrin and metalloproteinase (ADAM) family such as ADAM 9, ADAM
10 and ADAM 17 (Allinson et al. 2003; Haass et al. 2012). The remaining membrane-
associated C-terminal fragment, which contains 83 amino acids (so called C83), is then
cleaved by y-secretase in the transmembrane region o f APP resulting in 3 kDa p3
fragment and APP intracellular domain (AICD). Moreover, 3 kDa p3 fragm ent does not
play role in pathogenesis o f AD (Cao and Sudhof 2001; Haass et al. 1993; Hartmann
In the amyloidogenic pathway, APP is initially cleaved at the extracellular domain of
the N-terminal of the A(3 sequence, at amino acid +1 or +11 sites, by p-secretase
resulting in the release of soluble APPp into the extracellular matrix (Vassar et al.
1999). The remaining membrane-associated C-terminal fragment, which contains 99
amino acids (so called C99), is then cleaved by y-secretase generating Ap fragm ent and
AICD (Annaert and De Strooper 2002).
Unlike the non-amyloidogenic pathway that mainly occurs at the cell surface, the
amyloidogenic pathway involves trafficking APP through endosomal com partm ent
which contains p- and y- secretase (Thinakaran and Koo 2008). Even though the
m ajority of APP is believed to go to the cell surface, there is only a limited number of
APP molecules detected on the cell surface despite its very fast processing (O'Brien
and Wong 2011). Also, increased a-secretase activity significantly reduces Ap fragm ent
generation hence plaque form ation both in vivo and in vitro, which suggests th a t APP
processing is a com petitive process (Nitsch et al. 1992; Postina et al. 2004). A fter all,
the balancing of APP processing might play an im portant role in the development and
progression of AD.
P r c sc n ilin
P -s ec re tas e ( B A C E 1 )
T w o composition o f y-secretase
N ic a s trin
Figure 1.3.2 The organisation of secretases including a-secretase, p-secretase and
part of y-secretase; Presenilin and Nicastrin (adapted from Ling, Morgan and
A Nonamyloidogenic
SP KPI
SP KPI
SP ^ _ KPI
B Amyloidogenic
Figure 1.3.3 The processing pathway of amyloid precursor protein (APP). (A) Non-
amyloidogenic pathway, the APP is cleaved by a- and y-secretase, respectively which
generates soluble APPa and a small non-toxic fragment; p3. (B) Amyloidogenic
pathway, the APP is cleaved by (3- and y-secretase, respectively which generates
soluble APP3 and A3 peptides (Portelius et al. 2008).
1.3.2.1 a-secretase
Several proteins have been identified to have a-secretase-like activity and they belong
to a disintegrin and metalloproteinase (ADAM) family including ADAM9, ADAM10 and
ADAM17 (Zhang et al. 2012). Also, the ADAMs family of integral membrane protein
belongs to the zinc protease super family which means members of this fam ily are
characterized by a metalloproteinase domain, integrin receptor binding activity and a
cytoplasmic domain. The ADAMs fam ily has been suggested to play several roles such
as control o f cell migration, membrane fusion, growth factor and cytokine shedding
(Seals and Courtneidge 2003). Fundamentally, as previously mentioned, the m ajority of
a-secretase activity occurs at the cell surface whereas the regulated activity is mainly
located inside the Golgi (Ling, Morgan and Kalsheker 2003). The activity of a-secretase
in the Golgi is rather im portant since there is evidence suggesting a significant increase
in a-cleavage after the activation of protein kinase C; including an increase in APP
being transported to the cell surface, an increase in a-cleavage in TGN and an
inhibition o f re-uptake of cell surface APP into the endosomal com partm ent (O'Brien
and Wong 2011).
pathway
OX-2 a-SAPP
K-2 Full-length APP A|t domain
OX-2 p-sAPP
Ap(17) Ap (40/42)
AlCD
u-secretase a-CTF
770
0 ts t= O
|i-secretase p-CTF
i way
p-anryloid y-secretase aICD
ADAM9 is universally expressed in human tissues. Evidently, COS cells co-expressed
ADAM9 and APP then treated w ith phorbol ester have shown that ADAM9 cleaved
APP, specifically at the a-secretase site. Also, overexpression of ADAM9 in COS cells
increased sAPPa production which strongly suggested that ADAM9 has a-secretase
activity (Ling, Morgan and Kalsheker 2003; Seals and Courtneidge 2003).
ADAM10 is mainly localised to Golgi and TGN. However it was first isolated during
bovine myelin membrane preparation which later showed the ability to cleave APP at
a-cleavage site (Ling, Morgan and Kalsheker 2003). Moreover, HEK293 cells
overexpressed ADAM10 also showed a sharp increase in sAPPa production which
suggested the role of ADAM10 in a-secretase processing of APP. Also, increasing the
expression of SIRT1 (the ADAM10 gene expression regulator) in mice models has
shown a significant reduction of Ap fragment deposition alongside reduced cognitive
decline (O'Brien and Wong 2011).
ADAM17 is found in most tissues and is typically expressed in neurons, vascular cells
and leukocytes (Schlondorff, Becherer and Blobel 2000). It was originally identified as
the enzyme responsible fo r cleavage o f the membrane-bound pro-protein o f tum o r
necrosis factor a (TNF- a) hence it is also called tu m o r necrosis factor alpha converting
enzyme (TACE) (Ling, Morgan and Kalsheker 2003). Also a mouse model w ith ADAM17
deficit which showed signs o f EGF signalling defect confirming the role o f ADAM17 in
cleavage o f EGF fam ily member (Peschon et al. 1998)
1.3.2.2 p- secretase
p-secretase is a 501 amino acid ty p e l transmembrane aspartyl protease containing an
extracellular membrane active site (Zhang et al. 2012). Currently, there are tw o
enzymes which have been identified to act as p-secretase; p-site APP-cleavage
enzym el and 2 (BACE1 and BACE2, respectively) (Ling, Morgan and Kalsheker 2003).
Both BACEs require low pH conditions fo r its activity and are mainly expressed w ithin
endosome, TGN as well as on the cell surface (Vassar et al. 2009).
BACE1 cleaves APP at the aspartic acid 1 and glutamic acid 11 sites on the extracellular
domain suggesting it is a site specific protease. However, cleaving APP by BACE1 is
position 1, or vice versa, but human APP cannot be cleaved by murine BACE1 at
position 11 (Ling, Morgan and Kalsheker 2003). Moreover, the studies on BACE1
knockout mice showed that BACE1 is a neuronal p-secretase since neurons obtained
from mice do not produce Ap fragment but glia cells do. Although BACE1 is able to
cleave various substrates, its preferential substrate site would be acidic or contain
polar residues. It was suggested th a t BACE1 is a membrane bound protease and only
cleaves APP that is bound to membrane (Venugopal et al. 2008).
BACE2 is another enzyme which has been identified as a P-secretase. As a counterpart
enzyme o f BACE1, BACE2 share 71% homology and 45% identity w ith BACE1, but
BACE2 has much lower expression levels in the brain and it is mainly expressed in glia
cells (Zhang et al. 2012). Interestingly, instead of cleaving APP at amino acid position 1
or 11, BACE2 cleaves APP at amino acid position 19 or 20 which is in the middle o f the
A(3 sequence, resulting in a 79 amino acids C-terminal fragment, which does not
contribute to Ap generation (Venugopal et al. 2008).
1.3.2.3 y-secretase
y-secretase is a m ultiple-protein complex consisting of several units o f transmembrane
protein (see Figure 1.3.4); presenilin 1 (PS1) or presenilin 2 (PS2), nicastrin (Net),
anterior pharynx defective 1 (Aph-1) and presenilin enhancer protein 2 (Pen-2).
Essentially, in order to enable y-secretase activity, all four compartments are required
Presenilin 1&2 Extracellular Nicastrin
ooc
ooc
8 8 8 8 8 88
DOCCOCOOO
! « 8Intracellular
Endocytic cleavage site
Anterior pharynx defective 1 Presenilin enhancer 2
OOC
r
1
2
3 4 5 6
< 7
o
X JX>
&x>
ocxxx
m m «ccco;
2 O '*oooo
f r a BBSS
Figure 1.3.4 The y-secretase complex; presenilin 1 & 2, anterior pharynx defective 1,
presenilin enhancer 2 and nicastrin (Kopan and Hagan 2004).
PS1 and PS2, which consist o f 463 and 448 amino acids respectively, are comprised of
nine transmembrane units and intracellular N- and C- term inal (De Strooper, Iwatsubo
and W olfe 2012; Ling, Morgan and Kalsheker 2003). Not only do PS1 and PS2 share
76% homology but they both also have a big cytoplasmic loop between
transmembrane unit 6 and 7, which is cleaved during the post-translational process to
generate the N- and C-terminal fragments. Each o f these fragments contain aspartyl
residues required to activate the y-secretase activity (Small, Klaver and Foa 2010;
Zhang et al. 2012). Also both PSs are mainly detected in ER and Golgi.
Nicastrin (Net) is described as a type 1 transmembrane glycoprotein w ith a large
extracellular domain. After glycosylation, which is a part of m aturation o f Net
recognises and binds to the C-terminal fragment o f APP after either a- or (3- cleavage
(O'Brien and Wong 2011).
Anterior pharynx defective. 1 (Aph-1) consists o f seven transmembrane units w ith
cytoplasmic C-terminal. The main function of Aph-1 is to assemble prelim inary
structure y-secretase m ultiple-protein complex by interacting w ith im m ature nicastrin
and PSs. The complex is then transported from the ER to the TGN (O'Brien and Wong
Presenilin enhancer protein 2 (Pen-2) consists of 2 transmembrane units and it has a
hairpin-like shape w ith both N- and C- term ini in the extracellular space. The function
of Pen-2 in the complex is to facilitate the cleavage of PSs which generate essential isl
and C-terminal fragments required to initiate y-secretase activity activation process
(Zhang et al. 2012).
1.3.3 Function of APP and its derivatives
To date, the exact function of APP is still unclear but as its structure is significantly
similar to Notch, therefore one o f its proposed functions is as a cell surface receptor.
Besides, it has been reported that APP has effects on both health and growth in
transgenic mice, overexpressed wild-type APP and transient transfected cell lines.
According to the structure o f APP, the extracellular part contains tw o heparin-binding
domains which were suggested to be responsible fo r its bioactivity. Several proteins,
such as A(3 fragment or F-spondin, bind to extracellular part of APP resulting in APP
processing and downstream signalling modulation (O'Brien and Wong 2011; Zhang et
al. 2012). In 2004, Wang and Ha suggested that APP plays role in cell adhesion by
form ing parallel dimers facilitated neurite outgrowth and synaptogenesis. Also it was
shown that the expression of APP is not only different during the neuronal m aturation
and differentiation but also during traum atic brain injury (Corrigan et al. 2010; Wang
and Ha 2004).
It has been suggested that the soluble APPa (sAPPa) fragment, a product from non-
amyloidogenic processing pathway, has neuroprotective and neurotrophic properties
as well as the ability to regulate cell excitability and synaptoplasticity (Zhang et al.
2012). In 2007, the study showed that abnormalities occurred w ith mice caused by APP
deficiency were rescued using sAPPa alone, which suggested that nearly all o f APP
functions are initiated by its extracellular part (Ring et al. 2007). Not only are there 17
amino acid differences between sAPP(3 and sAPPa but they also function
contradictorily. G enerally,. sAPPP seems to lack the neuroprotective property.
Furthermore, it can act as a precursor of an N-terminal fragment which is able to bind
to Death Receptor 6 and activate caspase 6, causing axonal pruning and neuronal cell
Since the discovery o f relationship between A(3 and AD, AP has been the centre of
attention in pathological study of AD. So far, it has been reported that excessive
amount of Ap promotes cause neurotoxicity, neuronal tangle form ation, synaptic
damage and neuronal death (Zhang et al. 2012). Indeed, the combination o f low levels
o f APP fragments and the accumulation o f Ap may be an explanation fo r cognitive
decline in early onset AD (Turner et al. 2003). On the other hand, the recent studies
reported that by applying low concentrations of Ap fragments showed positive effects
on synaptic plasticity and memory.
As APP intracellular domain (AICD) degrades rapidly, it is virtually impossible to
conduct a physiological investigation in vivo, hence the m ajority o f inform ation on
AICD obtained from experiments based on exogenous system. AICD is a consequence
o f y-cleavage and its size could vary from 50 to 59 amino acids. It has tw o proposed
functions; transcriptional regulator and self-intracellular sorting regulator. There are
three conserved domains on AICD; YTSI, VTPEER and YENPTY. Each domain is
responsible in binding to different binding partners. For example, to become the
binding partner o f YENPTY requires the existence of phosphotyrosine interacting
domain (PID): the tw o best candidate binding partners o f YENPTY are Fe65 and X l l
(O'Brien and Wong 2011; Zhang et al. 2012). On its own, Fe65 induces transportation
o f APP to cell surface but together w ith AICD and Tip60, it facilitates the form ation o f
transcriptional active complex (Slomnicki and Lesniak 2008). The X l l binding partner is
found to reduce AP production by interacting w ith AICD. Also both Fe65 and X l l are
strongly expressed in the brain.
1.4 O ther pathologies associated in AD
Besides amyloid plaques and neurofibrillary tangles form ation, cerebral amyloid
angiopathy, synaptic and neuronal loss, neuronal inflammation, oxidative stress and
metallobiology are suggested to have significant contribution fo r AD pathogenesis.
1.4.1 Inflammation and AD
Inflammation is a biological process responding to self and non-self antigens. The aim
cells and tissues. The unsuccessful attem pt to get rid o f the antigen and restore
healthy cells and tissues could turn the inflammation into a chronic condition which
results in further deterioration of the surrounding area (Rubio-Perez and Morillas-Ruiz
2012). The inflam m atory process occurs in tw o phases; (1) acute inflam m ation where
the response to an antigen is short and aggressive, and (2) chronic inflam m ation where
there is a mild and continuous response to an antigen (Zotova et al. 2010). Moreover,
the acute phase clinically manifests w ith pain, swelling, redness and heat where
monocytes, macrophages in PNS or glia cells and astrocytes in CNS are the
inflam m atory features of chronic phase.
Evidently, the immune response involved in AD pathogenesis was observed since the
1980s when immune related molecules were found surrounding amyloid plaques in
the brains o f AD patients. Ten years later, the view on inflamm ation in CNS or
neuroinflam m ation was prom pted by the additional findings about the molecules
involved in the inflam m atory process. These molecules include com plim ent factors,
chemokine and cytokines (Zotova et al. 2010). As a result, the inflamm ation w ithin the
brain is classified as one of the pathological hall mark of AD. However, the clinical sign
o f acute inflamm ation phase is absent therefore the neuroinflam m ation is usually
referred to as chronic inflamm ation (Rubio-Perez and Morillas-Ruiz 2012).
It was believed that inflamm ation alone is more likely to contribute to the progression
o f AD rather than being the cause of AD itself. The inflamm ation is a response to the
insults, including infection which causes cell injury and necrosis (Rubio-Perez and
Morillas-Ruiz 2012). It was proposed that the inflamm ation participates in the
progression of the AD by (1) immediately acting in response to the changes and (2)
later persisting in response to the low-level of inflam m atory stimuli, such as A(3
plaques and NFTs, in the brain (Zotova et al. 2010). This concept is supported by
several studies. For example short-term infection initiated inflamm ation as a response
which in the AD patients, resulted in a rapid decline in cognitive functions which hardly
recovered to the point before infection had occurred, even after the infection was
treated (Perry, Cunningham and Holmes 2007). It was also reported th a t the level of
inflam m atory proteins increased prior to the onset o f clinical manifestation o f AD; or
inflam m atory features were mainly found in the AD affected area o f the brain
inflam m atory process in the brain and by activating these cells the pro-inflam m atory
molecules are produced (Rubio-Perez and Morillas-Ruiz 2012).
Microglia contribute approximately 10% of the total cell number in the nervous system
(Rubio-Perez and Morillas-Ruiz 2012; Wyss-Coray and Rogers 2012). One o f the crucial
roles of microglia is removing debris and dead neurons which results in brain
remodelling. The recent studies have shown that microglia repeat the housekeeping
routine every few hours. Also, microglia act as the first port o f call towards the
pathogens, cellular and tissue injury in order to maintain healthy brain condition. As
the activated microglia are able to remove detritus, it is often referred to as brain's
macrophage (Wyss-Coray and Rogers 2012). A reduction in microglia activation was
observed when the APP gene and APP processing were interfered w ith and the binding
o f A(3 peptide to microglia promotes chemokine and cytokine production (Rubio-Perez
and Morillas-Ruiz 2012). The microglia are able to produce several inflam m atory
factors including; cytokines, chemokines, reactive oxygen species, growth factors and
complement f