Assessment of Project Management Maturity of
Developers Organization in Construction Industry
Parth A. Pandya1, Mr. Ankitkumar S. Patel2
1
Department of Civil Engineering, Construction & Project Management, Parul Institute of Technology, Parul University, Vadodara, Gujarat, India
2
Department of Civil Engineering, U.V. Patel college of engineering, Ganpat University, Kherva, Gujarat, India
Abstract: In Any organizations, Maturity refers to a state that provides perfect condition to achieve organization’s objective. Project management maturity provides a path and framework which enable firms to achieve excellence in project management. Project management maturity has direct impact on project performance. Perfect level of maturity can lead an organization from their current position to their desired position & can help to achieve competitive advantage in market. The principal goal of this study was to determine the level of maturity of developer’s organization in Surat City in terms of project management process & to propose a mature model for the project success. This Study begins with the development of Organizational project management maturity model (OPM3) and an analysis methodology to assess the maturity of project management process. The project management maturity analysis methodology, consist of 76 multiple choice questions that measure project management maturity, and cover all the 14 knowledge areas from which 10 are taken from the PMBOK & rest 4 are from the literature review. The maturity model & methodology were then applied by benchmarking 45 different Developers organization. This assessment methodology provides solid and comparative studies in project management practice across industry and the companies. However, it is fair to say that many organization are uncertain, perplexed and even misdirected about the status of current applications of project management. Moreover, the financial investment in the project management tools, practice, and process is often seen as quite difficult to justify. From the Result of this study we can conclude that most of the works of Developer’s are managed as a project, improving the Developer’s project management capability can significantly contribute to the overall improvement of Developer’s Capability to deliver successful projects.
Keywords
: Project management maturity, Maturity Model, Organizational project management maturity model (OPM3), Construction
Management
I. INTRODUCTION
The construction industry plays significant role in the economy of developing countries. For example, in many developing countries, major construction activities account for about 80% of the total capital assets, 10 % of their GDP, and more than 50% of the wealth invested in fixed assets. In addition, the industry provides high employment opportunity, probably next after agriculture [(Ofori, 2006), (Jekale, 2004)]. Despite the construction industry’s significant contribution to the economy of developing countries and the critical role it plays in those countries‟ development, the performance of the industry still remains generally low. As (Idoko, 2008) noted, “…many projects in developing countries encounter considerable time and cost overruns, fail to realize their intended benefit or even totally terminated and abandoned before or after their completion …” Moreover, the development of the construction industry in developing countries generally lags far behind from other industries in those countries and their counter parts in developed nations. Generally, as [(Ofori, 2006) & (Jekale, 2004)] concluded, “The construction industry in developing countries failed to meet expectations of governments, clients and society as a whole”.[1]
Until few years ago, the concept of “maturity” was seldom used to describe the state of an organization’s effectiveness at performing certain tasks. Today, we find this maturity concept being used increasingly to map out logical ways to improve an organization’s services particularly across the software industry. Why has this evolved in this industry – why not in other areas? And why is this of interest to the project management profession? The answer to both of these questions rests in the underlying complexities that go into the successful completion of a project.[2]
II. DEFINITION&CONCEPTOFMATURITYMODEL
A. Definition
Maturity is where your project currently is and where it needs to reach to achieve its final goal.
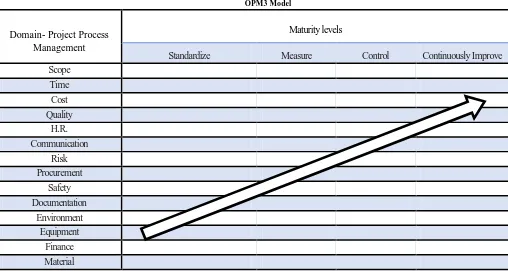
[image:2.612.38.546.163.434.2]B. Levels of maturity
TABLE I OPM3 Model
Domain- Project Process Management
Maturity levels
Standardize Measure Control Continuously Improve
Scope Time
Cost Quality
H.R. Communication
Risk Procurement
Safety Documentation
Environment Equipment
Finance Material
The proposed maturity Model (OPM3) has 4 levels,
Level 1- Standardize
Process governance
Polices
Documented Process
Communication/TrainingLevel 2- Measure
Focus process on customers
Identify what is critical about process
Measure process & their output directly
Ensure users understand the system of process
Measure inputs to processLevel 3- Control
Document process control plans
Implement process control plans
Demonstrate control with dataLevel 4- Continuously Improve
create a culture of improvement
Widespread participation
Integrate improvements with systemOPM3 Model Has 3 Interlocking Elements:
1. The Knowledge element describes organizational project management and organizational project management maturity, explains why they are important and how project management maturity can be recognized.
2. The Assessment element presents methods, processes and procedures that an organization can use to self-assess its maturity 3. The Improvement element provides a process for moving from its current maturity to increased maturity.
The Goals of OPM3 are to:
Assess organization's ability to implement strategic planning, when managing its portfolio of projects.
Provide tools to help businesses drive performance improvement.
Consolidate best practices for enterprise PM for individual projects.
These goals, even if not formalized within the organization, will likely be a valuable resource to assist the organization in adopting a project management.III. METHODOLOGY
Methodology contains literature review, preparation & validation of questionnaire, data collection & analysis. 10 Dimensions are taken from the PMBOK (Project Management Body of Knowledge) and further 4 Dimensions have been included with the assistance of the literature review.
14 dimensions (knowledge areas) are as follow, Project scope management
Project time management Project cost management Project quality management Project H.R. management
Project communication management Project risk management
Project procurement management Project safety management
Project documentation management
Dimensions that are added with the help of literature review, Project environment management
Project equipment management Project finance management Project material management
Questionnaire was made according to the OPM3 model and it contains 2 parts. Data collection was done by the questionnaire survey & Analysed by Frequency analysis.
Frequency Analysis: The study of quantitatively describing the characteristic of a set of a data called descriptive statistics. Frequency analysis is a part of descriptive statistics. In statistics, frequency is a number of times an event occurs. Frequency analysis is an important area of statistics that deals with the number of occurrence (frequency) and analyse measure of central tendency, dispersion, percentile etc.
Part 1- Percentage of importance of 14 Dimensions in project.
Table II
Dimension \ % 100 75 50 25 0
Example of Part I
In this, Respondent had to rate how much percentage of importance they feel for all 14 dimensions for any construction project. The choice of percentage varies from 0 to 100%, i.e. 0%, 25%, 50%, 75%, and 100%. Analysis is done with frequency analysis, Average of all respondent have been taken and then it is divided into four category. Example shown in Table 3.1
0 to 25 % - 1
25 to 50 %- 2
50 to 75 %- 3
75 to 100 %- 4
Part 2- Project Management Practice Maturity Questions.
In part 2 analysis, each dimensions (Knowledge area) is analyzed with the frequency analysis and on the basis of that analysis, maturity model has been created. The example of Part 2 analysis is shown in Table III.
Respondent had to Choose from the 4 option,
Poor- If the description is never followed. Above average- If the description is rarely followed. Very good- If the description is often followed. Excellent- If the description is always followed.
TABLE III
Example of Part 2 (Project Time Management)
Sr.no Description Not
followed
Rarely followed
Often followed
Always followe
d
1 Schedule plan prepared for the project
2 Use of WBS for defining the schedule activities
3 Preparing of estimation of needed resource (Material, Labour, and Equipment)
4 Preparing of historical data usage in
estimating activity duration
5 Monitoring, controlling & updating of project activities
6 Application of computer tools such as Microsoft project, Primavera, Excel etc. in scheduling. Yes then write the name of tool
[image:4.612.42.555.75.172.2]Validation of questionnaire: The validation of questionnaire is done by different field experts as well as strategic consultants.
Fig. 1. Maturity Rank
Time Cost Quality Risk
4 4 4
3
4 4
3
4 4 4 4
3 4
3
0 1 2 3 4
M
at
u
ri
ty
Le
ve
l
Project Management Process
Maturity Rank
Maturity Rank
2.7
2.9 3.4
AVG. MATURITY
C1 (50-150)CR C2 (151-250)CR C3 (>250)CR
Sample Size Determination: Selection can be definite as the process of selecting descriptive units of a population for the education
in the study analysis. The independent of the selection is to provide an applied means of assisting the data gathering and processing the modules of investigation to be approved out with ensuring that the sample provides a good demonstration of the people. A sample is a small quantity of the population designated for scrutiny and analysis. The sample was selected haphazardly from the population.
N (population) =50 Confidence level = 95% Standard deviation=0.5
Z score for 95% confidence level= 1.96
Necessary sample size (SS) = ( ) ∗ ∗( . )
( ) = 384
Adjusted sample size =
[ ] = 45
IV. RESULT & DISCUSSION
The analysis of part 1 is shown in fig 1, in which most of the developers thinks that the maturity must be vary from 3 to 4.
In the part 2 analysis, the developers are divided into 3 different category as per the scope of the work.
C1- 50 to 150 cr.
C2- 151 to 250 cr.
C3- >250 cr.
3.0 3.1 3.1 2.5
3.3 3.1
2.9 2.8 3.1 3.1 3.3 2.6
3.6 2.8
0.0 0.5 1.0 1.5 2.0 2.5 3.0 3.5 4.0
M
at
u
ri
ty
L
e
ve
l
Project Management Process
MATURITY
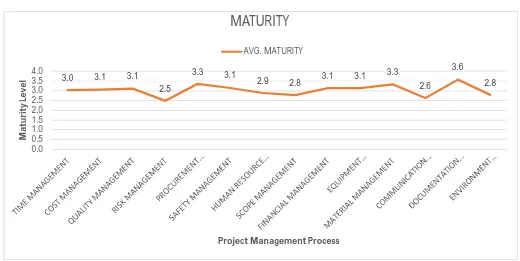
[image:6.612.45.565.336.597.2]AVG. MATURITY Fig. 2 Average Maturity
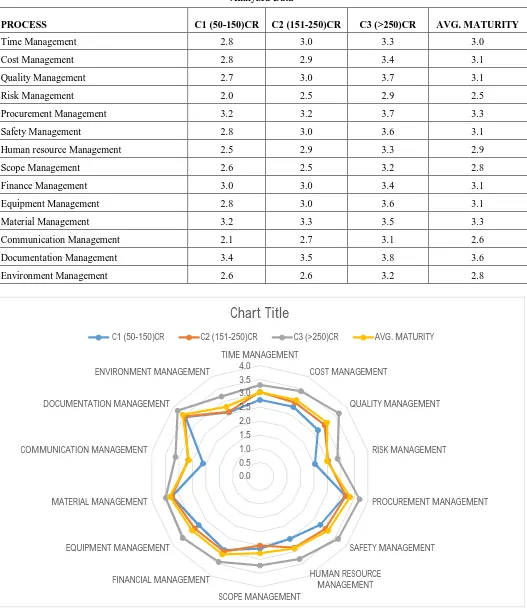
Fig. 3 Maturity Model
Analysis of each dimension is done and based on that the final maturity model has been made as appeared in figure 4.3. This will goes about as a measuring stick for an organization for better development. A developer’s organization can utilize this model to discover at which area they are progressing admirably and at which zone they are slacking.
2.8 2.8 2.7 2.0
3.2 2.8
2.5 2.6
3.0 2.8 3.2 2.1
3.4
2.6 3.0 3.1 3.1
2.5
3.3 3.1
2.9 2.8 3.1 3.1 3.3 2.6 3.6 2.8 0.0 0.5 1.0 1.5 2.0 2.5 3.0 3.5 4.0 M at u ri ty L e ve l
Project Management Process
C1 50-150 cr
C1 (50-150)CR AVG. MATURITY
3.0 2.9 3.0 2.5
3.2 3.0 2.9
2.5
3.0 3.0 3.3 2.7
3.5 2.6 3.0 3.1 3.1
2.5
3.3 3.1
2.9 2.8 3.1 3.1 3.3 2.6 3.6 2.8 0.0 0.5 1.0 1.5 2.0 2.5 3.0 3.5 4.0 M at u ri ty L e ve l
Project Management Process
C2 151-250cr
[image:7.612.44.562.98.683.2]C2 (151-250)CR AVG. MATURITY
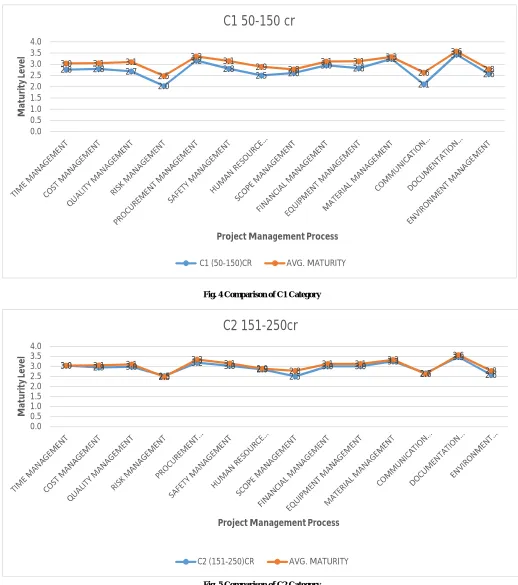
Fig. 4 Comparison of C1 Category
3.3 3.4 3.7 2.9
3.7 3.6
3.3 3.2 3.4 3.6 3.5 3.1 3.8
3.2 3.0 3.1 3.1
2.5
3.3 3.1
2.9 2.8 3.1 3.1 3.3
2.6 3.6
2.8
0.0 0.5 1.0 1.5 2.0 2.5 3.0 3.5 4.0
M
at
u
ri
ty
L
ev
el
Project Management Process
C3 >250cr
[image:8.612.48.574.104.396.2]C3 (>250)CR AVG. MATURITY
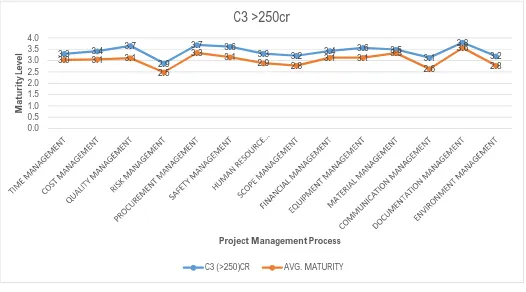
Fig. 6 Comparison of C3 Category
V. CONCLUSION
The main objective of this research was to assess the project management maturity of developer’ organization in construction industry. It helps to determine that how project management process in the organization can be improved by utilizing project management maturity model. The survey question was formed as, “how the project are executed and at what level of maturity the project are organized in developer’s organization?”
From the survey it is concluded that average project management maturity of developer’s organizations with annual turnover 50-150 cr, 151-250 cr & >250 cr are at level 3 which is control level. But it is seen that in all the categories of organization risk management, communication management, scope management & environment management is not fully acceptable and implemented.
The average maturity of organizations having annual turnover between 50-150 cr is 2.7 which is measure level, which shows that organization are not fully aware of the importance of the project management process which should be implemented in the project. In this the major focus of the organizations are on Time, cost, material, finance & document management only, rest of the areas are not fully implemented or accepted.
The average maturity of organizations having annual turnover between 151-250 cr is 2.9 which is also measure level, which shows that organization are partially aware of the importance of the project management process implemented in the project but though the process are not fully implemented. Even they have not given the adequate importance to Risk, Scope, Communication & environment management.
0.0 0.5 1.0 1.5 2.0 2.5 3.0 3.5 4.0
TIME MANAGEMENT
COST MANAGEMENT
QUALITY MANAGEMENT
RISK MANAGEMENT
PROCUREMENT MANAGEMENT
SAFETY MANAGEMENT
HUMAN RESOURCE MANAGEMENT SCOPE MANAGEMENT
FINANCIAL MANAGEMENT EQUIPMENT MANAGEMENT
MATERIAL MANAGEMENT COMMUNICATION MANAGEMENT
DOCUMENTATION MANAGEMENT
ENVIRONMENT MANAGEMENT
Chart Title
[image:9.612.44.571.105.719.2]C1 (50-150)CR C2 (151-250)CR C3 (>250)CR AVG. MATURITY
TABLE IV
Analyzed Data
PROCESS C1 (50-150)CR C2 (151-250)CR C3 (>250)CR AVG. MATURITY
Time Management 2.8 3.0 3.3 3.0
Cost Management 2.8 2.9 3.4 3.1
Quality Management 2.7 3.0 3.7 3.1
Risk Management 2.0 2.5 2.9 2.5
Procurement Management 3.2 3.2 3.7 3.3
Safety Management 2.8 3.0 3.6 3.1
Human resource Management 2.5 2.9 3.3 2.9
Scope Management 2.6 2.5 3.2 2.8
Finance Management 3.0 3.0 3.4 3.1
Equipment Management 2.8 3.0 3.6 3.1
Material Management 3.2 3.3 3.5 3.3
Communication Management 2.1 2.7 3.1 2.6
Documentation Management 3.4 3.5 3.8 3.6
Environment Management 2.6 2.6 3.2 2.8
To achieve the higher maturity the organizations should provide trainings to employees related o importance of project management process and their application. It is important to know that how the areas will help them to get the work don easily & efficiently. From these study we can conclude that if the organizations follow all the project management processes in the optimize level they can excel.
ACKNOWLEDGMENT
I thankfully acknowledge to Mr. Ankit S. Patel for proving Guidance & support for the project completion & I would also like to thank Parul University for their motivational & infrastructure support to carry out this research.
REFERENCES
[1] A. H. Yimam and M. J. Skibniewski, “Project management maturity in the construction industry of developing countries (the case of Ethiopian contractors),” ProQuest Diss. Theses, vol. 2, no. 3, pp. 1106–1109, 2011.
[2] J. K. Crawford, “The Project Management Maturity Model,” Inf. Syst. Manag., vol. 23, no. 4, pp. 50–58, 2007.
[3] P. Buckle and J. Thomas, “Deconstructing project management: A gender analysis of project management guidelines,” Int. J. Proj. Manag., vol. 21, no. 6, pp. 433–441, 2003.
[4] E. S. Andersen and S. A. Jessen, “Project maturity in organisations,” Int. J. Proj. Manag., vol. 21, no. 6, pp. 457–461, 2003.
[5] R. A. Salawu and F. Abdullah, “Assessing Risk Management Maturity of Construction Organisations on Infrastructural Project Delivery in Nigeria,” Procedia - Soc. Behav. Sci., vol. 172, no. 2006, pp. 643–650, 2015.
[6] A. G. Sanjuan and T. Froese, “The Application of Project Management Standards and Success Factors to the Development of a Project Management Assessment Tool,” Procedia - Soc. Behav. Sci., vol. 74, pp. 91–100, 2013.
[7] M. Khoshgoftar and O. Osman, “Comparison of maturity models,” in 2009 2nd IEEE International Conference on Computer Science and Information Technology, 2009, pp. 297–301.
[8] C. M. Modeling, “Capability Maturity Model ® Integration (CMMI ® ) Overview,” Defense, pp. 1–58, 2005. [9] “Assessment_of_Project_management_maturit.” .
[10] M. C. Paulk, B. Curtis, M. B. Chrissis, and C. V. Weber, “CAPABILITY MATURITY MODEL for software, Version 1.1,” SEI Jt. Progr. Off., no. February, p. 87, 1993.
[11] M. Radujković and M. Sjekavica, “Project Management Success Factors,” Procedia Eng., vol. 196, no. June, pp. 607–615, 2017. [12] V. S. Anantatmula, “Strategies for Enhancing Project Performance,” J. Manag. Eng., vol. 31, no. 6, p. 04015013, 2015.
[13] X. N. Chang and B. Wei, “The Application of Project Management Maturity Model,” Appl. Mech. Mater., vol. 475–476, pp. 1707–1712, 2013. [14] KPMG, “Climbing the curve,” 2015 Glob. Constr. Proj. Surv., pp. 1–36, 2015.
[15] P. F. Kertzie, “Make it or break it,” Fire Rescue Mag., vol. 25, no. 5, pp. 38–45, 2007.
[16] KPMG, “Climbing the curve, 2015 Global Construction Project Owner’s Survey,” Kpmg, pp. 1–36, 2015. [17] H. R. KPMG, “KPMG in India ’ s Annual Compensation Trends Survey 2018-19,” no. April, pp. 1–19, 2018.
[18] J. Zhang and X. Zou, “Research on Strategic Capability Maturity and Its Enlightenment to Large-Scale Contractors,” no. 2, pp. 1008–1015, 2014. [19] Y. H. Kwak and C. W. Ibbs, “Project Management Process Maturity (PM)2 Model,” J. Manag. Eng., vol. 18, no. 3, pp. 150–155, 2002.
[20] C. Liang, W. Lu, S. Rowlinson, and X. Zhang, “Development of a Multifunctional BIM Maturity Model,” J. Constr. Eng. Manag., vol. 142, no. 11, p. 06016003, 2016.
[21] J. L. Dettbarn, C. W. Ibbs, and E. L. Murphree, “Capital Project Portfolio Management for Federal Real Property,” J. Manag. Eng., vol. 21, no. 1, pp. 44–53, 2004.
[22] C. S. Goh and S. Rowlinson, “Conceptual Maturity Model for Sustainable Construction,” J. Leg. Aff. Disput. Resolut. Eng. Constr., vol. 5, no. 4, pp. 191–195, 2013.
[23] Farrokh J. and Azhar K. Mansur, “Project Management Maturity Models and Organizational Project Management Maturity Model (OPM3®): A Critical Morphological Evaluation,” World Acad. Sci. Eng. Technol. Int. J. Econ. Manag. Eng., vol. 7, no. 5, p. 5, 2013.
[24] D. R. Patel, N. D. Sharma, and R. A. Shah, “Development of Project Management Maturity Model for Measuring Success of Construction Projects in Surat City,” Int. J. Sci. Dev. Res., vol. 1, no. 5, pp. 149–152, 2016.
[25] J. Rosai, The nature of myospherulosis of the upper respiratory tract, vol. 69, no. 5. 1978. [26] I. PM Solutions, “Project Management Maturity & Value Benchmark,” p. 8, 2014.
[27] F. Backlund, D. Chronéer, and E. Sundqvist, “Project Management Maturity Models – A Critical Review,” Procedia - Soc. Behav. Sci., vol. 119, pp. 837–846, 2014.
[28] S. Z. Abdul Rasid, W. K. Wan Ismail, N. H. Mohammad, and C. S. Long, “Assessing Adoption of Project Management Knowledge Areas and Maturity Level: Case Study of a Public Agency in Malaysia,” J. Manag. Eng., vol. 30, no. 2, pp. 264–271, 2014.