Determination of Marshall Stability value for BC
Grade-II Bituminous Mix by Replacing Twenty
mm Down Size Aggregates with Waste Plastic
Material
Naveena N1
1
Assistant Professor, Department of Civil Engineering, B.T.L.I.T, Bengaluru
Abstract: The main objective of this project is use of waste plastic material in the flexible pavement construction and analyse the Marshall Stability value for the bituminous mix in the laboratory. Since the traffic intensity is increasing every year, because of which there will be more repetition of loaded vehicles. There is a need for better quality of pavement in terms of strength, durability and resistance to the deformation for avoiding deterioration of pavement and obtain better raiding quality. This study will take care of aspects like better pavement characteristics and eco-friendly nature in terms of reusing the waste materials. In the present study twenty mm down aggregates is replaced for about five percent with plastic waste consisting LDPE (low density polyethylene) or HDPE (high density polyethylene) and BC grade-II mix is prepared. This can be used for surface course of flexible pavement in road construction. The Marshall Stability values are checked for the above samples and is compared with the conventional BC grade-II mix. By using above plastic waste materials there will be increase the strength, durability, resistance to the deformation and water resistance as well as providing a mean to dispose of wastes. At the end, it concludes that the modified bituminous mix is cheaper than conventional bituminous mix. The test result of modified bituminous mix is found to be better than conventional bituminous mix.
Keywords: Marshall Stability, bituminous mix, waste plastic material, BC Grade-II
I. INTRODUCTION
A. Objectives
Main motto is to efficiently utilize the waste plastic in constructive way so that it can be beneficial to society however main objectives of current project work are:
1) To utilize the plastic waste and to reduce its impact on environment.
2) To analyse the performance tests like Marshall Stability value for conventional BC Grade-II mix and compared with BC grade-II mix that is prepared by replacing 5% of waste plastic material.
II. LITERATURE REVIEW
Zoorab & Suparma reported the use of recycled plastics composed predominantly of polypropylene and low density polyethylene in plain bituminous concrete mixtures with increased durability and improved fatigue life. Dense bituminous macadam with recycled plastics, mainly low density polyethylene (LDPE) replacing 30% of 2.36–5mm aggregates, reduced the mix density by 16% and showed a 250% increase in Marshall Stability; the indirect tensile strength (ITS) was also improved in the ‘Plastiphalt’ mixtures. D.N. Little worked on the same theme and he found that resistance to deformation of asphaltic concrete modified with low density polythene was improved in comparison with unmodified mixes. It was found that the recycled polyethylene bags may be useful in bituminous pavements resulting in reduced permanent deformation in the form of rutting and reduced low temperature cracking of pavement surfacing Binduetal. The director of the Central Road Research Institute (CRRI) said that bitumen mixed with plastic or rubber improves the quality and life of roads. The deputy director of the CRRI said that polymers mixed with bitumen increased the construction cost up to six per cent, but increased the longevity of roads manifold. The performance studies carried out on the roads constructed in Tamil Nadu indicated satisfactory performance with good skid resistance, good texture value, stronger and less amount of progressive unevenness over a period of time. The experimentation carried out by CRRI also indicated better stability value, indicating higher strength, less flow and more air voids. Al-Hadidy A.I., Yi-qiu Tan (2009), “Effect of polyethylene on life of flexible pavements”, Ms.Apurva Chavan (2013) says that using plastic waste in mix will help reduction in need of bitumen by around 10%, increase the strength and performance of road, avoid use of anti-stripping agent, avoid disposal of plastic waste by incineration and land filling and ultimately develop a technology, which is eco-friendly.
III. MATERIAL AND METHODOLOGY ADOPTED
Selection of mix constituents:
Binder and aggregates are the two main constituents of bituminous mix. Binder: VG-30 grade bitumen is used in the present study.
[image:2.612.34.579.506.606.2]Aggregate: Aggregate of 20mm down, 12.5mm down, Stone Dust and cement is used as Filler Plastic material:
TABLE I: PROPERTIES OF LDPEP AND HDPEP
Types of plastic Chemical formation Density (gm/cm3 ) Softening point Low Density poly-ethylene
Plastic (LDPEP)
(-CH2-CH2-)n 0.9 to 0.95 100° c to 120°c
High Density poly-ethylene Plastic(HDPEP)
(-CH2-CH2-)n 0.95 to 0.96 120° c to 130°c
IV. RESULTS AND DISCUSSIONS
[image:2.612.33.579.646.729.2]A. Tests on Aggregates
Table Ii: Observation & Tabulation Of Aggregate Impact Value Test And Los Angeles Abrasion Value Test Sl.
No.
Aggregate Impact Value Los Angeles abrasion value
0 % Plastic 1 % Plastic 3 % Plastic 5 % Plastic 0 % Plastic 1 % Plastic 3 % Plastic 5 % Plastic 1
Table Iii: Observation & Tabulation Of Water Absorption Test And Crushing Value Test
Sl. No. Specific Gravity Crushing Test
1 0 % Plastic
3 % Plastic
5 % Plastic 0 % Plastic 3 % Plastic 5 % Plastic
1.1 % 0.7 % 0.5 % 21.64 % 23.7 % 25.64 %
table iv: observation & tabulation of stripping value test for aggregates Sl. No. Uncovered area/stripping percentage
1
0 % Plastic 3 % Plastic 5 % Plastic
5 % 3 % 1 %
[image:3.612.40.572.260.332.2]B. Tests on Bitumen
Table V: Consolidated Test Results Of Conventional Bitumen
Test Result Ranges
Ductility test 87.50 cm Min 40 cm Penetration value 67.50 mm 60-70 mm Softening Point 46.450C 45-60 ˚C
Specific Gravity test 1.011 0.97 - 1.02 Proportioning of aggregates by rothfuth’s method:
Observation & Tabulation:
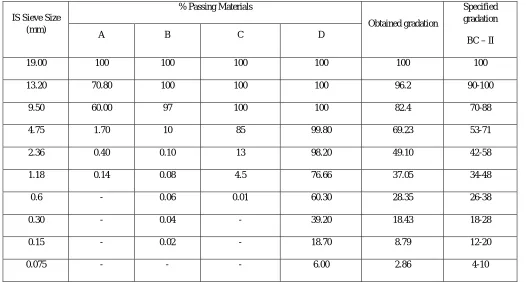
[image:3.612.46.572.446.728.2]Material - A – 19 mm down size aggregates Material - B – 12.50 mm down size aggregates Material - C – 6.30 mm down size aggregates Material - D – 4.75 mm down size aggregates
Table Vi: Proportioning Of Four Materials A, B, C & D To Be Mixed As Per Given Below For Bc Grade Ii
IS Sieve Size (mm)
% Passing Materials
Obtained gradation
Specified gradation
BC – II
A B C D
19.00 100 100 100 100 100 100
13.20 70.80 100 100 100 96.2 90-100
9.50 60.00 97 100 100 82.4 70-88
4.75 1.70 10 85 99.80 69.23 53-71
2.36 0.40 0.10 13 98.20 49.10 42-58
1.18 0.14 0.08 4.5 76.66 37.05 34-48
0.6 - 0.06 0.01 60.30 28.35 26-38
0.30 - 0.04 - 39.20 18.43 18-28
0.15 - 0.02 - 18.70 8.79 12-20
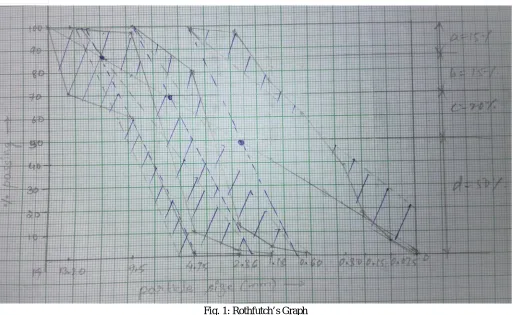
Fig. 1: Rothfutch’s Graph JMF = A: B: C: D
The obtained gradation or proportioning of four materials used in BC Grade-II from graph A = 15 %, B = 15%, C = 20%, D = 50% (48% Quarry dust; 2% Mineral filler cement)
JMF = 15:15:20:50
MARSHALL STABILITY TEST:
Mix Design: (conventional BC grade-II mix) Mould size- d = 0.105m, h = 0.67m
Area = πd²/4
Volume = Area * height
Total mix weight W = Volume * Density Vv % = 100*(Gt -Vb)/Gt
Vb % = Gb *W4/G4
VMA % = Vv + Vb
VFB = 100Vb/VMA
Gb = WA/WA-WS
Gt = 100/(W1/G1)+(W2/G2)+(W3/G3)+(W4/G4)
Where,
Vv = air voids in the mix, % Vb = volume of bitumen, %
VMA = voids in mineral aggregates, %
VFB = voids filled with bitumen, %
Gb = Bulk density of mix
Gt = Maximum theoretical density WA = Weight of specimen in air
W1 = % by weight of coarse aggregate in total mix = 15 %
W2 = % by weight of fine aggregate in total mix = 15 %
W3 = % by weight of filler = 20 %
W4 = % by weight of bituminous binder = 48 %
G1 = Specific gravity of coarse aggregates = 2.625
G2 = Specific gravity of fine aggregates = 2.6
G3 = Specific gravity of filler used = 2.610
[image:5.612.32.578.205.459.2]G4 = Specific gravity of coarse aggregates = 1.010
Table Vii: Observation And Tabulation For Marshall Stability Value Test
Sample No.
Bitumen content
Wt. of sample in air
Wt. of sample in water(g)
Dia (mm)
Height
(mm) Area
Volume (cc)
Density
(g/cc) Average
Stability value
1 5 1249.0
1262.0
711.00 714.00
100.0 64.67
65.67 7857.143 508.121 515.979
2.458
2.423 2.440
1543.70 1719.90
2 5.5 1258.0
1259.0
717.00
725.00 100.0
64.33
65.00 7857.143
505.450 510.714
2.489
2.471 2.480
1808.10 1741.95
3 6 1260.0
1259.0
729.00
728.00 100.0
65.30
65.00 7857.143
513.307 510.714
2.455
2.465 2.460
1146.60 1278.90
4 6.5 1263.0
1262.0
730.0
733.0 100.0
66.33
64.67 7857.143
521.164 508.121
2.423
2.434 2.454
1102.50 1168.65
5 7 1262.0
1267.0
731.0
732.0 100.0
65.00
67.00 7857.143
510.714 526.429
2.471
2.405 2.438
[image:5.612.33.587.223.724.2]815.50 994.896
Table Viii: Observation And Tabulation For Flow Value, Vv, Vb
Correction factor
Stability (Kg) Average Flow value (mm)
Avg (mm)
Gt Gb Vv (%) Avg (%) Wt. of
bitumen (%) VB (%) 1.000 1.000 1543.700 1719.900
1631.700 3.5
3.3
3.4 2.462
2.462
2.322
2.322
5.695
5.267
5.481 5.00 11.493
11.545
1.040
1.000
1860.429
1741.950
1811.18 3.7
3.5
3.6 2.445
2.445
2.325
2.35
4.899
3.886
4.392 5.00 12.663
12.793
1.000
1.000
1146.600
1278.900
1212.75 4.4
5.2
4.8 2.429
2.429
2.373
2.371
2.303
2.381
2.342 6 14.098
14.085
1.000
1.040
1102.500
1215.396
1158.94 5.00
5.00
5 2.413
2.413
2.390
2.386
1.795
1.130
1.463 6.5 15.250
15.353
1.000
0.960
815.850
994.896
905.37 6.1
5.9
6 2.397
2.397
2.377
2.371
0.863
1.108
0.936 7.00 16.472
Table Ix: Observation And Tabulation For Vma, Vfb
VMA (%) Avg (%) VFB (%) Avg (%)
17.188
16.812 17.00
66.686
68.670 67.768 17.561
16.683 17.122
72.105
76.709 74.407 16.400
16.466 16.433
85.956
85.541 85.749 17.045
16.483 16.674
89.471
93.142 91.307 17.335
17.539 17.437
95.019
[image:6.612.46.578.275.365.2]93.683 94.351 Table X: Observation And Tabulation For Optimum Bitumen Content Criteria Bitumen content %
Max Stability 5.5 %
Flow 5.8 %
VV 5.6 %
Max Density 6.5 %
OBC 5.85 %
Optimum bitumen content of 60/70 grade (VG-30) bitumen = 5.85%
Maximum stability = 1808 kg, Flow value = 4 mm at bitumen content = 5.5%
[image:6.612.35.576.451.507.2]Properties of bituminous mix after replacing 20 mm down size aggregates with 5 % waste plastic for 60/70 grade bitumen: Table Xi: Marshall Stability Values Kg For Bc Grade Ii For Waste Plastic Of 5 %
Waste Plastic, % Stability value, Kg Flow value
5 1992 4.5 mm
[image:6.612.38.578.541.724.2]Maximum stability = 1992 kg
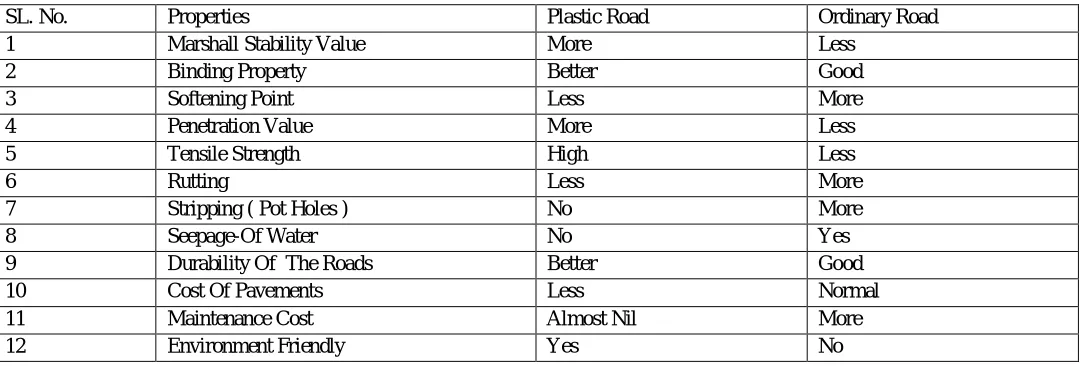
Table xii: comparison between ordinary bituminous roads and waste plastic bituminous roads. SL. No. Properties Plastic Road Ordinary Road 1 Marshall Stability Value More Less
2 Binding Property Better Good 3 Softening Point Less More 4 Penetration Value More Less 5 Tensile Strength High Less
6 Rutting Less More
V. CONCLUSION
Recycled plastic along with aggregates is used for the better performance of roads. The polymer coating also reduces the voids. This prevents the moisture absorption and oxidation of bitumen by entrapped air. This has resulted in reducing rutting, ravelling and there is no pothole formation. The roads can withstand heavy traffic and show better durability. Following are some points which are drawn from the study: The Aggregate Impact Value of 5 % plastic replaced bituminous mix is lower than aggregate coated with normal bitumen mix. These values are well within IRC limits (i.e. less than 30). This infers that plastic coated bitumen can resist greater impact and pavements coated with plastic have a longer lifetime The Water Absorption Capacity of plastic coated bitumen is lower than aggregate coated with normal bitumen mix. The values are within the IRC limits (i.e. less than 2). The value of absorption can be taken as negligible. The above results state that water absorption is very less in plastic coated bitumen, thus reducing infiltration eliminating the possibility of formation of potholes. The ideal plastic content which needs to be added is 5% weight of 20mm down size aggregates. The Marshall Stability value of plastic coated bitumen is 1.1 times greater than the one which is coated normal bitumen mix. This indicates the strength which plastic content imparts to the aggregate thus improving load carrying capacity with minimal deflection. Thus the analysis and results presented above shows that plastic obtained from municipal plastic waste, proved to be a better binder for pavements than normal bitumen. The properties displayed by plastic coated bitumen are beneficial without incurring much cost leading for effective, economic and efficient laying of roads. In this way plastic waste can be re-used
REFERENCES
[1] Al-Hadidy A.I., Yi-qiu Tan (2009), “Effect of polyethylene on life of flexible pavements”, Construction and Building Materials, Vol. 23.
[2] Annette R. Hill, Andrew R. Dawson, Michael Mundy.,(2001), “Utilisation of aggregate materials in road construction and bulk fill”, Resources, Conservation and Recycling, Vol. 32, School of Civil Engineering, University of Nottingham, Australia, pp 305–320.
[3] Aravind K. , Das Animesh, (2007), “Pavement design with central plant hot-mix recycled asphalt mixes”, Construction and Building Materials, Vol. 21, Dept. of Civil Engg., Indian Institute of Technology Kanpur, India, pp 928–936.
[4] Bandopandhyay T. K., (Jan. - Mar. 2010), “Construction of Asphalt Road with Plastic Waste”, Indian Center for Plastic in Environment (ICPE), ENVIS – Eco- Echoes, Vol.11, Issue 1.
[5] Dhodapkar A N., (Dec. 2008), “Use of waste plastic in road construction”, Indian Highways, Technical paper, journal, P No.31-32. [6] Materials Science and Engineering, Chongqing University, China, pp 1368–1376.
[7] Himshog Lu Shinan Agar Emine-“Use of waste high density polyethylene as bitumen modifier in asphalt concrete mix”, Materials Letters, Vol. 58, pp 267– 271.
[8] I.Vegas, J.A. Iban˜ez, J.T. San Jose´, A. Urzelai.,(2008), “Construction demolition wastes, Waelz slag and MSWI bottom ash: A comparative technical analysis as material for road construction”, Waste Management, Vol. 28, pp 565–574.
[9] Jose Ramon Jimenez.,(2011), “Utilisation of unbound recycled aggregates from selected CDW in unpaved rural roads”, Resources, Conservation and Recycling, Vol. 58,
[10] Construction Engineering Area, University of Córdoba, Córdoba, Spain, pp 88– 97.