Abstract—It is a requirement for any educational systems to evaluate students’ knowledge in order to decide whether or not they will be able to pass the evaluation criteria of each course. However, although the evaluation provides teachers with the result of students’ ability, it cannot measure the efficiency of the testing items. That is, some items are too easy while some are too difficult. Therefore, designing the testing items that are suitable for learners is necessary and important. In this paper, the items measurement method using the Erlang k-means clustering algorithm in measuring the difficulty of the examination is proposed. The statistic records was brought to the Examination Difficulty Analysis system to generate probability values to provide teachers with information in modifying the difficulty level of either the whole items or each item. This Erlang K-means clustering application will group learners by their scores as well as their answers to each item. The experimental results regarding our implemented Erlang tool are acceptable and promising for applicability and future enhancement.
Index Terms—Erlang, K-means clustering, Difficulty item analysis, Educational system tool, Examination Difficulty Analysis System (EDA)
I. INTRODUCTION
N educational systems, educators have to evaluate the students’ knowledge in order to decide whether or not they will be able to pass the evaluation criteria of each course. There is various ways to measure the student, multiple choices exam is one of testing methods. However we could know the overall result of students testing but we could not know how efficiency of each item they would have done.
According to efficiency of each exam items there is a ways to deal with this problem such as applying statistical method to calculate and measure its efficiency. Erlang functional language and k-means clustering is one of mixed and match tool to dealing this problem. Erlang is the computing language which is suitable for mathematical processing, distributed programming and memory utilized
Manuscript received December 16, 2010; revised January 20, 2011. This work was supported by the National Research Council of Thailand (NRCT) and Suranaree University of Technology.
Suwicha Paveenaporn is a master student with the School of Computer Engineering, Suranaree University of Technology, 111 University Avenue, Nakhon Ratchasima 30000, Thailand (corresponding author, phone: +66-8073-0044-0; fax: +66-4422-4602; e-mail: red44149@ hotmail.com).
Vorawoot Pratumtri is a master student with the School of Computer Engineering, Suranaree University of Technology, Thailand (e-mail: [email protected]).
Nittaya Kerdprasop is an associate professor and a researcher of the Data Engineering and Knowledge Discovery (DEKD) research unit, School of Computer Engineering, Suranaree University of Technology, Nakhon Ratchasima 30000, Thailand (e-mail: [email protected]).
handling and so on. K-means clustering is also an effective and wide spread using algorithm to grouping the nearest data items into the same cluster.
The organization of this paper is as follows. Section 2 presents basic theory and related work. Section 3 explains the examination difficulty analysis used in our method and the implementation with Erlang programming language. Section 4 is the item analysis result obtained from our method comparable to the standard method. Section 5 concludes this paper.
II. THEORY AND RELATED WORK A. Erlang language
Erlang is a general-purpose concurrent, garbage-collected programming language and runtime system. The sequential subset of Erlang is a functional language, with strict evaluation, single assignment, and dynamic typing. For concurrency it follows the Actor model. It was designed by Ericsson to support distributed, fault-tolerant, soft-real-time, non-stop applications. The first version was developed by Joe Armstrong in 1986 [7]. It supports hot swapping, thus code can be changed without stopping a system [5]. It was originally a proprietary language within Ericsson, but was released as open source in 1998.
B. K-means algorithm
K-means clustering is a cluster analysis methodology widely used in statistics and machine learning [1], [5], [7]. The method aims at partitioning n data items into k clusters to create highest relative similarity data in the same cluster and decrease overall distance between the data items to the centroid, or the center of cluster. The distance can be calculated by the Euclidean distance formula to reciprocal of data items. The closer distance is considered as the bigger similarity.
K-means steps [2]:
Distribute all data items to k number (k is input value)of different random cluster;
Calculate the mean value of each cluster, and use it as the centroid.
Redistribute all data items to the closest cluster due to the Euclidean distance value to the centroid;
Recalculate mean value of all data items in each cluster;
Perform calculate criterion E function, generally k-means criterion adopts sum of square error formula, defined as:
Examination Assessment Tool Implemented
with Erlang K-means Clustering
Suwicha Paveenaporn, Vorawoot Pratumtri, and Nittaya Kerdprasop,
Member, IAENG
E is given to total sum of square error of all data items, p is given to data item, miis a mean value of cluster Ci [8].
III. EXAMINATION DIFFICULTY ANALYSIS A. System framework
[image:2.595.306.551.64.443.2]In this research the processing system technique with Erlang language is used to display the items analyzed result, the students score will be brought to grouping by k-means algorithm. We divided the average value of all students score into two groups and perform dividing process into 2 groups by separating the processed data by the scored result between high score group and low score group. Then do summation the number of students that answer correctly of high score and low score groups. After that classify student levels as well as provide the result of difficulty analysis of each item. The result will be display in sequential order of tasks performed on the data. The system framework diagram is illustrated in figure 1.
Figure. 1. EDA system framework diagram.
The information for testing in item analysis system had brought from mathematical examination, grade 8th, Marie Vithaya School, Nakhon Ratchasima, Thailand. This data set has 40 records of students that attended the test of 30 items; this exam is multiple choices style, 4 choices exam.
B. Data characteristic
[image:2.595.46.292.361.517.2]The data format from student examination is transformed into binary digits, 0 means answered incorrectly and 1 means answered correctly. The figure 2 illustrates the data sample.
Figure. 2. Raw data characteristic
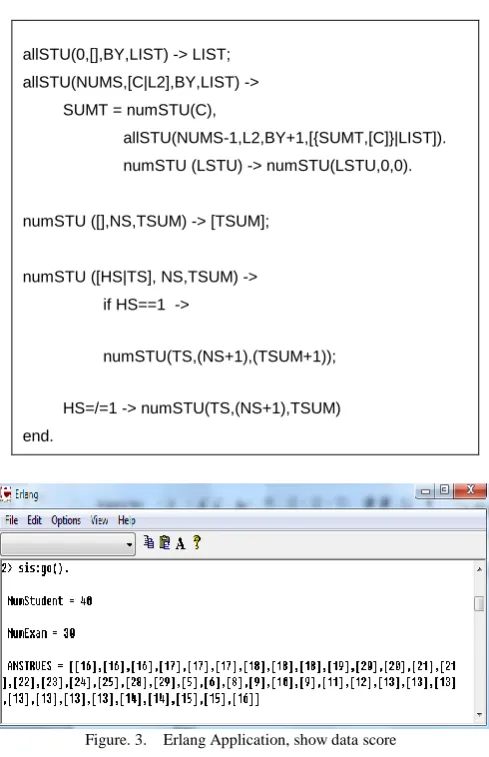
C. Erlang implementation to sum score statement
allSTU(0,[],BY,LIST) -> LIST; allSTU(NUMS,[C|L2],BY,LIST) ->
SUMT = numSTU(C),
allSTU(NUMS-1,L2,BY+1,[{SUMT,[C]}|LIST]). numSTU (LSTU) -> numSTU(LSTU,0,0). numSTU ([],NS,TSUM) -> [TSUM];
numSTU ([HS|TS], NS,TSUM) -> if HS==1 ->
numSTU(TS,(NS+1),(TSUM+1)); HS=/=1 -> numSTU(TS,(NS+1),TSUM) end.
Figure. 3. Erlang Application, show data score
D. Classification between high score and low score
System perform classification with k-means algorithm, this will find the centroid of each group [1], [5], [7], high score and low score for use it as index of exam evaluation respectively (illustrated in figure 3). For the running result, classification process of high score and low score the data will be nearness value to other for less error [4], [12] (illustrated in figure 4).
Erlang implementation to initialize centroid statement:
startC(0,H,A) -> [[A-H],[A+H]]; startC(N,H,A) -> startC(N-1,H/2,A).
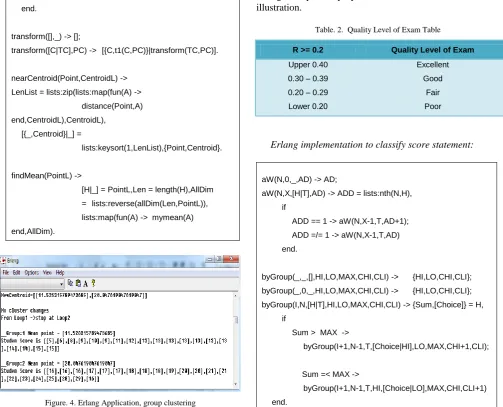
Erlang implementation to clustering statement:
clustering(N,CL,PL) ->
L1 = lists:map(fun(A) -> nearCentroid(A,CL) end ,PL), L2 = transform(CL,L1),
NewCentroid = lists:map(fun({_,GL}) ->
findMean(GL) end,L2), if NewCentroid==CL ->
true -> clustering(N+1,NewCentroid,PL) end.
transform([],_) -> [];
transform([C|TC],PC) -> [{C,t1(C,PC)}|transform(TC,PC)]. nearCentroid(Point,CentroidL) ->
LenList = lists:zip(lists:map(fun(A) -> distance(Point,A) end,CentroidL),CentroidL),
[{_,Centroid}|_] =
lists:keysort(1,LenList),{Point,Centroid}. findMean(PointL) ->
[image:3.595.48.552.61.468.2][H|_] = PointL,Len = length(H),AllDim = lists:reverse(allDim(Len,PointL)), lists:map(fun(A) -> mymean(A) end,AllDim).
Figure. 4. Erlang Application, group clustering
E. Display Compared Data
System expressed the running result by showing the calculated value by using a cyclic module dependency with the IDStudebt [9], Difficulty Level of Item value, Quality Level of Exam value.
The Difficulty Level of Item is divided into 5 levels, which categorized items to each level by used P, probability value after system calculated. Probability value of each item is arranged respectively by its value. See in the table 1 for an illustration.
Table. 1. Difficulty Level of Item Table
The Quality Level of Exam is divided into 4 levels, which categorized items to each level by used R, range value after system calculated. Probability value of each item is
arranged respectively by its value. See in the table 2 for an illustration.
Table. 2. Quality Level of Exam Table
Erlang implementation to classify score statement:
aW(N,0,_,AD) -> AD;
aW(N,X,[H|T],AD) -> ADD = lists:nth(N,H), if
ADD == 1 -> aW(N,X-1,T,AD+1); ADD =/= 1 -> aW(N,X-1,T,AD) end.
byGroup(_,_,[],HI,LO,MAX,CHI,CLI) -> {HI,LO,CHI,CLI}; byGroup(_,0,_,HI,LO,MAX,CHI,CLI) -> {HI,LO,CHI,CLI}; byGroup(I,N,[H|T],HI,LO,MAX,CHI,CLI) -> {Sum,[Choice]} = H,
if
Sum > MAX ->
byGroup(I+1,N-1,T,[Choice|HI],LO,MAX,CHI+1,CLI); Sum =< MAX ->
byGroup(I+1,N-1,T,HI,[Choice|LO],MAX,CHI,CLI+1) end.
Erlang implementation to output statement:
view(0,A,B,SA,SB,NUM,ALLSTU) -> []; view(N,A,B,SA,SB,NUM,ALLSTU) ->
HI = aW(NUM,SA,A,0), LOW = aW(NUM,SB,B,0), SD = (HI+LOW)/ALLSTU, RD = (HI-LOW)/SA, io:format("~nANS~w -->",[NUM]),
io:format("GROUPHI-TRUE = ~w |&&| ",[HI]), io:format("GROUPLOW-TRUE = ~w |&&| ",[LOW]), DI = dP(SD,1,[]), %checkP
io:format("0.2<P<0.8 --> = ~w |&&| ",[SD]), RI = dR(RD,1,[]), %checkR
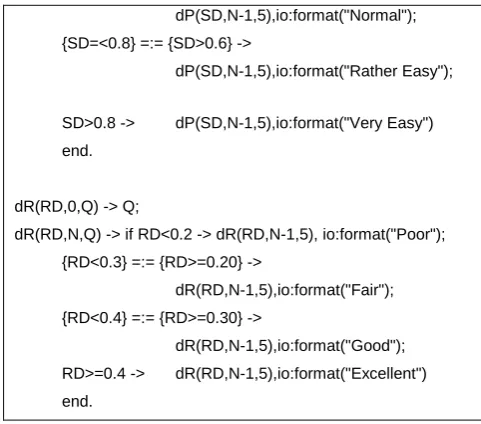
io:format("R >= 0.2 --> = ~w~n",[RD]), view(N-1,A,B,SA,SB,NUM+1,ALLSTU). dP(SD,0,Q) -> Q;
dP(SD,N,Q) -> if SD=<0.2 -> dP(SD,N-1,5), io:format("Very hard");
{SD=<0.4} =:= {SD>0.2} ->
dP(SD,N-1,5),io:format("Rather Hard"); {SD=<0.6} =:= {SD>0.4} ->
0.8 > P >0.2 Difficulty Level of Item
0.00 – 0.20 0.21 – 0.40 0.41 – 0.60 0.61 – 0.80 0.81 – 1.00
Very hard Rather Hard
Normal Rather Easy
Very Easy
R >= 0.2 Quality Level of Exam
Upper 0.40 0.30 – 0.39 0.20 – 0.29 Lower 0.20
Excellent Good
dP(SD,N-1,5),io:format("Normal"); {SD=<0.8} =:= {SD>0.6} ->
dP(SD,N-1,5),io:format("Rather Easy"); SD>0.8 -> dP(SD,N-1,5),io:format("Very Easy") end.
dR(RD,0,Q) -> Q;
dR(RD,N,Q) -> if RD<0.2 -> dR(RD,N-1,5), io:format("Poor"); {RD<0.3} =:= {RD>=0.20} ->
dR(RD,N-1,5),io:format("Fair"); {RD<0.4} =:= {RD>=0.30} ->
dR(RD,N-1,5),io:format("Good"); RD>=0.4 -> dR(RD,N-1,5),io:format("Excellent") end.
IV. ITEM ANALYSIS RESULT
The system testing result, 40 records of students which testing for 30 items; this exam is multiple choices style, 4 choices exam. Comparing result from Erlang application (Erlang application shown in figure 3)to result of calculator by selected 8 items and display twice results in comparing table. The result has shown in tables 3 and 4 for an illustration.
[image:4.595.45.286.48.260.2]Figure. 5. Erlang Application, show data summary
Table. 3. Erlang Application, show data summary
Calculator Erlang
High Score Low Score High Score Low Score
Correct (items)
Correct (items)
Correct (items)
Correct (items)
4 5 4 5
20 15 21 14
20 16 21 15
19 16 20 15
16 6 16 6
19 13 20 12
7 1 7 1
10 7 10 7
12 5 12 5
9 4 10 3
13 5 14 4
15 7 16 6
14 6 15 5
8 2 8 2
13 6 13 6
15 12 16 11
15 10 16 9
12 7 12 7
7 5 8 4
14 5 14 5
18 8 18 8
10 6 11 5
19 13 20 12
17 10 18 9
11 2 11 2
10 7 10 7
17 12 18 11
12 6 12 6
19 14 20 13
[image:4.595.268.539.62.780.2]10 4 10 4
Table. 4. Erlang Application, show data summary
Calculator Erlang
Difficulty Level
Quality Level
Difficulty Level
Quality Level
0.2 < p < 0.8 D >= 0.2 0.2 < p < 0.8 D >= 0.2
0.23 -0.05 0.225 -0.05
0.88 0.25 0.875 0.35
0.90 0.20 0.90 0.3
0.88 0.15 0.875 0.25
0.55 0.50 0.55 0.5
0.80 0.30 0.80 0.4
0.20 0.30 0.20 0.3
0.43 0.15 0.425 0.15
0.43 0.35 0.425 0.35
0.33 0.25 0.325 .0.35
0.45 0.40 0.45 0.5
0.55 0.40 0.55 0.5
0.50 0.40 0.5 0.5
0.25 0.30 0.25 0.3
0.48 0.35 0.475 0.35
0.68 0.15 0.675 0.25
0.63 0.25 0.625 0.35
0.48 0.25 0.475 0.25
0.30 0.10 0.3 0.2
0.48 0.45 0.475 0.45
0.65 0.50 0.65 0.5
0.40 0.20 0.4 0.3
0.80 0.30 0.8 0.4
0.68 0.35 0.675 0.45
0.33 0.45 0.325 0.45
0.43 0.15 0.425 0.15
0.73 0.25 0.725 0.35
0.45 0.30 0.45 0.3
0.83 0.25 0.825 0.35
[image:4.595.47.294.393.704.2]Due to the comparative table of classification and analyzed data, calculated result from Erlang application has correctly nearby the calculator result therefore the proposed Erlang k-means Clustering application would be considered as analyzed and evaluated item tool. Which the proposed application contributes designing and modifying exam is more efficiency.
V. CONCLUSION AND FUTURE WORK
Educational developing has to evaluate the teaching in order to applied and developed the optimum learning result for student, so we can design the exam in any levels and evaluated the stuffs. Which can be analyzed by calculated from statistical method, k-means Clustering and Erlang language is the efficiency tools to enhance the item analysis.
According to the Erlang k-means clustering for item analysis application which can be grouped the data set and classified student and exam difficulty level. The system provide good running result which nearby calculated by using manual calculator from mathematical formula. However hand calculated is so complex and takes more time to analyze exam item therefore this proposed Erlang k-means Clustering could be considered as one of item analysis tools. Furthermore Erlang is a functional language which has various techniques to developed this application to better work because this research would proposed the prototype of item analysis system, which it prove of concept but not various of functions .
For the future work we would have integrated this application to examination CMS that provide online test examination for enhance the efficiency of designing examination as well as educational evaluation.
REFERENCES
[1] “A Tutorial on Clustering Algorithms”, http://home.dei.polimi.it/ matteucc/Clustering/tutorial_html/index.html, 2010
[2] J. Armstrong, B. Däcker, T. Lindgren, H. Millroth. "Open-source Erlang - White Paper". Retrieved 2008-01-23.
[3] J. Armstrong, "History of Erlang", in HOPL III: Proceedings of
the third ACM SIGPLAN conference on History of programming
languages, 2007, ISBN 978-1-59593-766-X.
[4] W. Chang, S.Chen, M.Li, J.Chiu, “Integrating IRT to Clustering Student’s Ability with K-Means”, 2009 Fourth International Conference on Innovative Computing, Information and Control IEEE. [5] “Cluster Analysis”, http://en.wikipedia.org/wiki/Cluster_analysis,
2010
[6] Field Experience in Curriculum and Instruction Development, P103-108, P133-157
[7] “K-means Clustering”, http://en.wikipedia.org/wiki/K-means_clustering, 2010
[8] Li, Yan and Liu, S-J (2005), “data mining”, Proc. of the 6th ISOPE Ocean Mining Symp, Changsha, China, pp 88-93.
[9] H. Li, S. Thompson, “Refactoring Support for Modularity Maintenance in Erlang”, 2010 Working Conference on Source Code Analysis and Manipulation IEEE.
[10] A. Moore, “K-means and Hierarchical Clustering - Tutorial Slides” http://www-2.cs.cmu.edu/~awm/tutorials/kmeans.html
[11] B. Srisa-ard, “Testing Analysis” Pattana Watpon. pp. 58-66, 2512. (In Thai)