Evaluating Cache Contention Prediction
– A Ranking Based Approach –
Michael Zwick
Abstract—In multi-core processor systems, processor caches are generally shared among multiple processor cores. As a consequence, co-scheduled applications constantly displace each others data from the shared cache, which is called cache contention. As cache contention degrades application perfor-mance, efforts have been made to predict cache contention and then select application co-schedules that minimize interference. Several such methods have been proposed in the past. However, those methods have rarely been compared to one another, as an appropriate evaluation framework has been missing so far. In this paper, I present a framework to precisely eval-uate cache contention prediction techniques and compare them to one another. An implementation of the frame-work is licensed under GPLv3 and can be downloaded at http://www.ldv.ei.tum.de/cachecontention.
Index Terms—cache-contention-prediction, multi-core, evalu-ation, framework.
I. INTRODUCTION
I
N multi-core processor systems, applications are executed in parallel and simultaneously share resources such as memory controller, caches and busses (cf. figure 2). Sharing limited resources, however, applications frequently interfere with each other and degrade each other’s performance. As an example, figure 1 shows L2 cache hitrate degradation of SPEC 2006 benchmarkmilcwhen milc is co-scheduled with other SPEC 2006 benchmark applications: The bold black line illustrates L2 cache hitrate ofmilcwhenmilcis executed stand-alone and does not share any caches with any other applications. The other lines represent L2 cache hitrate of milcwhenmilcis co-scheduled with applicationsastar,gcc, bzip2, gobmk and lbm respectively. Note that a higher L2 cache hitrate implies better performance. As you can see from the figure, L2 cache degradation ofmilcheavily varies with the selection of the co-scheduled application. While there are applications that have only little effect on L2 cache performance of milc, such as astar and gcc, there are co-schedules that have severe impact such asgobmkandlbm. Generally speaking, application performance on multi-core processor systems does not only depend on the amount of resources provided by the computer system and the amount of resources the considered application applies for, but also on co-scheduled applications sharingthose resources. As a consequence, resource-aware co-scheduling of applications has gained more and more attention the recent years and new scheduling techniques have been proposed that aim to optimize overall system performance by predicting and avoiding cache/resource contention. However, the proposed techniques have rarely been compared to other state-of-the-art methods, as an appropriate evaluation framework hasManuscript received June 24, 2012; revised August 20, 2012.
M. Zwick is with the Department of Electrical Engineering and In-formation Technology, Technische Universit¨at M¨unchen, 80290 M¨unchen, Germany; email: [email protected].
been missing so far. In fact, such methods have rather been verified by comparing performance impacts of a state-of-the-art process scheduler to the impacts achieved by a modified version that predicts and minimizes resource contention by an adapted selection of co-schedules.
0 50 100 150 200 250
0.2 0.4 0.6 0.8
chunks (1 chunk = 2 instructions)20
L2 cac
he hitrate (%)
milc @ c0: milc milc @ c0: milc, c1: astar milc @ c0: milc, c1: gcc milc @ c0: milc, c1: bzip2 milc @ c0: milc, c1: gobmk milc @ c0: milc, c1: lbm
Million instructions
[image:1.595.315.542.237.418.2]20 40 60 80
Fig. 1. L2 cache hitrate degradation introduced to SPEC 2006 benchmark milcwhen co-schedulingmilcwith each of the SPEC 2006 benchmarks astar, gcc, bzip2, gobmk, and lbm on a CMP dual-core architecture as presented in [1].
In the following, I
• present three techniques that have been applied in the past to evaluate cache contention prediction and discuss their benefits and limitations (sec. II),
• identify requirements on a new framework to evaluate cache contention prediction (sec. III),
• propose a new evaluation framework (sec. IV) and • exemplarily show some evaluation results gained from
the framework (sec. IV).
II. STATE-OF-THE-ARTEVALUATIONTECHNIQUES
A. Fedorova et al.’s Evaluation Method
In [3], Alexandra Fedorova et al. analyze and evaluate prediction methods that estimate contention within a set of |A| = 4 applications A = {a1, a2, a3, a4} that share
resources on an Intel Quad-Core Xeon processor. The applied processor architecture can be described by two of the proces-sors shown in figure 2 (greyed boxes) that are interconnected via the bus system.
For evaluation, the authors first apply the prediction method to estimate the best co-schedule for each of the applications in A. As an example, a prediction method might estimate the best co-schedule set to be [(a1, a2),(a3, a4)],
Shared L2 cache
Core 1
Private L1 cache
Memory Memory controller hub
Prefetching hardware
Front-side bus logic
Core 2
[image:2.595.67.274.51.284.2]Private L1 cache
Fig. 2. Dual-core processor architecture as presented in [2]. While the L1 caches are private to the processor cores, the L2 cache is shared, which results in L2 cache contention.
on the one processor entity (greyed box in figure 2) and applications a3anda4 should be executed on the other.
Then, the authors compare the degradation introduced to a1, a2, a3, and a4 on this estimated best application
co-schedule to the degradation introduced to a1, a2, a3,
and a4 when applying the optimal co-schedule set, e.g.
[(a1, a3),(a2, a4)].
This is done in the following steps:
• Run each applicationa∈A stand-alone on the proces-sor and measure execution time ta, i.e. execution time of application a when adoes not suffer from resource contention.
LetCa be the set of applications that are co-scheduled with application a on the same processor and share the L2 cache1, and let tC
a be the execution time of
application awhen application a is co-scheduled with the applications inCa, then
• for each a ∈ A and each Ca ∈ A\{a}, measure execution time tCa.
• For each a∈ A and each Ca ∈ A\{a}, calculate the degradationCaintroduces toa, i.e.dCa = (tCa−ta)/ta.
• Calculate average degradation of thepredicted best co-schedule dpred=P
a∈AdCa/|A|, where, for eacha∈ A, co-schedule Ca is the predictedbest co-schedule. • Calculate average degradation of the actual best
co-schedule dact = P
a∈AdCa/|A|, where co-schedules Ca is chosen such that dCa is minimized.
• Determine evaluation metric E as percentaged perfor-mance degradation of a when applying the predicted best co-schedule instead of the actualbest co-schedule
E= ((dpred−dact)/dact)·100 %.
1If there are only two processor cores sharing a cache, thenC
aconsists
of only one application. Given a co-schedule set(a1, a2)and leta=a1, thenCa={a2}.
E is the metric Fedorova et al. apply in [3] to evaluate methods that predict contention for shared resources on multi-core processors.
The authors limit their evaluation to prediction accuracy. An evaluation of the amount of time necessary to create or apply the predictors is not performed.
Fedorova et al. are one of only a few authors that evaluate accuracy of contention prediction methods in the context of state-of-the-art prediction techniques. As evaluation method, they compare program execution times of predicted best schedules to program execution times of actual best co-schedules, measured on a physically available processor, not a simulator.
Generally, Fedorova et al.’s method to evaluate the predic-tion of resource contenpredic-tion is a highly accepted approach, as it relies onrealapplications executed on aphysicalmachine. And as long as this approach is applied to evaluate methods to predictcontention in general, everything is fine.
But it comes to problems when you try to use this technique to soleley evaluate methods to predictcache con-tention, as execution time in general depends on more factors than just cache misses, and the ground-truth reference then would incorporate effects that do not origin from cache con-tention – and are not modeled in the prediction techniques. In [3], Fedorova et al. address this effect when they explain the surprisingly good performance of stand-alone cache misses to predict cache misses of application co-schedule sets, as it has been proposed by Knauerhase et al. [4].
As a consequence, a cache simulator would be more suited to evaluate the prediction accuracy of cache contention pre-diction methods, as results obtained from a cache simulator would more precisely reflect the characteristics addressed by cache contention prediction methods. However, when it comes to an evaluation of prediction accuracy regarding contentionin general, i.e. whenoverallsystem performance is the measure to optimize, real hardware would definitely be the best choice.
B. Chandra et al.’s evaluation method
In [5], Dhruba Chandra et al. propose and evaluate three methods to predict L2 cache contention. Just like Fedorova et al., Chandra et al. focus on prediction accuracy and do not evaluate the amount of time required to perform a prediction. Contrary to most other methods, their methods directly predict additional L2 cache misses introduced from sharing the L2 cache.
To evaluate their methods, the authors compare the pre-dicted amount of additional cache misses to the actual amount of of additional cache misses obtained from a pro-cessor simulator (2 cores, private L1 cache for each core, shared L2 cache, as shown in figure 2) as follows. They
• apply the simulator to determine stand-alone L2 cache misses µa of |A| = 9 different applications a ∈ A =
{a1, a2, . . . a9},
• select 14 out of (9−1)! = 40320possible application pairs (a, Ca), a ∈ A, Ca ∈ A\{a}, and apply the simulator to determine the amount of L2 cache misses
µCa of application a when a is co-scheduled with
• calculate theactual amount ofadditional cache misses introduced to applicationawhen co-scheduling awith
Ca as µsim
Ca =µCa−µa,
• apply the prediction method to calculate apredictionof the amount of additional cache missesµpredCa introduced toaby co-schedulinga withCa,
• determine the prediction error regarding co-schedule set (a, Ca)by|µpredCa −µsim
Ca |for all mentioned co-schedule
sets and
• take the arithmetic mean of the error
Ea=
P
(a,Ca)∈A|µ pred Ca −µ
act Ca| |A| ·(|A| −1) and the geometric mean of the error
Eg= (Π(a,Ca)∈A(1 +|µ pred Ca −µ
sim Ca |))
1
|A|2−|A| −1
as evaluation metric.
As you can see from Ea and Eg, the methods applied by Chandra et al. are well suited for their evaluation, as all their prediction methods provide an amount of additional L2 cache misses as outcome. However, applying Chandra et al.’s method as a general technique to evaluate cache contention prediction methods, you would run into trouble: What would you do if the methods you want to evaluate do not predict cache contention in terms of additional cache misses, as it is exemplarily the case with the Pain method proposed by Fedorova et al. [3]? As shown in [6], many prediction methods provide values without any technical meaning, enforcing an evaluation of prediction method only in relation to one another. To such methods, Chandra et al.’s evaluation technique cannot be applied.
C. Settle et al.’s Evaluation Method
In [7], Alex Settle et al. propose a cache contention prediction method based on so-called activity vectors. Ac-tivity vectors are bit vectors that represent accesses to and misses in groups of cache sets. The authors do not compare their method to state-of-the-art techniques, but show the effectiveness of their approach by applying the following steps: They
• define a set of applications as processor workload, then • execute the workload on a hyperthreading enabled In-tel Pentium Xeon microprocessor applying a standard Linux scheduler and measure IPCact (instructions per cycle) and ITKOact (inter thread kick outs, i.e. the amount of an application’s cache lines that are displaced by a co-scheduled application) values,
• adapt the standard Linux scheduler to incorporate the prediction method in the scheduling decision process, • calculate the prediction from the workload and • execute the workload with the adapted scheduler
en-abled, measure IPCpred andITKOpred and • take
EIPC= (IPCpred−IPCact)/IPCact and
EITKO= (ITKOpred−ITKOact)/ITKOact
as evaluation metric.
At first sight, the evaluation technique applied by Settle et al. looks applicable to evaluate cache contention prediction methods in general, as it
• adapts the scheduler, as it is proposed for scenarios that exploit cache contention,
• evalutes the prediction technique by means of IPC, that is correlated toexecution timeand, besides that, • evaluates the prediction technique by means of ITKO, a
metric that directly reflects the measure of interest, and • compares to be improved values to actual values.
In contrast to the evaluation method applied by Chandra et al., this evaluation method
• does not rely on a specific format of prediction outcome (e.g. additional cache misses), what makes it applicable to a broad range of prediction techniques.
However, there are some limitations using this evaluation technique:
• First, the evaluation technique only works on largersets of applications; that means that you are not able to evaluate a predictor regarding cache interference on a specified pair of applications, but only on a larger set. Although this might not seem to be a crucial point at first sight, it makes a systematic analysis of predictors impossible, as you are not able to correlate application characteristics (number of memory references, number of misses, shape of the stack distance histogram) to prediction accuracy. As a consequence, you are not able to experiment with selected application characteristics in order to analyse and improve predictor accuracy. • Secondly, scheduler internals have a significant impact
on choosing the applications to be co-scheduled. This means that scheduling decisions are not only based on the predictors, but of course also on priorities etc. As a consequence, you evaluate prediction techniques by means of scheduler decisions; but those scheduler decisions do not 100% originate from the prediction method, but also from many side effects. As an example, two applications that perfectly minimize cache con-tention might never be co-scheduled if their priorities tell the scheduler not to do so. And the priorities might be someting you cannot control as they change at runtime. This introduces errors and might overlay evaluation results such that an actually better application co-schedule might be evaluated worse.
• Thirdly, as scheduling decisions also rely on priorities, they also rely on the past, as priorities rely on sched-uler activities performed in previous steps. Then, as a consequence, not only cache contention relies on the past due to the memory characteristic of the cache’s LRU stack, but then also the evaluation system does, while prediction methods do not. This introduces a huge amount of complexity in the evaluation process and renders an in-depth analysis of cache contention prediction techniques nearly impossible.
III. IDEAS ANDREQUIREMENTS ON AFRAMEWORK TO EVALUATECACHECONTENTIONPREDICTION
Given some insights gained from the analysis of state-of-the-art evaluation methods — how should a framework to evaluate cache contention prediction methods look like?
• As I showed in the discussion of Fedorova et al.’s eval-uation method in the previous section, execution time on a real hardware system is not a valid ground-truth reference if it comes to separate the effects of cache contention from the effects of contention in general. Therefore, a new framework to evaluate cache con-tention prediction methods should calculate a ground-truth measure applying an appropriate cache simulation framework.
• There are many cache contention prediction techniques that provide values that can only be used for an evalua-tion of predicevalua-tion methodsin relation to each another, as I pointed out in the previous section. To support evaluation of such methods, a new evaluation framework should be able to evaluate cache contention prediction techniques by means of a ranking list.
• State-of-the-art evaluations of cache contention pre-diction methods have generally focused on prepre-diction accuracy. A comparative evaluation of the amount of time required to perform a prediction has – to the best of my knowledge – never been performed. Remedial action has to be taken here and a new evaluation framework should support a timing analysis of cache contention prediction techniques.
• In order to be able to perform a fair evaluation of prediction time, it is necessary to determine which pre-diction steps have to be performed at runtime, and which steps can be performed prior to runtime. Therefore, it seems to be useful to distinguish betweenpredictionand predictorsas follows:
– Predictionis the process of combining a set of pre-dictors of candidate co-schedules in order to predict cache contention. This process adds to prediction time, as it cannot be calculated before runtime, i.e. before the set of candidate co-schedules is known.
– Predictorsare the basic blocks to store application characteristics. In order to support arbitrary co-schedule setups, predictors hold information of solo applications only, i.e. they do not hold informa-tion of multiple applications. As a consequence, all information required to calculate predictors is available prior to runtime, when no information of candidate co-schedules is available. Therefore, predictors can be calculated prior to runtime and their calculation does not add to prediction time.
• As prediction time has not been evaluated in the past, a comparative cost vs. gain analysis of prediction tech-niques is also missing. Therefore, a new evaluation framework should support such an analysis.
• State-of-the-art analysis of cache contention prediction techniques has generally been performed in the context of a given processor architecture, a given set of ap-plications and a fixed amount of instructions. What has been missing so far is a sensitivity analysis of prediction accuracy regarding
– the amount of applications sharing a cache in parallel (e.g. a comparative analysis of prediction accuracy in case a cache is shared by 2, 4 or 8 processor cores) and
– the amount of instructions applied for a prediction (interval size).
To overcome this problem, an evaluation framework should not focus on a specific architecture or a specific amount of processor cores sharing a cache, but be indifferent with respect to those characteristics. Further, the amount of instructions to be incorporated in the prediction process should be parameterizable.
• Further, the framework should be made up from build-ing blocks, renderbuild-ing it possible to add evaluation methods as plug-ins.
• In order to make evaluation results reproducible and errors easy to find, a notation should be applied that makes it easy to determine the application, interval size, co-schedules etc. applied within a prediction process.
IV. A NEWCACHECONTENTIONPREDICTION EVALUATIONFRAMEWORK
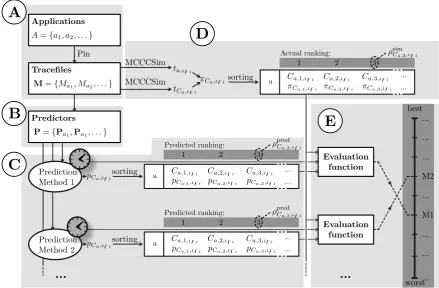
In this section, I present a new cache contention evaluation framework that implements all the requirements proposed in the last section. See figure 3 for an overview of the evaluation framework. As the framework has to support techniques that predict cache contention of application co-schedules only in relation to one another, the framework evaluates these techniques by comparing ranking lists of actual vs. predicted cache contention as follows:
Part (A) extracts memory references from applications and stores them to tracefiles; part (B) calculates predictors; part (C) applies those predictors to estimate cache contention; part (D) calculates a ground truth reference; part (E) compares the predictions to the ground truth reference and evaluates the prediction methods accordingly.
In the following I present those five steps in more detail.
A. Extracting Memory References
Part (A) of the evaluation framework addresses the pro-posed requirements that
• ground-truth values should be generated by an appro-priate cache simulator and
• prediction is solely based on predictors of solo applica-tions,
as it provides memory references as input to the ground-truth simulator and the process of predictor calculation. As indicated in figure 3, the evaluation framework ap-plies the Pin toolkit [8] to extract memory references
M = {Ma1, Ma2, . . .} from a set of applications A =
{a1, a2, . . .} and stores them to tracefiles: Given an
appli-cation a ∈ A, Pin interrupts program execution on each memory reference ofa and stores the referenced address to a buffer. Whenever the buffer represents memory references of 220 instructions, the buffer is written to disk. Then,
the buffer is reset and memory references of the next 220
A={a1, a2, . . .}
Applications
Pin
Tracefiles
Predictors
P={Pa1,Pa1, . . .}
MCCCSim
MCCCSim ta,◆zi
tCa,◆zi
⇡Ca,◆zi a
1 2
Actual ranking:
... sorting
... 3 Ca,1,◆zi Ca,2,◆zi Ca,3,◆zi ⇡Ca,1,◆zi ⇡Ca,2,◆zi ⇡Ca,3,◆zi
⇢sim Ca,3,◆zi
Prediction Method 1
...
pCa,◆zi
pCa,◆zi Prediction Method 2
a
1 2
Predicted ranking:
... sorting
... 3
Ca,1,◆zi Ca,2,◆zi Ca,3,◆zi ⇢predCa,3,◆zi
a
1 2
Predicted ranking:
... sorting
... 3
Ca,1,◆zi Ca,2,◆zi Ca,3,◆zi ⇢predCa,3,◆zi
Evaluation function
Evaluation function
...
best
worst M2
M1 ...
...
... ... ... ... ...
C
B
A
D
E
M={Ma1, Ma2, . . .}pCa,1,◆zi pCa,2,◆zi pCa,3,◆zi
[image:5.595.77.517.54.342.2]pCa,1,◆zi pCa,2,◆zi pCa,3,◆zi
Fig. 3. Evaluation framework made up of five parts: (A) Extraction of memory references; (B) predictor calculation; (C) prediction of cache contention; (D) calculation of ground-truth reference; (E) evaluation. See section IV for a definition of the various symbols.
broad range of interval sizes as claimed in section III, I partition Ma into tuples of memory references that refer to interval sizes of z ∈ zz = { 220, 221, 222, 223, 224, 225, 226, 227, 228, 229
} instructions, i.e. ∀z∈zz:Ma 7→ Ma,ιz = (Ma,ιz1, . . . Ma,ιz|Ma,ιz|). In this definition, ι
means “instruction interval”, ιz is the set of “instruction intervals each referring to z instructions”, and ιzi means “instruction interval no. i in the set of instruction intervals each referring tozinstructions”;|Ma,ιz|is the total number of instructions related to memory referencesMa, divided by interval size z. Applying this partitioning scheme and the corresponding notation allows for a unique identification of the instruction intervals the memory references have been extracted from. When it comes to prediction, this identifica-tion scheme makes it possible to unambiguously relate the value of a prediction pCa,ιzi to the application a, the
co-scheduled applicationsCa, and the instructions the predictor has been obtained from, as instruction interval ιzi refers to
instructionsi·z. . .(i+1)·z−1. This transparency allows the whole research community to easily review and reproduce the results — or easily identify or locate errors if there are any, as it has been claimed in section III.
B. Calculating Predictors
Part (B) of the evaluation framework calculates the predic-tors as basic building blocks for the predictions, as claimed in section III. For this purpose, the evaluation framework applies the tuples of memory referencesMa,ιzi to calculate
predictors for the various cache contention prediction meth-ods to be evaluated. As an example for a prediction method, take one of the methods referenced by Fedorova et al. [3] or Chandra et al. [5]. As an example for a predictor, take solo
application miss rate [4] or an application’s stack distance histogram [9] [5].
As it is the key point for the introduction of predictors to distinguish between calculations performed at runtime and prior to runtime (cf. section III), a rule has to be defined to decide which calculations have to be merged to a predictor, and which calculations have to be calculated during the pre-diction phase. Without such a rule to unambiguously identify the parts that have to be calculated prior to prediction and which have to be calculated during the prediction process, prediction time of the various prediction methods would not be comparable and the evaluation results would be unreliable. In this framework, I apply the rule that predictors should incorporate as much information as possible.
What does that mean? Generally, cache contention predic-tion techniques merge informapredic-tion of co-scheduled applica-tions to calculate their predicapplica-tions. This means that there is a point in time within the prediction process you can only pass if you know the candidate co-schedules. As this information is definitely not available before runtime, this is a good point to distinguish between calculations that have to be included in the predictors and therefore do not account for prediction time, and those calculations that have to be performed during the prediction process and therefore do account for prediction time. As a consequence, predictors exclusively rely on characteristics of solo applications, i.e. there is a predictor for each a ∈ A and this predictor is not allowed to contain information of any other application
Ca ∈A\{a}.
C. Prediction
contention introduced to an applicationaby each application candidate co-schedule. As you can see from figure 3, predic-tions are referenced aspCa,ιzi. This means that their value
is a measure of cache contention introduced to applicationa
when co-scheduling instructionsi·z. . .(i+ 1)·z−1 ofa with instructionsi·z. . .(i+ 1)·z−1of each application in the set of candidate co-schedulesCa. As an example,amight be applicationastarandCa might be{bzip2,gcc,h264ref}, if applications are chosen from the SPEC 2006 benchmark set.
As you can see from figure 3, the output of part (C) is a ranking of candidate co-schedules based on the predicted amount of cache contention the candidate co-schedules in-troduce to application a. There is a separate ranking list calculated for each application a, each interval sizez∈zz and each intervali as follows:
• For each candidate co-schedule of applicationain inter-val ιzi, apply the prediction method to estimate cache contention introduced to application a as presented in algorithm 1.
• Measure usertimeτuser
Ca,systemtimeτ
syst
Ca, andelapsed
timeτCelapa as presented in algorithm 1.
• Sort all the predictions and assign each candidate co-schedule Ca,j its predicted ranking position ρpredCa,j,ιzi,
for example “1” if this candidate co-schedule is pre-dicted to introduce the least amount of cache contention to application a.
Algorithm 1Measuring user time, system time, and elapsed time.
1: Extract parametersa,Ca andιz
2: Begin timing by calling gettimeofday(...) and
getrusage(...)
3: for allιzi inιz do
4: Read predictors of intervalιzifor the selected method 5: CalculatepCa,ιzi
6: StorepCa,ιzi to buffer in RAM (random access
mem-ory) 7: end for
8: End timing by calling operating system functions
gettimeofday(...)andgetrusage(...)
9: Calculate τuser
Ca, τ
syst
Ca and τ
elap,
Ca from timeval and
rusagestructs
10: Writeτuser
Ca,τ
syst
Ca andτ
elap
Ca to disk
11: WritepCa,ιzi for allιzi∈ιz to disk
Compared to many state-of-the-art cache contention pre-diction evaluation techniques such as the one of Chandra et al. [5], the ranking of candidate co-schedules allows for a broad range of prediction methods to be evaluated with this framework: It is not necessary that a prediction technique estimates contention in terms of additional cache misses — the evaluation can also be applied on prediction techniques that only go for a relative evaluation of candidate co-schedules, where the absolute value of a predictor might not have any technical meaning, as it is claimed in section III.
D. Ground Truth Reference
Part (D) of the evaluation framework applies a cache simulator to calculate theactualamount of cache contention
for each candidate application co-schedule and creates a ranking list (cf. figure 3). In order to support a broad range of processor architectures, as claimed in section III, I apply the Multi-Core Cache Contention Simulator MCCCSim [2] for this task. As you can see from figure 3, the MCCCSim simulator takes as input the tuples of memory references
Ma,ιzi that have been generated by part (A). Given the
memory references, the framework performs the following steps:
• Simulate stand-alone execution for each applicationa∈ A for each interval size z∈zzand each interval ιzi
and determine memory accesstime ta,ιzi as described
in [2].
• For each possible candidate-coscheduleCa∈A\{a}of applicationa and each applicationa∈A, simulate co-scheduled execution of applications aandCa for each interval sizez∈zzand each intervalιzi, and determine memory accesstime tCa,ιzi of application a in case a
is co-scheduled withCa, as described in [2].
• For each applicationa∈A, calculate penaltyπCa,ιzi = tCa,ιzi−ta,ιz that co-scheduleCa introduces to afor each interval sizez∈zzand each intervalιzi. • For each application a, eachz∈zzand each interval
ιzi, sort the penalties by value and determine ranking
position ρsim
Ca,j,ιzi for the corresponding candidate
co-schedules.
For each application a, each interval size z and each intervalιzi, these rankingsρsimCa,j,ιzi determine the candidate
co-schedule that best/second best/third best/... minimizes the amount of cache contention introduced to applicationa.
E. Evaluation Functions
Part (E) of the evaluation framework analyzes and com-bines
• the amount of time to perform a prediction, • the predicted ranking positionsρpredCa,ιzi, and • the simulated ranking positionsρsim
Ca,ιzi
to generate an overall evaluation measure. As claimed in section III and as you can see from figure 3, evaluation func-tions can easily be integrated in the evaluation framework, as the framework provides a kind of plug-in mechanism.
In the following, I present some of the evaluation functions integrated in the evaluation framework.
• NMRD (Normalized Mean Ranking Difference) is an evaluation function that determines the average number of positions the predicted ranking is off the simulated ranking.
Let
– ψ be the amount of parallelism of the processor architecture, i.e. the number of processor cores that share the same cache (e.g. ψ= 2), and let
– Cψ
a be the set of all possible co-schedules of
application a that can be obtained from A\{a} in case of a processor withψprocessor cores, and let
– |Cψa| be the numbers of entries in setCψa, i.e. the
number of all possible co-schedules to an applica-tion athat can be obtained fromA\{a} in case of a processor with ψprocessor cores, and let
∆ρCa,ιzi = ρ
pred
Ca,ιzi−ρ
sim
be the distance between the predicted and the actual ranking position of co-schedule Ca in interval ιzi, then I calculate
so-called mean ranking difference MRD by
MRDCψ a,ιzi =
1
|Cψa| X
Ca∈Cψa
∆ρCa,ιzi,
[image:7.595.58.274.358.488.2]as presented in [1].
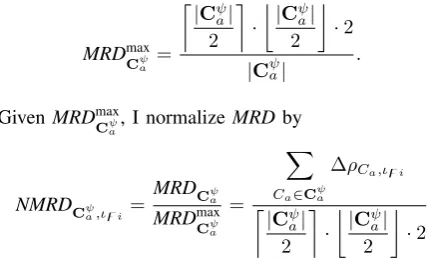
Figure 4 shows an example of an MRD mean ranking dis-tance value for the set of SPEC2006 benchmark applications
A={astar, bzip2, gcc, gobmk, h264ref, hmmer, lbm, mcf, milc, povray}, a= astar, ψ= 2. In interval ιzi, the actual best co-schedule toastarishmmer, the worst co-schedule is lbm. Forhmmer, there is a difference between actual and pre-dicted ranking positions of∆ρastar@{hmmer},ιzi =|1−5|= 4.
As the range of MRD values depends on the number of candidate co-schedules, MRD values for differentψ have to be normalized to the total number of candidate co-schedules in order to make them comparable to one another. To determine the maximum MRD value, I present figure 5. It is obvious that figure 5 a) represents a ranking with maximum MRD value for an even number of co-schedules and figure 5 b) represents a ranking with maximum MRD value for an odd number of co-schedules. Therefore, maximum MRD calculates by
MRDmaxCψ a =
|Cψ
a|
2
·
|Cψ
a|
2
·2
|Cψa|
.
GivenMRDmaxCψ
a, I normalize MRDby
NMRDCψ a,ιzi =
MRDCψ a
MRDmax
Cψa
=
X
Ca∈Cψa
∆ρCa,ιzi
|Cψ
a|
2
·
|Cψ
a|
2
·2
to obtain the so-called Normalized Mean Ranking Differ-ence NMRDCψ
a,ιzi that allows relative comparison of cache
contention prediction methods even for different values ofψ. In order to get an overall NMRD value for a givenψand a givenz,NMRDCψa,ιzi has to be averaged over alla∈A
and allιzi∈ιz:
NMRD(ψ,z) = 1
|A|· X
a∈A
1
|ιz|
· X
ιzi∈ιz
X
Ca∈Cψa
∆ρCa,ιzi
|Cψ
a|
2
·
|Cψ
a|
2
·2
.
Figure 6 shows an example output of the evaluation framework applying theNMRD(ψ,z)evaluation function as presented in [6]: Column 1 shows the name of the prediction method, while columns 2, 3, and 4 show NMRD performance in case ψ = 2, ψ = 4, and ψ = 8 processor cores sharing the L2 cache. Lower NMRD values indicate better performance. You can see that there is no great performance difference of the prediction methods regarding a variation in the number of processor cores. Further, variations in the size zof execution intervals have only limited effect on general ranking performance. Further, you can see that the “Miss
rate” method shows good prediction performance, as already discussed regarding Fedorova et al.’s method [3].
Besides NMRD, the evaluation framework supports many other evaluation functions:
• MP (Mean Penalty) enhances NMRD by evaluating execution time instead of ranking positions.
• PPBAB (Penalty Predicted Best vs. Actual Best) does not evaluate general ranking performance, but the ability of a cache contention prediction method to determine thebest co-schedule for a given application.
• PPBRS (Penalty Predicted Best vs. Random Selection) evalutes the gain in memory access time the best pre-dicted co-schedule achieves compared to the average memory accesstime of all candidate co-schedules. • The timing performance module calculates average user,
system and elapsed time for a prediction.
• Gain vs. Cost is an evaluation function that combines PPBRS values with the time required to perform a prediction in order to determine if a prediction method takes more time for prediction as it will gain from proper co-scheduling. In combination with an evaluation of different interval sizesz, this method can be used to determine the minimal interval size to make a prediction method become beneficial.
V. CONCLUSION
In this paper, I analyzed three state-of-the-art methods to evaluate cache contention prediction techniques. I showed that a hardware based evaluation, as it has been performed by Fedorova et al., might be a good technique to evaluate prediction accuracy of methods that do not only evaluate a prediction of cache contention, but a prediction of contention regarding the whole processor system. However, when it comes to an evaluation of cache contention prediction tech-niques only, a simulator based approach seems to be a better choice, as it makes ground-truth values rely on the same criteria as the predictors – although they might be less accurate predicting contention introduced from other components than caches.
Based on the discussion of state-of-the-art methods, I identified and discussed several requirements for a new cache contention evaluation framework. A key point has been eval-uating the difference between predicted vs. simulated ranking positions, as there are cache contention prediction techniques that allow for a relative evaluation only. A further key aspect has been the proper definition of predictors to distinguish between prediction steps that are performed at runtime and prediction steps to be performed prior to runtime.
Driven by the insights gained from the previous steps, I presented a new evaluation framework that extracts memory references from a set of computer applications, applies those memory references to calculate predictors and exploits those predictors to predict rankings of application co-schedules that minimize cache contention. To evaluate prediction accuracy, the rankings are compared to ground truth reference data obtained by the Pin framework and analyzed by a set of evaluation functions.
{hmmer}{povray}{h264ref} {gcc} {bzip2} {mcf} {gobmk} {milc} {lbm}
2.3 2.4 2.7 23.0 33.9 65.3 95.2 101.6 134.7
astar
1 2 3 4 5 6 7 8 9
{bzip2} {milc} {gcc} {gobmk} {hmmer}{h264ref} {lbm} {mcf} {povray}
202 252 300 623 652 662 808 1054 1071
[image:8.595.85.500.53.491.2]astar
|1 - 5| = 4 |2 - 9| = 7 |3 - 6| = 3
...
4 + 7 + 3 + ...
9 ...
Actual penalty:
Prediction: Ranking:
⇢simastar@{hmmer},◆zi ⇢predastar@{hmmer},◆zi
⇢astar@{hmmer},◆zi
MRDastar,◆zi=
37 9 ⇡4.11
Fig. 4. MRD mean ranking distance value as presented in [1].
1 2 3 4 5 6 7 8
a
a
1 2 3 4 5 6 7 8 9
a
a
a)
b)
⇢predCa,zi ⇢sim
Ca,◆zi
⇢predCa,zi ⇢simCa,◆zi
Fig. 5. Determination of the maximum MRD mean ranking distance value fora)an even number of candidate co-schedules, andb)an odd number of candidate co-schedules. Identical co-schedules in both simulated and predicted rankings are indicated by connecting lines.
ranking performance. As presented in [3] by Fedorova et al., miss based prediction methods showed good predic-tion accuracy. Further, no significant variance in predicpredic-tion accuracy has been observed varying either the number of instruction applied for prediction or the amount of applica-tions accessing the shared cache in parallel. The evaluation framework is licensed under GPLv3 and can be downloaded from http://www.ldv.ei.tum.de/cachecontention.
REFERENCES
[1] M. Zwick, F. Obermeier, and K. Diepold, “Predicting Cache Contention with Setvectors,” inProceedings of the International MultiConference of Engineers and Computer Scientists 2010, S. I. Ao, O. Castillo, C. Douglas, D. Dagan Feng, and J.-A. Lee, Eds. Newswood Limited, Hong Kong, 2010, pp. 244–251.
[2] M. Zwick, M. Durkovic, F. Obermeier, W. Bamberger, and K. Diepold, “MCCCSim - A Highly Configurable Multi Core Cache Contention Simulator,” Tech. Rep., 2009.
[3] A. Fedorova, S. Blagodurov, and S. Zhuravlev, “Managing Contention for Shared Resources on Multicore Processors,”Communications of the ACM, vol. 53, no. 2, pp. 49–57, 2010.
[4] R. Knauerhase, P. Brett, B. Hohlt, T. Li, and S. Hahn, “Using OS Observations to Improve Performance in Multicore Systems,” IEEE Micro, vol. 28, no. 3, pp. 54–66, 2008.
[5] D. Chandra, F. Guo, S. Kim, and Y. Solihin, “Predicting Inter-Thread Cache Contention on a Chip Multi-Processor Architecture,” Proceedings of the 11th International Symposium on High-Performance Computer Architecture, 2005, pp. 340–351, 2005.
[6] M. Zwick, “Predicting Cache Contention in Multicore Processor Sys-tems,” Ph.D. dissertation, Technische Universit¨at M¨unchen, Apr. 2011. [7] A. Settle, J. L. Kihm, A. Janiszewski, and D. A. Connors, “Architectural Support for Enhanced SMT Job Scheduling,” inProceedings of the 13th International Conference of Parallel Architectures and Compilation Techniques, 2004, Sep. 2004, pp. 63–73.
[8] C.-K. Luk, R. Cohn, R. Muth, H. Patil, A. Klausner, G. Lowney, S. Wallace, V. J. Reddi, and K. Hazelwood, “Pin: Building Customized Program Analysis Tools with Dynamic Instrumentation,” inProceedings of the ACM SIGPLAN Conference on Programming Language Design and Implementation, 2005, 2005, pp. 190–200.
NMRD 2 cores
0.0 0.2 0.4 0.6 0.8 NMRD
2 cores
NMRD 4 cores
0.0 0.2 0.4 0.6 0.8 NMRD
4 cores
NMRD 8 cores
0.0 0.2 0.4 0.6 0.8 NMRD
8 cores NMRD
8 cores DMiss (set, sens38) DMiss (one, sens38) DMiss (one) Diff (one, two) Diff (one, set, acc) Diff (one, missrate) Diff (set, mask) Diff (one)
DMax (set, exp, acc, mask) DMax (set, acc, mask) DMax (one, set, acc) DMax (set, mask) DMax (one, set, inf) DMax (one, set) DMax (one) Activity (set, mask) Activity (set) Activity (superset) Miss rate
Misses (set, mask) Misses (one)
Pain (set, sens38, misses) Pain (set, misses) Pain (set)
Pain (one, sens38, misses) Pain (one, misses) Pain (one, sens38) Pain (one)
Width (set, mask, exp delta) Width (set, mask)
Width (one) Prob
SDC (lru set group) SDC (set)
SDC (one) FOA (set, mask) FOA (set) FOA (one)
1 2 4 8 16 32 64 128 256 512
[image:9.595.84.508.100.705.2]Interval width [million instr.]:
Fig. 6. NMRDperformance evaluation of several cache contention prediction techniques (left column) forψ∈ψψψ={2,4,8}processor cores and interval sizesz∈zz={220,221,222, 223,224,225,226,227,228,229}instructions, averaged over intervals ιzi ∈ ιzreferring to the first 512 million
APPENDIX
FREQUENTLYUSEDSYMBOLS
Symbol Meaning
a Application
A={a1, a2, ...} Set of applications
|A| Number of applications in set A
act Actual
Ca Set of applications∈A{a}that are
co-scheduled to applicationa
dCa Degradation that the set of co-schedulesCa
introduces to applicationa
z Interval size; amount of instructions on which
the simulations are performed
z
z Set of interval sizes, e.g.
z
z={220,221, ...,229}
E Evaluation metric
IPC Instructions per cycle ITKO Inter-Thread-Kick-Outs
µa Amount of cache misses of applicationaon
stand-alone execution
µCa Amount of cache misses of applicationawhen
ais co-scheduled withCa
NMRD(ψ,z) Normalized Mean Ranking Difference
evaluation function to evaluate general ranking performance
πCa,ιzi Penalty (amount of cache contention)
introduced to applicationain execution intervalιziwhen co-schedulingawith
candidate co-scheduleCa
pred Predicted
ρpredCa,j,ιzi Predicted ranking position of candidate co-scheduleCa,j
ρsimCa,j,ιzi Simulated (i.e. actual) ranking position of candidate co-scheduleCa,j
ta Memory access time or program execution
time of applicationaon stand-alone execution tCa Memory access time or program execution
![Fig. 1.L2 cache hitrate degradation introduced to SPEC 2006 benchmarkmilc when co-scheduling milc with each of the SPEC 2006 benchmarksastar, gcc, bzip2, gobmk, and lbm on a CMP dual-core architecture aspresented in [1].](https://thumb-us.123doks.com/thumbv2/123dok_us/1276700.655919/1.595.315.542.237.418/hitrate-degradation-introduced-benchmarkmilc-scheduling-benchmarksastar-architecture-aspresented.webp)
![Fig. 2.Dual-core processor architecture as presented in [2]. While theL1 caches are private to the processor cores, the L2 cache is shared, whichresults in L2 cache contention.](https://thumb-us.123doks.com/thumbv2/123dok_us/1276700.655919/2.595.67.274.51.284/processor-architecture-presented-private-processor-shared-whichresults-contention.webp)
![Fig. 4.MRD mean ranking distance value as presented in [1].](https://thumb-us.123doks.com/thumbv2/123dok_us/1276700.655919/8.595.85.500.53.491/fig-mrd-mean-ranking-distance-value-presented.webp)
