Abstract— This paper presents a sequential tuning of Power System Stabilizers (PSSs) for improving the damping of low frequency electro- mechanical oscillations in a multi-machine power system using parameter – constrained nonlinear optimization algorithm. This algorithm deals with optimization problem using a sequential quadratic programming. The main objective of this procedure is to shift the undamped poles to the left hand side of the s-plane. In the proposed work, the parameters of each PSS controller are determined by sequentially using non-linear optimization technique. The objective of the coordinated parameter tuning is to globally optimize the overall system damping performance by maximize the damping of all both local and inter area modes of oscillations. The results obtained from sequential coordinating tuning method validate the improvement in damping of the overall power system oscillations in an optimal manner. The time domain simulation results of multi- machine power system validate the effectiveness of the proposed approach. In this paper, 10- machine 39- bus New England system is used as the test system. Investigations revealed that the dynamic performance of the system with sequentially tuned PSS is superior to that obtained from the conventionally optimized PSS.
Index Terms— Coordinated tuning, Sequential tuning, Power System Stabilizer (PSS) , Non-linear Optimization, Sequential Quadratic Programming.
I. INTRODUCTION
Modern power system is characterized by the extensive system interconnection and increasing dependences on the control for optimum utilizations of existing resources.
Low frequency electro-mechanical oscillations are quite common problem in most interconnected power system today. These oscillations are due to the dynamic interactions between various generators of the system through its transmission network. Low frequency electro-mechanical oscillations (0.2 – 2.5 Hz) restrict the steady state power transfer limits, which therefore affect the operational system economics and security [1]. For the improvement of the dynamic stability of a system, Power System Stabilizers (PSS) are well known as a supplementary excitation control for intensifying the dynamic stability of the system. The addition of new damping sources [2],[3] to already
Manuscript received April 04,2012.
A.Mahabuba is with the AL Ghurair University, Dubai, U.A.E (Phone :0097155 6104051; e-mail: [email protected]).
M.Abdullah Khan is with B.S.Abdur Rahman University of Science and Technology, India.
stressed in interconnected power grids demand for new methods that can handle an overall coordination for the system controllers. Conventional design approaches, like the decoupled and sequential loop closure utilized in [4], cannot properly handle a truly coordinated design. Uncoordinated PSSs cause destabilizing interactions.
There are many approaches for finding solution to the problem of coordinated tuning stabilizers in multi-machine power systems. Xianzhang. et al [5] presented a global tuning procedure for FACTS device Stabilizers and PSSs in a multi-machine power system by minimizing the non-explicit target function. This method generally requires full system information.
Innocent Kamwa .et al[6] proposed a design approach for power system stabilizing controllers based on parameter optimization of compensators with generalized structures. This approach has developed an effective scheme for optimizing and coordinating damping controllers under various engineering constraints emphazing those ensuring robustness to model uncertainties.Davidson [7] and Polak [8] discussed controller tuning and coordination using decentralized design and also using constrained nondifferential optimization technique. Micheal .et al [9] discussed interactions occurrence between stabilizers in multi-machine power systems, the stabilizers being PSSs, FACTS device stabilizers or both. The interactions, which are identified and quantified, may enhance or degrade the damping of certain modes of rotor oscillation.
P.Zhang and A.H. Coonick [10] proposed a new method based on the method of inequalities for the coordinated synthesis of PSSs parameters in multi-machine power system in order to enhance overall system small signal stability. Antonio.L.B.do Bomfim[11] presented a method that simultaneously tune multiple power system damping controllers using Genetic Algorithms. L.J.Cai and L.Elrich [12] suggested the simultaneous coordinated tuning of the series FACTS Power Oscillation Damping controller in multi-machine power system. A.Doi and S. Abe [13] developed a new coordinated synthesis method by combining eigen value sensitivity analysis and linear programming applied to the This method is used to synthesize the coordination of power system stabilizers in a new multi machine system.
In this proposed paper, an optimization based tuning algorithm is proposed to coordinate among multiple PSSs by sequential tuning method. This algorithm optimizes the total system damping performance by means of sequential quadratic programming. In view of the above, the main objectives of the present work are:
Sequential Tuning of Power System Stabilizers
for Improving the Small Signal Stability in
Multi-machine Power Systems
1. To systematically optimize the PSS Parameters of a multi- machine power system by non linear optimization method.
2. To compare the system dynamic performance with optimum PSS obtained by sequential tuning with that of the conventional optimized power system stabilizers.
Section 1 discusses the introduction. Section 2 explains the system model with multi machine power system and the PSS model. In section 3, the proposed method of this research work has been discussed. Section 4 analyzes the simulation results. Section 5 gives the conclusion.
II. SYSTEMMODEL
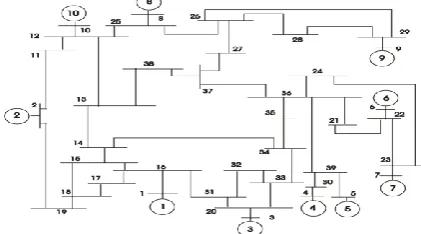
[image:2.595.55.266.358.475.2]In this research work, New England 10-machine 39-bus power system shown in Fig.1 is considered. Each generator of the test system is described by a two-axis fourth order model. IEEE type ST1A model excitation system has been included. System data and excitation system data are extracted from[14]. Assumptions for the two-axis model and linearized equations used for the system modeling are described in [15]. Non linear model is linearized around an equilibrium point, in order to get system model in state space form
Fig.1. New England Test System (10- machine 39- bus)
[image:2.595.342.502.547.674.2]PSS has a transfer function consisting of a wash– out block, a lead-lag phase compensator circuit and a stabilizer gain block. [16]. The structure of the used PSS is illustrated in Fig.2.
Fig. 2. Power System Stabilizer (PSS)
The transfer function of the PSS is given in equ (1): 1
2
1
1
1
s PSS
sT
sTw
V
K
sTw
sT
(1) where KPSS is the PSS gain, Tw is the washout time constantand T1 and T2 are the compensator time constants.
III. PROPOSED METHOD OF COORDINATED TUNING OF PSSS
In this work, the parameters of each PSS controller are determined by sequentially using non-linear optimization technique. The main procedure is as follows:
1. System linearization for analyzing the dominant oscillation modes of the power system.
2. .Identification of the location of PSSs in the multi-machine power system using Participation Factor method. 3. Using the parameter constrained non-linear optimization to optimize the global system behavior.
Detailed description of above three steps for the optimization based coordinated tuning is as follows:
The total linearized system model extending the PSS is derived and can be represented as the state space model by
the equation (2):
x
A x
B u
y
C x
D u
(2) From eqn (2) , the Eigen value, λi = σi ± jωi, (for thecritical mode i) of the total system can be evaluated. Damping ratio of the ith critical mode is given by equ (3):
)
(
2
2
ii (3) The proposed method is to search the best parameter sets of
the controllers so that a comprehensive damping index (CDI) minimized. The comprehensive damping index can be
represented in equ (4) as [12],
CDI = 1
(1
)
n
i i
(4)where n is the total number of dominant eigen values which include the inter-area modes[17] and local modes. The equ (4) is a non-linear function in terms of PSS controller parameters. Maximization of this damping ratio (non-linear function) which is equivalent to minimization of non-linear function given in equ(4) in terms of PSS parameters.
The main objective of this method can be very clear with the help of the Fig. (3). Among the dominant critical swing modes, only those have damping ratio less than
critical are considered in the optimization. In the figure (3), + sign indicates eigen values before optimization. Where * sign indicates eigen values after optimization.* +Local Modes
* + Interarea modes
Fig 3. Objective of optimization
In order to minimize the comprehensive damping index, the non-linear optimization technique implemented in Matlab optimization tool box [18] is used. The selected function finds the minimum of a non-linear multivariable
function. Syntax for this function is given by equation (5): x = fmincon (fun, x0, lb, ub, options) (5)
This implies optimization starts at ‗x0‘ and finds the
Washout
Circuit Phase Compensator
Stabilizer Gain
[image:2.595.59.254.548.616.2]minimum ‗x‘ to the function i.e. objective function ‗fun‘ with lower bounds ‗lb‘ and upper bounds ‗ub‘ of PSS parameters to be optimized as inequality constraints.
The objective of the parameter optimization can be formulated as Non-linear programming problem expressed as in equ (6) with the constraints as in equ (7):
Min.f(z)=CDI (6) Subject to the constraints: E (z) = 0
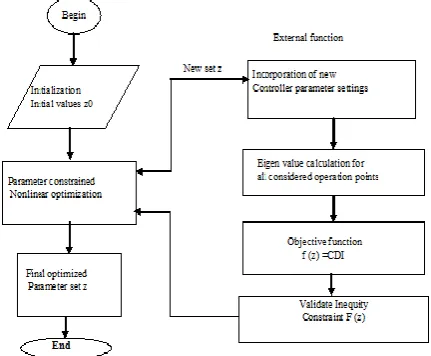
[image:3.595.316.516.325.506.2]F(z)≥0 (7) where f(z) is the objective function defined as eqn.(4).‘z‘ is a vector which consists of parameters of PSSs which are selected for tuning. In this case the parameters are PSSs gain (KPSS) and phase compensator time constant T1. E(z) is the equality functions and F(z) are the inequality functions respectively. For the proposed method, only the inequality functions F (z) that represents the parameter constrains of each controller.The optimization starts with the pre-selected initial values of the controllers parameters indicated as vector ‗z0‘. Then the non-linear algorithm is employed to adjust the parameters iteratively, until the objective function (eqn .4) is minimized. These so determined parameters are the optimal settings of PSSs controllers. This allows considering several operating points of the system simultaneously. So the CDI is calculated for each state successively and added to the global CDI provided for the optimization algorithm. This algorithm expressed as a flowchart is given in Fig.4.
Fig. 4. Flowchart of optimization based co-ordinated tuning
A. Sequential Tuning Algorithm
Tuning procedure proposed in the [20] essentially tunes the parameters of all PSS`s in the system simultaneously for different operating conditions. The results obtained in this simultaneous tuning reveals that the adequate damping could not achieved for each one of the critical modes. So damping of each one of the critical modes, taken one at-a-time, is maximized by separately tuning the parameters of the respective PSS.
1. Most critical mode is chosen first from the selected swing modes of the different operating conditions.
2. Damping of the most critical mode is maximized by tuning only the parameters of PSS connected to the corresponding machine, with no other PSSs included in the system.
3. If damping is inadequate, one more PSS is located at the corresponding machine with next highest magnitude of participation factor for the first critical mode.
4. Above steps are repeated until damping of the first critical mode is found adequate.
5 .Steps 1-4 are repeated for other critical modes one at a time.
IV. SIMULATION RESULTS
Non-linear function ‗fmincon‘ is used for the optimization of the objective function of the each machine and results are taken separately. Problem is formulated as in equ (8): Min. (1- ζ ) =1 - KPSS GEP (jω) (1+ωn2T22)1/2
2ωnM(1 +ωn2T2 2)1/2
(8) Subject to the constraints
10 ≤ KPSS ≤ 90 0.001 ≤ T1 ≤ 1.6 where GEP (jω) is the plant transfer function, ωn is the natural frequency of oscillations are calculated. The optimized controller parameters using equ (8) for all the ten machines are shown in Table.I. T2 and Tw are assumed to be 0.010 sec and 10 sec respectively.
TABLE.I OPTIMIZED CONTROLLER PARAMETERS
Gen.no KPSS T1 T2 Tw
1 12.0432 0.0010 0.010 10
2 38.064 0.0010 0.010 10
3 11.2791 0.0010 0.010 10
4 11.2792 0.0010 0.010 10
5 9.0056 0.0010 0.010 10
6 11.2792 0.0010 0.010 10
7 10.6075 0.0010 0.010 10
8 12.0432 0.0010 0.010 10
9 12.0432 0.0010 0.010 10
10 12.0432 0.0010 0.010 10
[image:3.595.65.281.390.568.2]These optimized controller parameters are used for as sequential tuning. It is therefore necessary to install one or more PSS to improve the dynamic performance. For the nominal operating condition, the critical swing modes and their corresponding damping ratio and frequency are shown in Table.II.
TABLE II. SWING MODES OF NEW ENGLAND TEST SYSTEM (NOMINAL OPERATING CONDITION)
Eigen Values Damping Ratio Natural Frequency (Hz)
-1.036 ± 9.70i 0.1062 1.5533
-0.835 ± 8.73i 0.0952 1.3973
-1.038 ± 7.82i 0.1317 1.2558
-1.98 ± 7.277i 0.2628 1.2004
-0.539 ± 6.64i 0.0808 1.0612
-0.501 ± 6.41i 0.0779 1.0239
-1.06 ± 6.40 i 0.1635 1.0326
-0.67± 5.463i -0.706±3.58i
0.1217 0.1933
[image:3.595.320.531.601.769.2]From the damping factors of the Eigen values, it is observed that the damping of all the swing modes is unsatisfactory. (
Value is less than 0.4) Hence it is required to introduce sufficient damping for each mode using PSS. The robust tuning of the PSS`s is demonstrated by considering three different operating conditions as follows:a) Line outage (21-22) in the system
b) Line outage (21-22) and 25% load increase in the 16th and 21st bus
c) 25% generation increase in generator 7.
The critical swing modes, their corresponding damping ratios and frequency are summarized as in Table. III, Table. IV and Table.V.
TABLE.III. SWING MODES OF NEW ENGLAND TEST SYSTEM (OPERATING CONDITION (A))
Eigen Values Damping Ratio Natural Frequency (Hz)
-0.96 ± 9.74i 0.0986 1.5580
-0.83 ± 8.73i 0.0952 1.3973
-1.03 ± 7.82i 0.1317 1.2558
-1.98 ± 7.27i 0.2628 1.2004
-0.53 ± 6.64i 0.0808 1.0612
-0.50 ± 6.41i 0.0779 1.0239
-1.06 ± 6.4 i 0.1635 1.0326
-0.67± 5.463i 0.1217 0.8760
[image:4.595.304.543.68.237.2]-0.70± 3.58i 0.1933 0.5816
TABLE.IV. SWING MODES OF NEW ENGLAND TEST SYSTEM (OPERATING CONDITION (B))
Eigen Values Damping Ratio Natural Frequency (Hz)
-0.956 ± 9.7649i 0.0975 1.5616
-0.858 ± 8.7064i 0.0982 1.3924
-0.931 ± 7.982 i 0.1160 1.2791
-1.760 ± 7.406 i 0.2315 1.2107
-0.497 ± 6.560 i 0.0756 1.0471
-0.528 ± 6.338i 0.0830 1.0123
-0.824 ± 5.625i 0.1450 0.9049
-0.755 ± 4.921i 0.1516 0.7924
[image:4.595.40.297.384.501.2]-0.915 ± 3.124 i 0.2811 0.5182
TABLE.V. SWING MODES OF NEW ENGLAND TEST SYSTEM (OPERATING CONDITION (C))
Eigen Values Damping Ratio Natural Frequency (Hz)
-0.7684 ± 11.051i 0.0694 1.7632
-0.611 ±10.1157i 0.0603 1.6129
-0.8154 ± 9.0787i 0.0895 1.4507
-1.4222 ± 8.6217i 0.1628 1.3907
-0.5308 ± 8.2943i 0.0639 1.3228
-0.3265 ± 7.5605i 0.0431 1.2044
-0.2409 ± 7.1092i 0.0339 1.1321
-0.3061 ± 6.8213i 0.0448 1.0867
-0.2928 ± 4.3861i 0.0666 0.6996
A. Ranking of the Damping Ratio
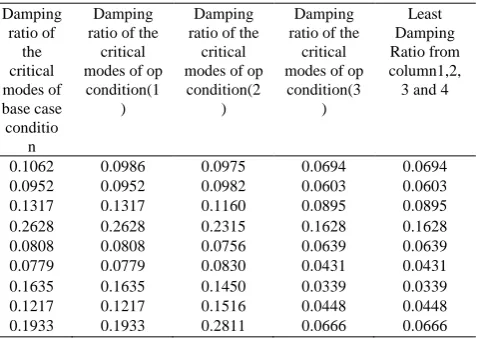
Four different operating conditions (including the nominal operating condition) are considered with the corresponding critical swing modes. The ranking of the swing modes are done based on the value of the damping ratios. For each critical mode, from the damping ratios of four operating conditions mentioned above the lowest damping ratio is found out. The ranking is shown in Table.VI
TABLE VI. RANKING OF THE DAMPING RATIO
Damping ratio of
the critical modes of base case conditio
n
Damping ratio of the
critical modes of op condition(1
)
Damping ratio of the
critical modes of op
condition(2 )
Damping ratio of the
critical modes of op
condition(3 )
Least Damping Ratio from column1,2,
3 and 4
0.1062 0.0986 0.0975 0.0694 0.0694
0.0952 0.0952 0.0982 0.0603 0.0603
0.1317 0.1317 0.1160 0.0895 0.0895
0.2628 0.2628 0.2315 0.1628 0.1628
0.0808 0.0808 0.0756 0.0639 0.0639
0.0779 0.0779 0.0830 0.0431 0.0431
0.1635 0.1635 0.1450 0.0339 0.0339
0.1217 0.1217 0.1516 0.0448 0.0448
0.1933 0.1933 0.2811 0.0666 0.0666
From Table.VI, the lowest value of the damping ratio in each row is chosen. Then from the fifth column of Table. VI, the ranking of the damping ratio has been done in the ascending order of the damping ratio as in Table.VII as follows: and arranged in ascending order of damping ratio as shown in Table.VIII
TABLE.VII
TABLE.VIII
In this ranking, all selected damping ratios are of corresponding to the operating condition(c). Table.IX shows the critical modes corresponding to the damping ratios are identified after ranking.
Least Damping Ratio from column1,2,3 and 4 of Table.8
0.0694 – order 7 0.0603 –order 4 0.0895 – order 8 0.1628 – order 9 0.0639 – order 5 0.0431—order 2 0.0339 -order 1 0.0448—order 3 0.0666 – order 6
Least Damping Ratio from column1,2,3 and 4 of Table.9 are arranged in order 0f
[image:4.595.41.250.540.659.2]TABLE IX. CRITICAL MODES CORRESPONDING TO THE DAMPING RATIOS WHICH ARE IDENTIFIED AFTER RANKING
[image:5.595.311.515.273.414.2]Afer this ranking, the optimum location for the selected modes will be done using Participation Factor method [19] method. Table.X indicates that the optimum locations of PSS`s corresponding to the critical modes after ranking of the damping ratios from the different operating conditions.
TABLE X..IDENTIFICATION OF THE LOCATION OF THE MACHINES FOR THE PLACEMENT OF PSS
[image:5.595.42.235.370.509.2]From Table. X, it was revealed that the PSSs are located in all the machines except for the fifth machine. Simulation results are taken after connecting PSSs to all the 9 machines for the operating condition-case(c). Optimized controller parameters are included in all PSSs. Table XI. shows the comparison between the damping ratios of the critical modes before and after placement of PSSs.
TABLE.X1. COMPARISON BETWEEN THE DAMPING RATIOS OF THE CRITICAL MODES
The simultaneous tuning method proposed in [20] reveals that the adequate damping could not be achieved for one of the critical modes. From Table.12, mode3, and its damping ratio and frequency is
To overcome this problem, sequential tuning is proposed for damp out the rotor oscillations. From the Table.XI, the most critical mode is of damping ratio 0.0339 (mode is -0.2409
7.1092i) which corresponds to the operating condition- case (c). Participation factors are found out for this selected mode. PSS is located based on the magnitude of the participation factor corresponding to speed component .Hence for the first critical mode (mode is -0.2409
7.1092i), the locating order of PSS will be as shown in Table.XII.
TABLE XII. MACHINE PARTICIPATION FOR THE MOST CRITICAL MODE
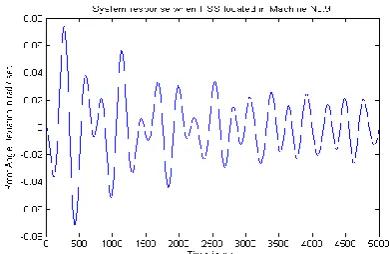
For the most critical mode ,( -0.2409 7.1092i), first PSS connected to the highest magnitude of the participation factor. The simulation result i.e., dynamic response of the rotor angle deviation (13) of the test system, when only one PSS with the optimized parameters is connected to the 9th machine because its highest participation factor is 0.3237 as per Table.12.is shown in Fig.:5.
Fig.5. System response of rotor angle deviation Δδ13 when PSS connected
to the 9th machine
From the simulation result (Fig.5), it is observed that the damping is not adequate. So one more PSS is connected to 10th machine corresponding to the next highest magnitude of the participation factor. Simulation result is as shown in Fig.6.
Critical modes Damping
ratio
Operating Condition
-0.2409 7.1092i 0. 0339 Case (c)i.e; 25% increase in Generator No.7
-0.32657.5605i 0. 0431. Case (c)
-0.30616.8213i 0.0448 Case (c)
-0.611210.1157i 0.0603 Case (c)
-0.53088.2943i 0.0639 Case (c)
-0.2928 4.3861i 0.0666 Case (c)
-0.768411.0517i 0.0694 Case (c)
-0.81549.0787i 0.0895 Case (c)
-1.42228.6217i 0.1628 Case (c)
Critical modes Optimum location
-0.2409 7.1092i Machine IX
-0.32657.5605i Machine I
-0.30616.8213i Machine X
-0.611210.1157i Machine VII
-0.53088.2943i Machine VI
-0.2928 4.3861i Machine II
-0.768411.0517i Machine III
-0.81549.0787i Machine IV
-1.42228.6217i Machine VIII
Critical modes Damping
ratio Before PSS
Damping ratio After PSS
-0.2409 7.1092i 0. 0339 0.3095
-0.32657.5605i 0. 0431. 0.3598
-0.30616.8213i 0.0448 0.1040
-0.611210.1157i 0.0603 0.4046
-0.53088.2943i 0.0639 0.1481
-0.2928 4.3861i 0.0666 0.2709
-0.768411.0517i 0.0694 0.3118
-0.81549.0787i 0.0895 0.3157
-1.42228.6217i 0.1628 0.3727
-0.30616.8213i 0.0448 0.1040
M/c no.
Participation factor Locating order of PSS
1 0.0054 third
2 0.0012 sixth
3 0.0008
4 0.0034 fifth
5 0.0035 fourth
6 0.0008
7 0.0005
8 0.0000
9 0.3237 First
[image:5.595.310.505.520.647.2]Fig.6. System response of rotor angle deviation Δδ13 when PSS connected
to the 10th machine
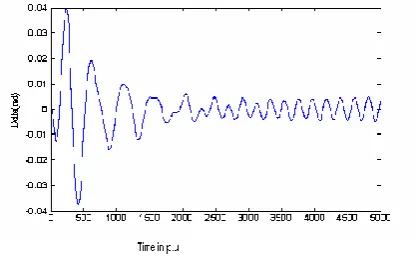
[image:6.595.49.271.54.179.2]In this case also (Fig 6), damping is not adequate. So one more PSS is included in the first machine which has next highest magnitude of the speed component. The dynamic response of the system when PSS located in the first machine is shown in Fig.7.
Fig. 7. System response of rotor angle deviation Δδ13 when PSS connected
to the 1st machine
[image:6.595.319.515.56.336.2]Simulation result of Fig.7 reveals that damping of rotor oscillations is not still adequate. So more PSSs are connected to the system in the locating order as shown in Table.XII. Finally well damped condition is obtained after connecting six PSSs with optimized parameters in the following order:Machine No.9,10,1,5,4 and 2.
The system responses when PSSs located in machine no.5,4 and.2 sequentially are shown in Fig 8- Fig.10.The dynamic responses improve their performance by step by step because of the location of PSS in the machine sequentially.
Fig.8. System response of rotor angle deviation Δδ13 when PSS connected
to the 5th machine
Fig.9. System response of rotor angle deviation Δδ13 when PSS
[image:6.595.320.504.224.357.2]connected to the 4th machine
Fig.10. System response of rotor angle deviation Δδ13 when PSS connected
to the 2nd machine
Hence finally PSSs are connected to the machines 9, 10, 1, 5, 4 and 2 of the system sequentially. In this case, simulation results demonstrate that the oscillations are well damped for each mode separately in the system. Totally six PSSs are connected sequentially in the system in order to get this condition. The above steps are repeated for all the selected modes in the Table XI to get the better damping performance in the system.
V. CONCLUSION
[image:6.595.71.279.281.392.2] [image:6.595.65.274.583.712.2]REFERENCES
[1] Hong. Y.Y.,and Wu. W.C,; ‗A new approach using optimization for tuning parameters of power system stabilizers, IEEE Transactions on Energy Conversion, 1999, 14(3), pp 780-786. [2] Hingorani, N.G.:‘ Power electronics in electric utilities: Role of
Power Electronics in future power systems‖.Proceedings of IEEE, April 1988.
[3] Larsen. E.V, Sanchez-Gasca. J.J.,and Chow. J.H., : ‗ Concepts of Design of FACTS controllers to damp power swings,. IEEE Transactions on Power Systems, 1995, 10,(2), pp.948-956. [4] Taranto. G.N, Chow. J.H.,and Othman. H.A.,: Robust
decentralized control design for damping power system oscillations:‘ Proceedings of the 33rd IEEE Conference on
Decision and Control, Orlando, FL, Dec.1994, pp 4080-4085. [5] Xianzhang Lei ., Edwin . N. Lerch., and Duscan Povh., :
‗Optimization and Coordination of Damping Controls for improving System Dynamic Performance, IEEE Transactions on Power Systems, 2001 , 16 , (3).
[6] Innocent Kamwa., Giles Trudel., and Luc Gerin –Lajoie. ,: ‗ Robust Design and Coordination of Multiple Damping Controllers Using Nonlinear Constrained Optimization , IEEE Transactions on Power Systems. , 2000 , 15,(3).
[7] Davison. , E.J. and Chang., T.N., : ‗ Decentralized controller design using parameter optimization methods, Int. Journal of Control Theory and Advanced Technology, 1986 , 2, (2) , pp. 131-154.
[8] Polak . E., and Salcudean, S.E. ,: ‗ On the design of linear
multivariable feedback systems via constrained
nondifferentiable optimization in H spaces, IEEE Trans. on Automatic Control, 1989, 34,(.3) , pp.268-276.
[9] Micheal.J.Gibbard. , David.J.Vowles. , and Pauyan Pourbeik,: ‗ Interactions Between , and Effectiveness of Power System Stabilizers and FACTS Device Stabilizers in Multimachine Systems, IEEE Transactions on Power Systems, 2000, 15,(3). [10] Zhang, P., and Coonick,.A.H., : ‗ Coordinated Synthesis of PSS
Parameters in Multi-Machine Power Systems Using the Method of Inequalities Applied to Genetic Algorithms, IEEE Transactions on Power Systems , 2000 ,15,(3), pp. 811-816. [11] Antonio .L. B.do Bomfim., Giauco.N.Taranto., and
Djaima.M.Falcao,: ‗ Simultaneous Tuning of Power System Damping Controllers Using Genetic Algorithms, IEEE Trans. on Power Systems, 2000, 15,(1).
[12] Cai., L.J. and Elrich. L., : ‗ Simultaneous Coordinated Tuning of PSS and FACTS Controller for Damping Power System Oscillations in Multi-Machine Systems.
[13] Doi , A., and Abe.,A, : ‗ Coordinated Synthesis of Power System Stabilizers in a multi machine Power System , IEEE Transactions on Power Apparatus and Systems, 1984, 103,(6), pp. 1473-1479.
[14] Padiyar, K.R. .: ―Power System Dynamics and Control`,Second Edition, BS Publication, Hyderabad, AP, 2002.
[15] Anderson, P.M. and Fouad,A.A ., Power System Control and Stability, The IOWA state University Press, Ames, IOWA, USA, Galgotia Publication, 2003).
[16] Yao-nan Yu, ‗ Electric Power System Dynamics, Academic Press Publications, New York, 1983.
[17] Juan J.Sanchez-Gasca., and Joe. H.Chow, :‗Power System Reduction to simplify the design of damping controllers for inter- area oscillations, IEEE Transactions on Power Systems, 1996 , 11,(2).
[18] Matlab Optimization Tool Box (1999), User‘s Guide, Version 2. [19] Hsu, Y.Y., and Chen, Y.Y.,: ‗Identification of optimum location for stabilizer applications using participation factors, IEE Proceedings, 1987, 134, (3), pp. 224-238.