THE WATER RELATIONS OF SNAILS AND SLUGS
I. WEIGHT RHYTHMS IN HELIX POMATIA L.
BY N. H. HOWES AND G. P. WELLS.
(From the Department of Zoology, University College, London.)
(Received $th December, 1933.)
(With Eight Text-Figures.) CONTENTS.
PAGE
I . I n t r o d u c t i o n 3 2 8 I I . D e s c r i p t i o n o f t h e w e i g h t r h y t h m . . . . 3 2 9 I I I . R e l a t i o n t o a c t i v i t y . . . 3 3 1 I V . R e l a t i o n t o e n v i r o n m e n t a l v a r i a t i o n s 3 3 2 V . R e l a t i o n t o u p t a k e o f f o o d a n d w a t e r . . . 3 3 4 V I . B e h a v i o u r o f s n a i l s i n h u m i d a t m o s p h e r e s . . . . 3 3 8 V I I . D i s c u s s i o n 3 4 1 V I I I . S u m m a r y . . . 3 4 2
I. INTRODUCTION.
ACTIVE life in the edible snail (Helix pomatia L.) is interrupted at intervals by resting periods of two types between which it is important to distinguish. They are (a) Hibernation, occurring during the winter months, and (b) Aestivation, a phase of comparatively short duration, occurring occasionally during the summer, and believed to be a response to unfavourable conditions. In both these resting phases the animal is completely withdrawn into its shell, but whereas in hibernation the mouth of the shell is typically closed by a dense calcareous plate, the epiphragm, whose secretion necessitates elaborate metabolic preparations (Barfurth, 1855; Brand, 1931), in aestivation it is closed merely by thin films of dried mucus, running either transversely across the shell mouth or from the rim of the shell to some hard object to which the snail has attached itself.
It has been known for some time that the water content of the animal varies with its activity. Duval (1930) found that the blood of hibernating and aestivating animals froze at a lower temperature than that of active animals, and Kamada (1933) measured the osmotic difference between hibernating and active blood with great precision. Brand (1931), working on whole snails, found that the water content was greatest in active snails.
activity and aestivation in the following way: "L'animal etant colle, inerte, le A de son sang est inf^rieur a —0-40° et s'abaisse peu a peu. Une cause hydratante intervient-elle, pluie, rosee etc., la concentration du sang s'abaisse et quand elle devient infe'rieure a celle correspondant a A= —0-40°, l'animal s'eveille, sort de sa coquille, rampe, cherche sa nourriture, s'alimente.... Lorsque la cause d'hydrata-tion a cesse, l'animal se dehydrate assez rapidement et quand le A de son sang atteint —0-40° il redevient inerte, rentre dans sa coquille. II restera dans cet etat d'engourdissement jusqu'a ce qu'une cause d'hydratation vienne de nouveau faire remonter le A." Fischer (1931, p. 181) suggests that hibernation is a result of falling temperature and dehydration "dont l'apparition en automne semble seule-ment regularised et favorisee par un rhythme physiologique acquis."
But there can be no doubt of the importance of internal factors in determining the onset of hibernation. Kiinkel (1916) was unable to prevent hibernation in autumn by warmth, moisture or plentiful food, and Fischer (1931) was unable to induce it in July by cold or by injections of calcium salts. Once the hibernating condition has been assumed, the snails can easily be reawakened as early as November by warmth, moisture and light, or on the other hand they can be kept hibernating in a refrigerator for over a year, so that the duration of the resting phase is conditioned by environmental influences, but the onset of hibernation seems to be a necessary outcome of metabolic preparations made during the summer. We made a casual observation which suggested that aestivation also might be determined in some measure by conditions internal to the organism. In a large stock of snails kept for another purpose there were usually a certain number of aestivating animals, while others in the same box were active. As it seemed to us unlikely that the climatic conditions should vary from part to part of the vivarium, we inferred that either the snail population included individuals of different activity, some being inclined for reasons of their own to aestivate, or that there was a tendency for phases of aestivation to alternate with phases of activity during the life of any one individual, even under approximately constant external conditions, so that at any time some of the animals would be in either phase.
In order to explore these possibilities further, we set up an experiment as follows. A number of snails were isolated and kept under individual observation for a period of eleven weeks, from April 19th to July 6th, 1932. Each animal was kept alone, under a glass bell-jar. The jars rested on glass plates, being supported by short V-shaped glass rods in such a way as to allow free circulation of air under the rim of the jar (Fig. 1). Under each jar there were two glass dishes, one for food and the other for water. For several weeks the animals were given cabbage only; later the diet was varied from day to day (apple, tomato, carrot, bread-and-milk, etc.).
The snails were weighed daily, to o-i gm., and at the same time a note was taken of their condition. The results of the weighings will be considered first.
hibernating weight (after removal of the epiphragm); this enables the graphs of snails of different absolute weights to be compared. The results are calculated to the nearest 1 per cent.
II. DESCRIPTION OF THE WEIGHT RHYTHM.
[image:3.451.98.359.219.494.2]Fig. 2 shows part of the records of two animals from this experiment. It will be seen at once that the weights of the animals show enormous day-to-day fluctuations, presenting the appearance of a somewhat irregular rhythm. In one extreme case (animal A 5, June 16-17)t n e weight increases in 24 hours from 127 to 197 per cent, of the hibernating weight—an increase of over half. At no time does the weight remain even roughly constant, as long as the snails are active.
Fig. 1.
Including this preliminary experiment, we have made individual day-to-day weight records of over a hundred snails, the periods of observation varying from 8 days to 6 months. The animals were kept in a variety of different types of con-tainer. Every one of our records shows these weight fluctuations as long as the snails are active. Occasionally the snails enter into prolonged resting phases, being always withdrawn in the shell for ten days or more, and the fluctuations are sus-pended. We believe that fluctuating weight is a necessary accompaniment of active life in this species.
330
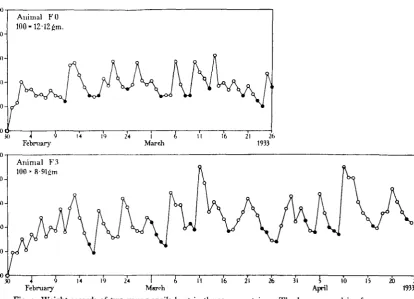
(such as the upper one in the figure) did not grow; others (such as the lower) grew— as evidenced by the gradual upward trend of the weight curve and by the deposition of new shell at the rim of the old. As the figure indicates, the weight fluctuations were more vigorous in the growing animals, which were presumably the most healthy. This confirms the view that weight fluctuations are a part of the normal activity of the snails.
At the beginning of each record, as the animal emerges from the hibernating condition, there is a sharp upward movement of the weight curve. This is due to
23 2fl 3 July TO2
200
180-
120-100
Animal A 9 100-15-18gm.
160-1
uo. VS.
3 June
23 28 )
July 1932
Fig. 2. Weight records of two specimens of Helix pomatia kept under different bell-jars on the same bench. In all figures, the letter before the animal's number designates the stock from which it was taken, i.e. animals with different letters come from different stocks. The weights are given as per-centages of the hibernating weight. • = hibernating, O = active, ® = withdrawn into shell, • = aestivating ("mucous veil").
water uptake, appearing also in snails kept without food. When a snail emerges from the hibernating condition it hydrates itself at once to the "active" level—• usually to somewhere about 130 per cent, of the hibernating weight—and then its weight fluctuates more or less widely round about that level.
shows incidentally variations in the weight of a single Helix pomatia weighed on several consecutive days, but he does not discuss the significance of these pheno-mena.
We find that the fluctuations are of varying period and amplitude, as the graphs show. Sometimes an animal will change suddenly from a rapid to a much slower oscillation, or vice versa (see, for instance, the beginning of the lower record in Fig. 3). The greatest recorded daily change of weight is the increase of over 50 per 200 -i
180-
160-
120-I 0 0 O
200
180-
140-
120- 1000-30
Anitnal FO 100-12-12 £m
24 6 16 21 26 5 10 15
[image:5.451.19.434.175.474.2]February March April
Fig. 3. Weight records of two young snails kept in the same container. The lower record is of an animal which grew, the upper of one which did not.
cent, shown by animal A 5 in Fig. 2. Changes approaching this in amplitude have been observed several times, and increases of 10-20 per cent, are common. The average values of the daily changes can be seen in Table I, which is described in the next section.
III. RELATION TO ACTIVITY.
We noted the activity of the animals at the time only of taking them for the daily weighings. Three states are distinguished on the records: (a) Active, the foot being out of the shell, (b) Mucous veil, the animal being withdrawn into its shell and the opening being closed by a film of dried mucus (this is the condition usually de-scribed as aestivation), and (c) Withdrawn, the animal being withdrawn into its shell
20 25
as in (b) but not having made a mucous veil. The three states are shown on the graphs by different kinds of points (see legend to Fig. 2).
It will be seen in the illustrations that there is a tendency for the animals to aestivate, or at least to withdraw, on the lower parts of the weight curves. Corre-sponding with the irregular weight rhythm there seems then to be an activity cycle. As the animals do not invariably aestivate at the minima of the curves, and as the statement made in the last paragraph rests only on the general impression left by looking at the records, we thought it worth while to confirm the relation between weight and activity statistically, in the following way. Any one snail, during any one day, shows a weight change and an activity change. If, for instance, an animal was active at 140 per cent, yesterday and is withdrawn at 125 per cent, to-day, its weight change is — 15 per cent, and its activity change is " active to withdrawn." Since we distinguished three activity states, there are nine possible types of activity change. One can therefore collect together the weight changes accompanying each of the nine types of activity change, and determine the mean weight change corresponding to each.
This analysis has been done on two different groups of data
Group A. The first part of the preliminary experiment of 1932, described above, and illustrated in Fig. 2, including seven fully grown animals studied for 33 days.
Group B. A group of animals obtained from a different source and kept all together, with food and water, in a large glass-fronted wooden box, in February, 1933. This group included twenty-seven fully grown animals studied for 25 days. The results are set out in Table I. It will be seen that the two groups give very strikingly similar results, although the observations were made at different times, on animals obtained from different sources, and kept in different kinds of container. The changes "active to withdrawn" and "active to mucous veil" are accompanied by a drop in weight, and the reverse changes by a gain. When an animal remains active, its weight on the average is constant—but a glance at the curves of Figs. 2 and 4 will show that this constancy results from the averaging, for an active animal is always gaining or losing weight.
This table leaves no doubt that the weight variations and activity variations are in fact correlated with each other.
To illustrate further the reproducibility of the main features of the weight rhythm, we have separated out the positive, zero and negative daily weight changes for the two blocks of data, and give at the foot of Table I the number and average magnitude of each of these three types of weight change. It will be seen that in both groups of data the negative changes outnumber the positive by roughly 1-5 to 1, and that their magnitude is correspondingly less. The mean magnitudes are closely parallel in the two sets of animals.
IV. RELATION TO ENVIRONMENTAL VARIATIONS.
humidity, determined by the whirling psychrometer, varied generally between 40 and 60 per cent, saturation, and whose temperature also varied slightly. We were unable to detect any correlation between the daily variations in humidity or tem-perature and the weight changes of the snails; moreover, it is shown below that fluctuations occur in animals kept at constant humidity and roughly constant temperature.
Table I.
Stock A (April-May, 1932, 7 animals for 33 days)
Activity change
Withdrawn to active Mucous veil to
active Mucous veil to
withdrawn Active to active Withdrawn to withdrawn Withdrawn to mucous veil Mucous veil to
mucous veil Active to withdrawn Mean weight change + 13-5
+ I I - I
+ 3-9 - 0-045 - i-86 - 3-0 - .VOS - 5\S
Active to ' — 7-1 mucous veil
Positive weight changes: Number 81
Mean +13-8
Zero weight changes: Number 17 Negative weight changes:
Number 133 Mean — 7 3 All weight changes together:
Number 231 Mean + 0-64
Number of obser-vations 1 2 24 IS
1 1 2
7
5
2 2
2
32
Stock B (February-March, 1933, 27 animals for 25 days)
Activity change
Mucous veil to active Withdrawn to active Active to active Withdrawn to withdrawn Mucous veil to
withdrawn Mucous veil to
mucous veil Active to withdrawn Withdrawn to mucous veil Active to mucous veil Mean weight change + io-6 4- 8-3 - 0-32 — O-22 - 1-4
- 4'1
- 4 1
- 6 0
- 6-2
Positive weight changes: Number 257 Mean 4-11'6 Zero weight changes: Number 24 Negative weight changes:
Number 367 Mean — 7-5 All weight changes together
Number 648 Mean 4- 0-37
Number of obser-vations 51 32
4 3 5
9 9 19 29 -> 62
334
due to variation from day to day of the physical conditions in the box, then the different animals will show correlated fluctuations; if there is no correlation between the animals, then the fluctuations may be taken as due to constitutional rather than environmental causes. Fig. 4 shows for each day the mean weight change for the whole group and its standard deviation. The weight changes are given as per-centage of the hibernating weights of the animals. The S.D. values are enormous compared with the variations of the mean, which latter does not depart significantly from zero. Evidently the snails are all fluctuating independently, and the weight changes, far from being correlated, tend to cancel each other out.
+20 %
+10
-10
-20
10 15 February
20
March1933
Fig. 4. Daily mean weight change, and its standard deviation, of twenty-seven animals kept in the same container. The white break in each column indicates the mean weight change for that day; the columns extend in each direction for a distance equal to the 8.D.
It will be noted, in Figs. 3, 5 and 8, that the curves of animals kept in the same container generally rise on different days. This confirms that the weight changes are due to some activity of the animals and are not responses to environmental varia-tions.
V. RELATION TO UPTAKE OF FOOD AND WATER.
The animals so far described were supplied with food and water. Further experiments were undertaken to find out whether the weight fluctuations are due to changes in the food content of the gut or in the water content of the whole animal. To decide this point, animals were deprived of food or water or both, and weighed as before from day to day.
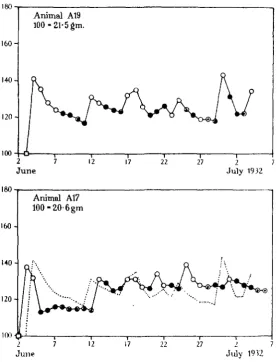
Fig. 5 shows the records of two fasting snails, kept with water but no food, from the preliminary experiment of 1932. It will be seen that the weights show con-siderable fluctuations, although the amplitude of the fluctuations is not so great as in the fed animals from the same stock (compare Fig. 2). Moreover, the fasting animals spend less of their time in the active condition.
in-dividual bell-jars as shown in Fig. 1. The record falls into four parts. First the animals were given water but no food, then both water and food, then food but no water, then water and food again. The food in this experiment was varied from day to day—cabbage, potato, carrot, turnip, apple, etc., all of which proved acceptable to the snails. Weight fluctuations appear on the curves whenever water is available,
27 2 7
July 1932
160-
I40-
120-I00 J
Animal 100-20 6gmA17
2
June
12 17 22 27
[image:9.451.90.368.158.520.2]July 19 \1
Fig. 5. Weight records of two fasting Helix pomatia, kept in the same bell-jar (Fig. i). The upper graph is transferred as a dotted line on to the lower, to facilitate comparison.
336
It is evident from these facts that the primary cause of the weight fluctuations is variation in water content. It remains only to enquire how the amplitude of the fluctuations is increased by the presence of food.
Table II facilitates the comparison between the curves obtained in the presence
ill 111 I- . 1 I . ll •
10 15 20 25 30 421 2b 31
October
10 15 20 25 30 5
November December 1932 January 1933
ISO-
I40-
120-FOOD AND WATER
. - • I I I
FOOD, NO WATER FOOD AND WATER
19 24 2") i ~S" January February
Fig. 6. Weight record of a single individual, deprived part of the time of food or of water. \ — animal ate, f = animal defaecated. Defaecations were not recorded before January 7th. The columns below the graph show the approximate amounts of food eaten, to the same vertical scale. Other signs as in Fig. 2.
Table II.
Positive weight changes Number Mean Zero weight changes
Number Negative weight changes
Number Mean
All weight changes together Number
Mean
Pe (3 fasting an
Absolute figures 35 + 3-60 13 54 - 2 - 3 9
102 - 0 0 3
Period A
Numbers as ";, of all
weight changes together 34'3 12-7 53'° ioo-o Period B (3 fed animals for 58 days)
Absolute figures 63 + 8-63 18 93 - 4 - 8 0
174
+ 0-515
Numbers as % of all
and absence of food. The data for the three animals, of which the individual of Fig. 7 is one, are pooled together, and the following periods are compared:
Period A. The period of 34 days from October 27th until food was given (this excludes the first 5 days, when the course of the curve is atypical owing to emer-gence from hibernation).
Period B. The first 58 days of the first of the periods during which both food and water were given.
For each period the daily weight changes are separated into positive, zero and negative, and the numbers and average magnitudes of each class of weight change are tabulated. It will be seen that the numbers of positive, zero and negative weight changes are almost exactly in the same proportion in the presence or absence of food, i.e. the general character of the curves is the same—but the amplitude of the fluctuations, as indicated by the mean weight changes, is roughly doubled in the presence of food. Now in Fig. 6 the days when the animal ate are shown by arrows above the curve, and the days when it defaecated by arrows below the curve. It is easy to tell by inspecting the food as it is removed whether the animal has eaten or not. On the whole there is a tendency for the snail to eat only on the rising parts of the curve. The correlation is imperfect; sometimes the animal puts on weight without eating, and sometimes it eats but loses weight; but analysis of the data shows that the correlation does in fact exist. The following calculation was made from the weight curves of the three animals for period B of Table II. During that time, the average daily weight change was +0-515 per cent. But if the weight changes on the days when the animals ate are separated out, their average comes to +5-91 per cent.— over ten times as great as the average weight change for all days together. This shows clearly that the snails tend to eat on the rising parts of the curve.
Presumably this is due to the fact, already demonstrated, that the animals are more active on the high parts of the curve; they will therefore be more likely to eat. The suggestion therefore presents itself that the increased amplitude of the weight fluctuations produced by feeding results simply from the superposition of a cycle of eating and defaecation on the original cycle of hydration and dehydration. The alternative is to suppose that the presence of food, by stimulating the metabolism of the snail, causes it to hydrate and dehydrate itself more vigorously.
338
We are therefore not at present in a position to produce a quantitative test of the alternative suggestions put forward above. We have shown graphically in the second period of Fig. 6 the approximate amounts of food eaten by the animal, expressed as percentages of its hibernating weight; these are derived by comparing the weight loss of the animal's food with that of control food exposed in a similar bell-jar, and we would again emphasise that they are submitted as a rough indication only of the quantities consumed. Two points, however, are clearly shown: the amounts eaten on rising parts of the curve are in general greater than those eaten at other times, and the amounts eaten on rising parts are in general insufficient to account for the rises, i.e. in addition to eating, the snail has taken water. These observations strengthen the picture of a feeding cycle superposed on a hydration cycle.
It appears then that the weight fluctuations are primarily due to changes in the water content of the animals, and that their amplitude is greater if food is given. The mechanism of the latter effect is, however, not clear.
Air—>• = Heating current
Water-To • absorption
tuba
Fig. 7. Apparatus for keeping snails in saturated air (see text).
VI. BEHAVIOUR OF SNAILS IN HUMID ATMOSPHERES.
Water may leave the body of a snail in either or both of two ways: (1) as a result of biological activities, such as locomotion, respiration, excretion, etc., and (2) as a result of passive evaporation through the moist skin. It occurred to us that the room air in which the animals were kept might be too dry, so that they were losing abnormally large amounts of water by evaporation. We therefore carried out experiments to find out whether weight cycles occurred in animals kept in saturated air.
very fine bubbles from the vessels of the cane. The air supply is more than enough to keep the funnel full, bubbles escaping round its rim. This ensures that a constant head of pressure drives the air through the rest of the apparatus, the air stream having therefore a constant rate. From the funnel, the air, saturated with water vapour at about 6o° C. and carrying a little steam from the surface of the water in the bath, passes down a long, straight inclined tube CC, in which it cools to room tem-perature, or nearly so. It then passes through the desiccator D. The snails are kept in this desiccator; below, in the compartment intended for sulphuric acid, is a supply of water with a wooden bridge for the animals to climb up and down on; above, on the shelf of the desiccator, is a dish of food. In our apparatus a second similar desiccator was inserted in series with the first, at E. After leaving the desic-cators, the air stream passes through a short length of capillary tubing F, across the ends of which a kerosene manometer is connected. This serves as a simple flow-meter. By previous calibration one can calculate from the manometer reading the rate of flow through the capillary, and, by passing the emerging air for known periods of time through U-tubes of pumice stone moistened with sulphuric acid, one can determine the amount of water in the air current and thus check its satura-tion.
During the experiments the walls of the desiccators became covered with drops of condensed moisture, and the shells of the animals inside them were damp to the touch. Mirrors left in the desiccators were dewed over with moisture. The con-densation was heavy in the first desiccator and light in the second, which was generally about 0-2° cooler than the first. The analyses of the emerging air averaged 100 per cent, saturated, but showed a wide scatter in both directions. This we attribute to inaccuracies in the flowmeter, and to small fluctuations in the air flow during the absorption in the U-tubes. We have no doubt, from the condensation in the desiccators, that the air inside them was in fact saturated. The flow rate through the apparatus was about 3-5 c.c. per second.
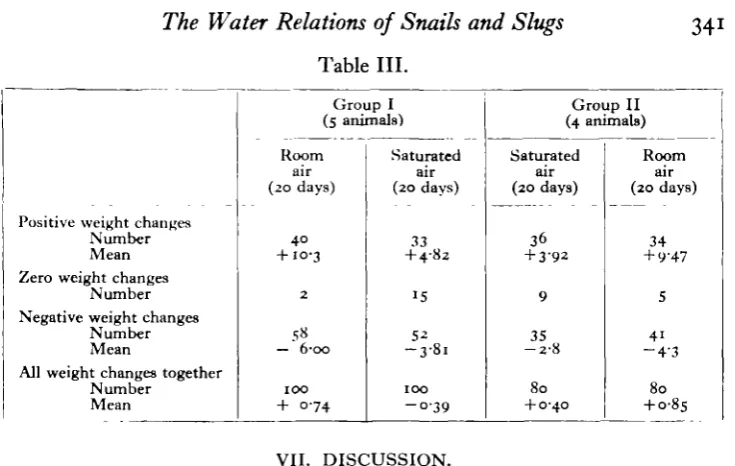
Extracts from the records of this experiment are given in Fig. 8. It will be seen that fluctuations do occur in the saturated air, even in the absence of food, but a glance at the earlier illustrations shows that the amplitude of the fluctuations is less in saturated than in room air. The differences in the curves obtained with the two atmospheres are shown in Table III. Two groups were employed, of four and five animals. At first Group 1 was in room air and Group 2 in saturated; the last 20 days of this period are taken for analysis in Table III. Then the groups were inter-changed, and the first 20 days after the interchange are analysed to compare with the first period. For each group of animals, and for each period, we have separated out the positive, zero and negative daily weight changes, and we give the number and mean magnitude of each kind of weight change.
34°
curves produced by high humidity. As positive and negative changes are converted into zeros in this way, the difference in amplitude of the saturated and room air
200'
180
160
-
120-100
Animal D69 100-15-Ogm.
18 23 28 2 7 December 1932 January
12 17. 22 27
1933
200
180
-
160140
120
-100
Animal C4 100-19-8gm.
18 23 December
12 17
1912 January
22 21
1935
Fig. 8. Weight records of two Helix pomatia kept throughout in saturated air. Before the date shown by vertical lines (January loth) the animals were given food and water; after, they received water only.
curves is really rather more than is indicated by the change in magnitude of the mean positive and negative changes.
Table III.
34
Positive weight changes Number Mean Zero weight changes
Number Negative weight changes
Number Mean
All weight changes together Number Mean Group I (5 animals) Room air (20 days) 40
+ 10-3
2
5« — 6-oo
100 + 074 Saturated air (20 days) 33 + 4-82 15 52 - 3 - 8 i
100 - 0 3 9
Group II (4 animals) Saturated air (20 days) 36 + 3-92 9 35
- 2 - 8
80 + 0-40 Room air (20 days) 34 + 9'47 5 41
- 4 ' 3
80
+ 0-85
VII. DISCUSSION.
It is evident from the foregoing data that snails are continually undergoing very considerable changes in hydration. Not only does the water content vary enor-mously when the animal is artificially subjected to extreme hydrating or dehydrating influences—changes so brought about have been described very often in the literature—but even in animals allowed, so to speak, to live their own lives, in the presence of abundant food and water, and in air which does not vary very drastically in its physical properties, the degree of hydration is continually fluctuating.
It is of course difficult to judge how the deliberately simplified conditions under which our animals were kept compare with the conditions under which the species lives in its natural habitat. Probably most of our animals were in air which was somewhat drier than that in which they would normally live. The air in human habitations is in general warmer and less saturated than that outside. But the experiments described in the last section show that fluctuations occur even in air saturated with water vapour. Moreover, the conditions in our experiments were not strictly constant but they were certainly less variable than those met with in the field. Altogether in the course of this work, we have plotted out weight curves of 114 snails, every one of which shows conspicuous weight fluctuations, and we have come to believe that a constant water content never occurs in the active phases of the life of this species.
We do not submit this communication as a final analysis of the hydration cycles, but merely as a basis for further investigation. For the present it is enough to note that the fact that snails, even under approximately constant conditions, are con-tinually hydrating and dehydrating themselves, throws suggestive light on two points that crop up in the literature.
desiccating conditions will promote and often cause aestivation. But we believe that the normal hydration cycle of the animals may also play a part. We found in our experiments that the animals tend to aestivate when their weight is low, and we have often noticed that two or more individuals kept together in the same container will aestivate on different days (Figs. 3, 5, 8), suggesting that the phenomenon is due in these cases to spontaneous variations rather than to climatic conditions. It seems likely that aestivation is the result of a low water content, and that the latter may be brought about either by dryness of the environment or else by the natural hydration cycle of the animals.
The second point is that the measurements published in the literature show enormous individual variation in the osmotic pressure of the blood of snails. Duval (1930) found that the freezing-point of the blood varied in hibernating animals from -0-39 to -0-42° C , and in active from -0-30 to -0-39° C. Kamada (1933, Table I), expressing the osmotic pressures in terms of the percentage NaCl in a solution isotonic with the blood, found a variation in hibernating animals of from 0-51 to 0-84 per cent, and in active from 0-43 to 0-55 per cent. This variability is not confined to the blood. Fischer (1931) determined the water content of several organs in a number of H. pomatia, and found great variations in every organ; there seems to be no part of a snail in which the water content is constant.
The variations in the hibernating animals can perhaps be attributed to loss of water during the hibernating period; it has been shown that the shell and epi-phragm are slightly permeable to water (Fischer, 1931). There is, however, a difference of opinion between authors, discussed by Brand (1931), as to whether the proportion of water falls, due to evaporation, or rises, due to combustion of other substances, during hibernation. As regards the active animals, we suggest that the very striking variation encountered is due at least in part to the hydration cycles which seem to be inseparable from active life in this species.
The active animals of Kamada's Table I, giving the range of variation cited above, were all kept together in a large wooden box with food and water—conditions similar to those under which many of our own animals lived. Duval's active animals, on the other hand, were collected in the field, "reveilles, actifs, se pro-menant," and he remarks " on voit tres nettement.. .que plus la concentration de ce milieu (the blood) est grande, moins l'animal est actif." It is interesting to note, in view of the previous discussion of the applicability of our results to animals in the wild state, that the active animals collected by Duval in the field showed about the same range of variation as the laboratory-kept animals of Kamada.
VIII. SUMMARY.
1. The weight of active specimens of Helix pomatia L. undergoes continual fluctuation, the changes from day to day being often of very great magnitude and presenting the appearance of an irregular rhythm.
4. The weight fluctuations are seen in animals given water but no food, and are not seen in those given food but no water. They are therefore due primarily to variations in the water content of the animals.
5. The amplitude of the fluctuations is greater in fed than in fasting animals. 6. Similar fluctuations, but of somewhat smaller amplitude, occur in snails kept in air saturated with water vapour.
The authors wish to thank Prof. D. M. S. Watson, F.R.S., for his continual interest and encouragement during the course of the work.
REFERENCES.
BARFURTH, I). (1885). Arch. Mikrosk. Anat. 25, 259. BRAND, T H . VON (193I). Zeit. vergl. Phytiol. 14, 200. DUVAL, M. (1930). Ann. phytiol. et physicochimie biol. 6, 346. FISCHER, M. P. -H. (1931). Thite sciences naturcllcs, Paris. KAMAUA, T . (1933). Juurn. Kxp. Biol. 10, 75.
KONKKL, K. (1916). Zur Biulogie der Lungenschnecken. Heidelberg: Carl Winter.