Statistical and Machine Learning Methods for the
Classification of Type -2 Diabetes Mellitus
Karuna Razdan1 , Dr. Parul Agarwal2
1, 2
Department of Computer Science and Engineering, Jamia Hamdard University
Abstract: Diabetes mellitus is a chronic disorder of glucose metabolism either due to the relative deficiency of Insulin or due to the failure of body to response to the action of insulin. Diseases leads to critical life threatening complications, if it remains undiagnosed and untreated. There is growing incidence of this disease all over the world. It has assumed epidemic form in Asian countries, China and India. Changing to urban life style, metabolic syndrome and obesity are some factors responsible for this increased prevalence. It is most common (90%) among the different types of diabetes.
It is recognised by raised fasting or post prandial blood sugar level. The review of literature shows that one model does not always give good performance in all situations and data frames. The study aimed to address this issue of classification by the use of statistical and machine learning models. Present study is conducted on Pima Indian diabetic dataset which is publicly available and is widely used for diabetes research. Unlike other datasets, medical datasets usually suffer from missing and unwanted data which needs proper handling so that classification accuracy is significantly improved. Therefore, in this study mean, median, and linear regression based imputing techniques are developed and outliers are handled using winsorizing approach. Classification accuracy on imputed data are compared with the accuracy on raw data. Results on mean and median based imputed data significantly outperformed as compared against the raw data.
Keywords: Type-2 Diabetes, Machine Learning, Imputing, Winsorizing
I. INTRODUCTION
Diabetes is a chronic metabolic disease caused if the pancreas is not capable of producing enough insulin or body tissues become resistant to the action of Insulin. Most of the food we eat is converted into glucose by our body metabolism. Insulin helps in the proper utilization of glucose as a source of energy by our body cells .Hence deficiency or resistance to the action of insulin leads to increased levels of blood sugar (Hyperglycaemia).It causes major complications of heart, kidney failure, blindness ,strokes etc. It has been reported that incidence of the disease has increased with time .According to WHO, number of adult diabetic patients has increased four times since 1980 to 2015.It caused 1.5 million deaths in 2012[7] . Diabetes will be a leading cause of death in 2030[2]
The disease has reached epidemic proportions in the world due to changes in the lifestyle of the people associated with westernization.[19]
Metabolic Syndrome characterized by large waist circumference ,hypertriglycedaemia, elevated blood pressure and increased fasting blood sugar (more than 100mg/decilitre) has been recognized important for the prediction of diabetes and its complications. To reduce the burden of the disease, government should formulate new guidelines on the diabetic management. Public should be made aware of this fatal disease& its complications. Medicines and diagnostic services should be available to all sections of community.[20]
II. LITERATURE REVIEW
Han Wu,Shengqi Yang,Zhangqin Huang,Jian He,Xiaoyiwang:They worked on PIMA Indian diabetic dataset . There is a great attention focused on the rising level diabetics in high risk groups who are unaware of the diseases and its complications. Use of health records and other social data could help educating these groups. Prediction accuracy of the diabetes is enhanced by the computational methods using WEKA soft ware Benefits of this model are that it does not change or delete the original data and can be applied to other datasets besides PIMA Indian dataset. limitations of this study are that it is time consuming.[1].
Nahla H.barakat, Andrew p.bradley and Mohamed Nabil H.Barakat:
In the context of diabetes we use Support Vector Machine computational model for the diagnosis of diabetes. Researchers have shown that the support vector machine provides a promising tool for the prediction of diabetes .A rule is generated with reasonable prediction accuracy using diabetic features as fasting blood glucose level and post prandial blood sugar level . This can be successfully used for prospective studies for diabetes prediction.[3]
Longfei Han,Senlinluo Jianminyu,Limin pan,Songjing Chen:
Used SVM for rules extraction using Ensemble learning approach to screen the diabetes. Their model showed high quality diagnosis precision(98%).[5]
Bum Ju Lee and Jong yeol Kim:
The study of the association between the Waist circumference feature of human phenotype , blood triglycerides and the typa-2 diabetes in adults is significant. The attributes taken into consideration is fasting blood glucose levels, Triglycerides levels and the physical measurements of the subjects. The evaluation is done by the use of logistic regression and naïve bayes . With These Prediction methods , it is found that there is strong association between the type-2 diabetes with waist circumference and triglyceride[6].
Exploring the reasons for developing diabetes mellitus various causal factors have been incriminated .These include diabetic pedigree, body mass index ,waist circumference ,central obesity& abdominal obesity .The life style and dietary changes due to environmental factors too have been blamed. The comparative study of different groups as pima Indian ethnic group mothers and Indian origin students verifies this relationship with diabetes using statistical computation[8]
The quality and quantity of available data is very important for prediction and statistical analysis This is more so for heath record analyses .The missing values may be ignored if they are scattered in the data or may be replaced .Always there should be effort to collect maximum precise data. Various techniques are used to replace the missing values [9] Hyan Kang discusses the importance of missing values and their handling. Efficiency of various statistical and classification models for diabetes show that results depend on the application. The complex data with more parameters may be suitable for one model and unsuitable for other. Feature and parameter selection needs experienced expert’s help to increase efficacy[10]Usually Weka softwear , which is available free , is used Wenqian Chen et al. Some times a single model may not give as good performance as combination of two or more models ,each model doing separate function one after other ,for example first may be used for data correction followed by another for classification [11]. The professionals and scientists are working together to develop an automatic machine to diagnose a disease especially diabetes and its early prediction in non diabetics .The accuracy of these machine models varies The study on Indian population shows satisfactory results[12] It is observed that on going clinical trials and patients registered with health care organisations all over globe generate huge data which may be unstructured and even fixed data .To utilize this useful information for patient care management, one has to change from older methods to machine learning effective tool. [13]
Retinal vessel pathology in diabetes and hypertension are important preventable cause of blindness . Images of fundus taken with special cameras and then are distantly visualized by the opthalmologists for early diagnosis . This branch of artifical intelligence namely deep learning is used to classify normal and retinal images. This needs further research to consolidate.[14]
Timothy S,Barley John Walsh and Jenine Y.Stone:
They discussed the data management ,decision analysis and algorithms for Diabetic care .Algorithms for Insulin adjustments have been developed for the diabetic self management[15].
Valeriyalyssenko and Markku Laasko: The study of interaction between environment and genes is vigorously investigated .Some single gene modifications have been identified . such genetic variants increased the risk of diabetes[16]. This needs to be researched further.
D.kerr,C.Axelrod,C.Hoppe,D.C.kioneff :
III. PROBLEM FORMULATION
Medical dataset are rarely clean and homogenous. Generally they are unbalanced, incomplete, and inconsistent. This could lead to wrong classification of the dataset for .any given model being used. Thus, pre-processing is an important step to obtain meaningful data in order to improve the classification The handling methods generally include filling missing values, outlier’s detection, features ranking etc. In this paper ,two way approach is presented to improve the classification :
A. Handling Missing Data
Three different methods are proposed to impute the missing values. They are:
1) Simple mean based imputation: In this approach first all missing data are removed from the dataset and then mean of the rest data is calculated and filled in place of missing data.
2) Simple median based imputation: Like simple mean based imputation, here also first all missing data have been removed and then median of the rest data is calculated and filled in place of missing data.
3) Linear regression based imputation: In this method first statistical significance (P<0.05) of one attribute is checked with rest of the attributes using t-test and the attribute having maximum dependent attributes will be considered for linear regression. Suppose if BMI is statistically significant with Plasma glucose concentration, Diastolic blood pressure etc. then linear regression will be performed between BMI and Plasma glucose, and considering BMI as independent variable and Plasma glucose concentration as well as Diastolic blood pressure as dependent variable. Once, the equations are established then this equations will be used to fill the missing data.
B. Handling Outliers
After imputation with any of the above methods, winsorizing method with 2% winsorization window was used to remove the outliers from the dataset. Winsorizing is the transformation which limits the extreme range values in the data in order to reduce the effect of outliers. In statistics, the outliers are the data points whose spaces are significantly different from the rest of the data points. Different machine learning models: used for evaluation are linear and. Logistic Regression . Linear Discriminant Analysis ,. K-Nearest means KNN Classification and Regression Tree . Naïve Bayes (NB) Support Vector Machine Random Forest Adaboost Classifier and . Quadratic Discriminant Analysis .The performance was assessed by these.
IV. RESULT AND DISCUSSION
A. Dataset
In this research Pima Indian diabetes data has been used. It is publicly available and widely used dataset for diabetes research and can be downloaded from University of California repository or some other sources like Kaggle etc. The data comprises of attributes , 768 instances and one binary class attribute. The data is the collection of health related information of Pima Indian women is of twenty years mage and above.
The attributes/ features of the data are:
Number of times pregnancies , Plasma Glucose concentration, Diastolic Blood pressure Triceps skin fold thickness , Two hour serum insulin (milli meu U/ml),
Diabetes pedigree function, Age in Years. Class attributes for diabetes
0 for non diabetic 1 for diabetic
Table.1: Missing elements from raw dataset
S.N. Features Total Instance Missing values Missing values in %
1 Plasma glucose concentration 768 5 0.6
2 Diastolic blood pressure mm Hg 768 35 4.5
3 Triceps skin fold thickness (mm) 768 227 29.56
4 2-Hour serum insulin (mu U/ml) 768 371 48.31
It is observed that this dataset contains lots of missing data. Out of nine features, only 5 have missing elements as shown in Table 1. However, Two- hour serum insulin & triceps skin fold thickness have large number of missing elements.
B. Analysis of Missing data
C. Data distribution and correlation
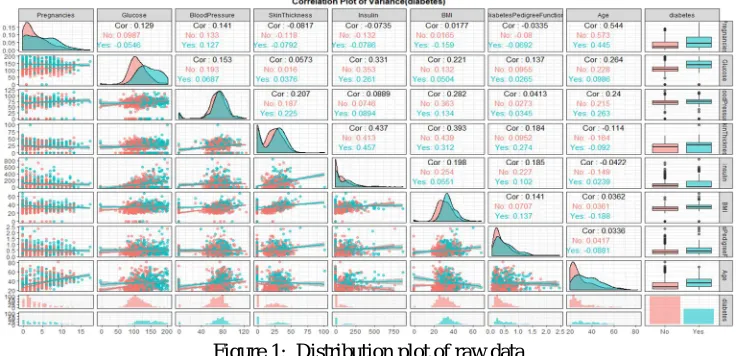
[image:4.612.122.490.234.412.2]The density plot gives a clear idea about the distribution of the data and correlation is used to find the correlation between two variables. Blue color shows the density plot of positive class while red color shows the density plot of negative class. More will be the difference in distributions between these two, better will be the classification. As shown in table 1 that Two hour serum insulin and t skin fold thickness have large number of missing elements, however it is maximally overlapped which makes classifier difficult to classify with the help of non-isolating samples. Therefore, the classifier poorly ranked these features. How ever these features are very important for the classification of diabetes. Distribution of the attributes and correlation among them are shown in Figure 1.
Figure 1: Distribution plot of raw data
V. RESULTS
[image:4.612.63.546.587.727.2]Proposed approach is tested on Pima Indian Data and the results are compared with the results on raw data. Missing data are first imputed using three different techniques simple mean, simple median, and linear regression. BMI is found highly correlated with Plasma glucose concentration P<0.001 Diastolic blood pressure P<0.001 Triceps skin fold thickness P<0.001 and two hour serum insulin P<0.001, therefore linear regression is performed individually between BMI and all these factors and the equations obtained are used to fill the missing data. K-fold cross validation is performed on imputed data and the classification accuracy are shown in Table below. Imputing through simple mean and simple median improves the classification accuracy as compared against raw data. However, imputing through linear regression degrades the classification accuracy. The accuracy is further improved by removing outliers. After applying outlier removal technique, classification accuracy has been improved from maximum 83.88 % to 84.31 % on mean imputed data, while the accuracy has been improved from 84.22 % to 84.75 % on median imputed data.
Table 2: Accuracy results of raw dataset using machine learning methods
Classifier Raw Data After outliers removal
LR 77.99 (5.01) 77.60 (5.15)
LDA 77.35 (5.16) 77.22(5.09)
KNN 74.21 (7.15) 75.12(6.27)
CART 72.78 (7.69) 72.52(7.19)
NB 75.52 (4.28) 75.52(4.84)
SVM 77.34 (4.56) 77.21(4.16)
RF 75.90 (5.98) 76.43(6.68)
Ada boost 75.39 (4.60) 75.65(4.78)
Table 3: Classification accuracy of imputed dataset using machine learning methods
After imputation, we further analyzed the distribution plot of imputed data. After imputation through mean and median, a clear non-overlapping pattern has been observed in Two hour serum insulin and triceps skin fold thickness as shown in Figure 2. This pattern greatly improved the classification accuracy of the classifiers. On the other hand, the patterns using linear regression approach are almost same as the patterns of raw data, thus no improvement have been observed.
Fig 2: Density and Correlation plot of Variance with values
VI. CONCLUSION
In this research, machine learning based diabetes classification model is developed. On raw data, classification accuracy is maximum(77.99%) with Logistic Regression while the average classification accuracy is just 75.57 %. This classification accuracy is due to a large percentage of missing data in PIMA Indian Dataset. The proposed approach consisted of (i) imputation of missing data (ii) outliers detection and (iii) classification using machine learning methods. For imputation three different approaches were used (i) mean (ii) median and (iii) linear regression. Winsorizing approach is used for outliers detection in combination with 9 different machine learning classifiers. Imputing through simple mean and simple median improves the classification accuracy as compared against raw data. However, imputing through linear regression degrades the classification accuracy. The accuracy was further improved by removing outliers. After applying outlier’s removal technique, classification accuracy has been improved from maximum 83.88 % to 84.31 % on mean imputed data, while the accuracy has been improved from 84.22 % to 84.75 % on median imputed data. Hence, mean and median based imputation technique with winsorizing technique can be used to improve the classification accuracy.
Classifier Simple Mean After outliers
removal
Simple Median
After outliers removal
Linear Regression with BMI
After outliers removal
LR 83.81 (4.22) 84.31 (4.24) 83.95 (4.25) 84.75 (4.32) 77.34 (4.76) 76.69 (5.06)
LDA 83.88 (4.42) 84.10 (4.29) 84.22 (4.30) 84.37 (4.36) 76.82 (5.02) 76.96 (4.93)
KNN 79.29 (4.36) 78.59 (4.56) 79.23 (4.29) 79.91 (4.95) 73.18 (4.15) 74.09 (4.69)
CART 77.61 (9.07) 78.52 (8.87) 77.75 (9.35) 78.26(9.01) 73.83 (7.21) 73.96 (7.05)
NB 82.19 (4.20) 82.97 (3.88) 81.75 (4.12) 82.87 (3.89) 75.52 (4.28) 75.52 (4.95)
SVM 83.72 (4.11) 83.76 (4.38) 83.78 (4.33) 83.97 (4.30) 76.95 (4.43) 76.95 (5.02)
RF 82.72 (5.49) 82.25 (5.44) 81.89 (6.75) 83.93 (5.14) 76.17 (5.60) 76.68 (6.11)
Ada boost 82.17 (4.26) 81.99 (3.65) 81.09 (4.21) 81.77 (3.72) 74.74 (6.18) 75.00 (5.14)
[image:5.612.72.542.338.558.2]REFERENCES
[1] Han wu. , Shengqi Y. ,Zhangqin H., Jian H., Xiaoyi W., “Type 2 diabetes mellitus prediction model based on data mining,“ Informatics in Medicine unlocked, Vol. 10, p 100-107, 2018. http:Doi.org/1o.1o16/j.imu.2017.12.006
[2] C. D. Mathers and D. Loncar, “Projections of Global Mortality and Burden of Disease from 2002 to 2030,” PLOS Med, vol. 3, no. 11, pp. 442-462, 2006. [3] Nahla H. Barakat, Andrew P.Bradley and Mohamed Nabil H. Barakat, “Intelligible support vector machines for diagnosis of diabetes mellitus, “IEEE
Transactions On Information Technology In Biomedicine, vol.14, No 4, July 2010 [4] Marx v. “Biology: The big challenges of big data, ”Nature Jun 2013;498
(7453):255-60.http://dx.doi.org/10.1038/498255a
[5] Longfei Han, SenlinLuo,JianminYu,Limin pan ,Songjing Chen, “Rule extraction from support vector machines using ensemble learning approach:An application for diagnosis of diabetes,”Doi10.1109/JBHI.2014.2325615, IEEE Journal of Biomedical and Health Informatics
[6] Bum Ju Lee and Jong yeol.,“ Identification of type 2 diabetes risk factors Using phenotypes consisting of anthropometry and triglycerides based on Machine learning ,” IEEE journal Of Biomedical and Health Informatics, vol.20, no1 Jan. 2016.
[7] World Health Organization, “Global report on diabetes,” World Health Organization 2016, pp. 1-88, 2016.
[8] Rabindra Nath Das, “Determinants of diabetes mellitus in the Pima Indian mothers and Indian medical students” , The Open Diabetic Journal, vol .7, p 5-13,2014
[9] Hang Kang ,“ The prevention and handling of missing data ”.Korean .j. Anaesthesiol, Vol. 64, No 5 , P402-406, May 2013.
[10] Mahmoud Heydari, Mehdi , Zainabolhoda Heshmati , “Comparison of various classification algorithms in the diagnosis of type -2 diabetes in Iran”, Int. J Diabetes Dev Ctries, published online 18 April 2015.
[11] Wenqian Chen et al. “A Hybrid Prediction Model for Type 2 Diabetes using K-means and Decision Tree”, http//ieeexplore.ieee.org/document/8342938.(2017). [12] Shankaracharya, Devang O., Subir Sam., and Ambarish S.V. ,“Computational Intelligence-based Diagnosis Tool for the Detection of Prediabetes and type 2
diabetes in India”. The review Of Diabetic Studies Vol.9, No.1, pp 55-63, 2012.
[13] Chandeep k., and Olufemi M. O., “Data Mining methods to improve clinical trials in Diabetic patients”, Annuals of Clinical and Laboratory Research, Vol.16, No. 4, p 266, 2018.
[14] Gulshan et al. “Development and Validation of a deep learning algorithm for detection of diabetic retinopathy in retinal fundus photographs ,”JAMA.vol .316, No22 ,p 2402-2410, 2016.
[15] Timothy S, Barley John Walsh and Jenine Y. Stone, “Emerging Technologies for Diabetic care,” Diabetic Technology and Therapeutic Care ,Vol.20,No.52,2018
[16] ValeriyaL s., and Markku laaskso,’ “Genetic screening for risk of Diabetes.Woerthless or Valuable?” Diabetic Care,Vol. 36,No. 2, p 120-126,2013 [17] D.Kerr, C Axelrod, C. Hoppe and D. C.Kionoff, “Diabetes Technology in 2030-Utopian or Dystopian future?” Diabetic medicine Vol 35, No.4,2018.
[18] Seong Beomcho.Sang Cheolkim& Myung Guenchung “ Identification Of Novel population Clusters With different susceptibilities to type-2 diabetes and their impact on the Prediction of Diabetes”. www.nature.com/scienctific reports (2019) 9:3329/https//10.1038/s41598-019-40058--y
[19] Leslie O.,Schutz et al. “Effects OF Traditional and Western environments 0n prevalence of Type-2Diabetes mellitus in Pima Indians in Mexico and the US”. Diabetic Care Vol. 29, No.8, p 1866-1871, 2006
[20] Verma R. , Khanna P., Mehta B., “National programme on prevention and control of diabetes in India: Need to focus” Australas Med. J, Vol.5, No.6, p 310, 2012.