Received 31 May 2019 Accepted 7 June 2019
Edited by M. Weil, Vienna University of Technology, Austria
Keywords:crystal structure; calcium; hydrogen phosphite.
CCDC reference:1921630
Supporting information:this article has supporting information at journals.iucr.org/e
Synthesis and crystal structure of calcium hydrogen
phosphite, CaHPO
3Mark L. F. Phillipsaand William T. A. Harrisonb*
aPleasanton Ridge Research LLC, Sandia Airpark, Edgewood, New Mexico 87015, USA, andbDepartment of Chemistry,
University of Aberdeen, Meston Walk, Aberdeen AB24 3UE, Scotland. *Correspondence e-mail: w.harrison@abdn.ac.uk
The hydrothermal synthesis and crystal structure of the simple inorganic compound CaHPO3, which crystallizes in the chiral space group P43212, are reported. The structure is built up from distorted CaO7capped trigonal prisms and HPO3pseudo pyramids, which share corners and edges to generate a three-dimensional network.
1. Chemical context
Calcium–phosphorus–oxygen phases are ubiquitous in inor-ganic and materials chemistry. They have long been known as key components of fertilizers produced on a multi-million tonne scale (Rajanet al., 1996) and more recently their clinical applications as cements and biomaterials have been intens-ively studied. A recent review (Eliaz & Metoki, 2017) refers to over 860 articles. Some of their other applications include use as additives in cheese making (Lucey & Fox, 1993), as envir-onmental remediation agents (Nzihou & Sharrock, 2010) and as corrosion inhibitors (del Amo et al., 1999). Apatite, Ca5(PO4)3X(X= OH, F, Cl, ), is the most abundant calcium phosphate mineral and is of great importance in mineralogy and geochemistry (Hughes & Rakovan, 2002).
As part of our ongoing exploratory synthetic studies, we now describe the hydrothermal syntheses and crystal structure of CaHPO3, (I).
2. Structural commentary
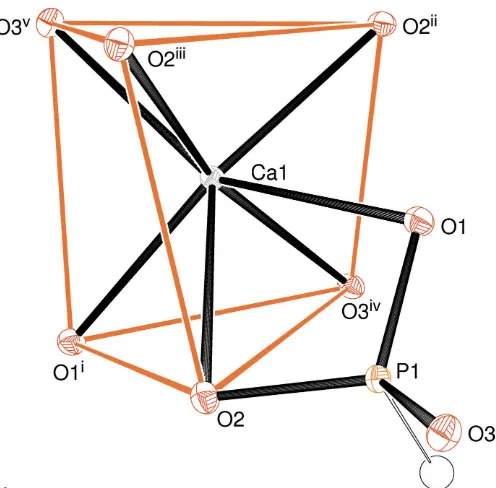
The asymmetric unit of (I) has the simple composition of one Ca2+ cation and one hydrogen phosphite anion (Fig. 1) with the symmetry elements of the chiral tetragonal space group P43212 building up the complete crystal structure. This results in the calcium ion being coordinated by seven O atoms belonging to six different HPO32 groups (the one in the arbitrarily chosen asymmetric unit is chelatingviathe O1,O2 edge). The Ca1—O2 distance of 2.6938 (14) A˚ (Table 1) is
ISSN 2056-9890
Table 1
Selected bond lengths (A˚ ).
Ca1—O1i 2.2870 (13) Ca1—O2 2.6938 (14)
Ca1—O2ii 2.3600 (14) P1—O1 1.5173 (13) Ca1—O2iii 2.3907 (13) P1—O3 1.5192 (13)
Ca1—O3iv 2.4014 (12) P1—O2 1.5423 (13) Ca1—O3v 2.4192 (13) P1—H1 1.30 (2)
Ca1—O1 2.4869 (14)
Symmetry codes: (i)x1 2;yþ
1 2;zþ
1 4; (ii)xþ
1 2;yþ
1 2;zþ
1
4; (iii)y;x;z; (iv)
y1 2;xþ
1 2;zþ
1
notably longer than the others (mean for the six shorter distances = 2.391 A˚ ) but it clearly qualifies as a bond based on the Brown criterion (Brown, 2002) of contributing at least 0.04 v.u. (valence units) to the bond-valence sum (BVS; Brown & Altermatt, 1985) for the metal ion: the Ca1 BVS is 2.07 v.u. (expected value = 2.00 v.u.), with the long O2 bond contrib-uting 0.14 v.u. The next-nearest oxygen atom is some 3.68 A˚ distant from the calcium atom.
The calcium coordination environment in (I) can be described as a distorted mono-capped trigonal prism with O1i/O2/O3ivand O2ii/O2iii/O3vforming the ends of the prism and the Ca1—O1 bond protruding through the twisted rectangular face formed by atoms O2/O2iii/O2ii/O3iv (see Table 1 for symmetry codes). The dihedral angle between the end-faces noted in the previous sentence is 6.90 (9), and the
calcium ion is displaced from them by 1.5607 (8) and 1.4454 (9) A˚ , respectively. The dihedral angles subtended by O1i/O2/O3iv and O1/O2/O3iv (the latter being the triangle formed by the protruding atom O2 and the common edge with the prism-end) is 36.14 (7); the equivalent value for O2ii
/O2iii/ O3vand O1/O2ii/O2iiiis 41.37 (4). These data, especially the second value, are in very good agreement with the ideal value of 41.5for a capped trigonal prism withC2
vsymmetry built up from hard spheres (Lewis & Lippard, 1975). Finally, it may be noted that the calcium ion is displaced from the centroid of its seven associated O atoms by 0.34 A˚ approximately away from the O1/O2 edge of the chelating phosphite group.
The HPO3
2–
hydrogen phosphite group in (I) displays its normal (Loub, 1991) tetrahedral (including the H atom) shape with a mean P—O separation of 1.526 A˚ . The bond to O2 is clearly longer than the others (Table 1), which might correlate with the fact that O2 bonds to three calcium cations, whereas
O1 and O3 bond to two. The O—P—O angles are notably distorted with O1—P1—O2 (the chelating atoms to the adja-cent calcium ion) some 8smaller than the other two angles.
The P atom is displaced by 0.4200 (9) A˚ from the plane of its attached O atoms, which is typical (Holmeset al., 2018). As usual, the hydrogen atom of the phosphite group shows no propensity to form hydrogen bonds and in (I) atom H1 ‘points into space’ with its nearest neighbour being another H1 atom at 2.08 (4) A˚ . The mean P—O bond length in the ‘type e’ (isolated) HPO32–groups surveyed by Loub (1991) of 1.517 A˚ is slightly shorter than the value for (I) but the mean P—H separation of 1.30 A˚ established by Loub is identical to the refined value for (I).
Each of the three unique O atoms in (I) has a different coordination environment: O1 bonds to two Ca cations and one P atom in an approximate T-shape with Ca—O—Ca =
108.30 (5) and Ca—O—P = 99.88 (7) and 150.21 (8). The
environment of O2 can be described as a distorted OPCa3 tetrahedron [range of angles = 91.01 (6)–131.49 (8); mean = 107.0] whereas O3 bonds to two Ca and one P atom in an
approximate trigonal arrangement [Ca—O—Ca = 103.77 (5) and Ca—O—P = 127.66 (7) and 128.07 (7); bond-angle sum =
359.5].
The extended structure of (I) in polyhedral representation is shown in Fig. 2. The linkage of the CaO7and HPO3 poly-hedra generates a dense three-dimensional network in which each calcium cation is surrounded by five others linkedvia edges with Ca Ca separations clustered in the narrow range of 3.6938 (5)–3.8712 (5) A˚ . There appear to be small voids in the structure but these correspond to the P—H vertices and a PLATON(Spek, 2009) analysis did not reveal any free space in the structure.
998
Phillips and Harrison CaHPO3 Acta Cryst.(2019). E75, 997–1000
[image:2.610.315.565.73.322.2]research communications
Figure 2
[image:2.610.48.296.470.714.2]Polyhedral view of the packing in (I) viewed down [110].
Figure 1
3. Database survey
A survey of the Inorganic Crystal Structure Database (ICSD; Belsky et al., 2002), updated to March 2019, for compounds containing Ca, P, O and H and no other elements revealed 142
matches. The vast majority of these are phosphates
(containing tetrahedral PVO4groups) and many of them are apatite derivatives. When the presence of any other element alongside Ca/P/O/H was allowed in the search, no fewer than 554 hits arose.
The closest analogues to (I) are the PIII-containing phases
calcium bis(dihydrogen phosphite) monohydrate,
Ca(H2PO3)2H2O [reported first by Larbotet al.(1984) (ICSD reference 36285) and then by Mahmoudkhani & Langer
(2001a; ICSD 280575) and calcium hydrogen phosphite
monohydrate, CaHPO3H2O (Mahmoudkhani & Langer,
2001b; ICSD 411737). The water molecule coordinates to the
calcium cation in both compounds and O—H O hydrogen
bonds (from the OH moiety of the H2PO3group and the water molecule in 280575 and from the water molecule in 411737) are prominent features of the crystal structures. It is notable that both phases feature a CaO7coordination polyhedron with one chelating phosphite group: in 411737 its distorted capped trigonal–prismatic shape is similar to that seen in (I) whereas in 280575 it is closer to a pentagonal bipyramid. The overall topology of the Ca/P/O bonding network in 411737 is layered but in 280575 it is three-dimensional.
4. Synthesis and crystallization
A mixture of 2.36 g (10.0 mmol) Ca(NO3)24H2O, 0.52 g (6.0 mmol) H3PO3 and 0.47 g (4.0 mmol) NH4ClO4 were dissolved in 10 ml H2O then mixed with 4.0 g 15 N NH4OH and loaded into a 23 ml Teflon cup. This was heated in a stainless steel pressure vessel for seven days at 473 K and cooled to room temperature over a few hours. Product recovery by vacuum filtration and rinsing with deionized water yielded 0.67 g (5.6 mmol; 93% yield based on Ca) of sparkling colourless prisms of (I).
A calculated X-ray powder pattern for (I) based on the single-crystal structure model was found to be in excellent agreement with its measured powder pattern (see supporting information): no ‘hits’ were found in a search against the JCPDS database of powder patterns. ATR–FTIR (diamond window, cm1) for (I): 2467w, 2436m(P—H stretch); 1151s, 1056vs, 979vs, 588vs, 511s, 448s(phosphite P—O stretches and bends) [for the spectrum, see supporting information; for peak assignments, see Fridrichova´et al.(2012)].
5. Refinement
Crystal data, data collection and structure refinement details are summarized in Table 2. Atom H1 was located in a differ-ence map and its position andUisovalue were freely refined. The absolute structure of the crystal chosen for data collection is well-defined in space groupP43212 (No. 96) although the bulk sample presumably also consists of equal amounts of the other enantiomer (space groupP41212, No. 92).
Acknowledgements
We thank Kirstie McCombie for collecting the powder pattern, Sarah Ferrandin for collecting the IR spectrum and the EPSRC National Crystallography Service (University of Southampton) for the X-ray data collection. This work was performed, in part, at the Center for Integrated Nano-technologies, an Office of Science User Facility operated for the US Department of Energy (DOE) Office of Science by Los Alamos National Laboratory (Contract DE-AC52–06 N A25396) and Sandia National Laboratories (Contract DE-NA-0003525).
References
Amo, B. del, Romagnoli, R. & Vetere, V. F. (1999).Ind. Eng. Chem. Res.38, 2310–2314.
Belsky, A., Hellenbrandt, M., Karen, V. L. & Luksch, P. (2002).Acta Cryst.B58, 364–369.
Brown, I. D. (2002).The Chemical Bond in Inorganic Chemistry: The Bond Valence Model. Oxford University Press.
Brown, I. D. & Altermatt, D. (1985).Acta Cryst.B41, 244–247. Eliaz, N. & Metoki, N. (2017).Materials,10, article 334 (104 pages). Farrugia, L. J. (2012).J. Appl. Cryst.45, 849–854.
Fridrichova´, M., Neˇmec, I., Matulkova´, I., Gyepes, R., Borodavka, F., Kroupa, J., Hlinka, J. & Gregora, I. (2012).Vib. Spectrosc.63, 485– 491.
Holmes, W., Cordes, D. B., Slawin, A. M. Z. & Harrison, W. T. A. (2018).Acta Cryst.E74, 1411–1416.
[image:3.610.42.295.88.384.2]Hughes, J. M. & Rakovan, J. (2002).Rev. Mineral. Geochem.48, 1–12.
Table 2
Experimental details.
Crystal data
Chemical formula CaHPO3
Mr 120.06
Crystal system, space group Tetragonal,P43212
Temperature (K) 100
a,c(A˚ ) 6.67496 (6), 12.9542 (2)
V(A˚3) 577.18 (1)
Z 8
Radiation type MoK
(mm1) 2.49
Crystal size (mm) 0.200.110.10
Data collection
Diffractometer Rigaku AFC12 CCD
Absorption correction Multi-scan (CrysAlis PRO; Rigaku, 2017)
Tmin,Tmax 0.811, 1.000
No. of measured, independent and observed [I> 2(I)] reflections
7615, 668, 667
Rint 0.030
(sin/)max(A˚
1
) 0.649
Refinement
R[F2> 2(F2)],wR(F2),S 0.014, 0.037, 1.27
No. of reflections 668 No. of parameters 51
H-atom treatment All H-atom parameters refined
max,min(e A˚
3
) 0.28,0.38
Absolute structure Flackxdetermined using 230 quotients [(I+)(I)]/[(I+)+(I)] (Parsonset al., 2013)
Absolute structure parameter 0.006 (16)
Computer programs: CrysAlis PRO (Rigaku, 2017),SHELXS97 (Sheldrick, 2008),
SHELXL2014(Sheldrick, 2015),ORTEP-3 for Windows(Farrugia, 2012) andpublCIF
Larbot, A., Durand, J. & Cot, L. (1984).Z. Anorg. Allg. Chem.508, 154–158.
Lewis, D. L. & Lippard, S. J. (1975).J. Am. Chem. Soc.97, 2697–2702. Loub, J. (1991).Acta Cryst.B47, 468–473.
Lucey, J. A. & Fox, P. A. (1993).J. Dairy Sci.76, 1714–1724. Mahmoudkhani, A. H. & Langer, V. (2001a).Acta Cryst.E57, i19–i21. Mahmoudkhani, A. H. & Langer, V. (2001b). Phosphorus Sulfur
Silicon,176, 83–94.
Nzihou, A. & Sharrock, P. (2010).Waste Biomass Valori.1, 163–174.
Parsons, S., Flack, H. D. & Wagner, T. (2013).Acta Cryst.B69, 249– 259.
Rajan, S. S. S., Watkinson, J. H. & Sinclair, A. G. (1996).Adv. Agron.
57, 77–159.
Rigaku (2017).CrysAlis PRO. Rigaku Corporation, Tokyo, Japan. Sheldrick, G. M. (2008).Acta Cryst.A64, 112–122.
Sheldrick, G. M. (2015).Acta Cryst.C71, 3–8. Spek, A. L. (2009).Acta Cryst.D65, 148–155. Westrip, S. P. (2010).J. Appl. Cryst.43, 920–925.
1000
Phillips and Harrison CaHPO3 Acta Cryst.(2019). E75, 997–1000
sup-1
Acta Cryst. (2019). E75, 997-1000
supporting information
Acta Cryst. (2019). E75, 997-1000 [https://doi.org/10.1107/S2056989019008235]
Synthesis and crystal structure of calcium hydrogen phosphite, CaHPO
3Mark L. F. Phillips and William T. A. Harrison
Computing details
Data collection: CrysAlis PRO (Rigaku, 2017); cell refinement: CrysAlis PRO (Rigaku, 2017); data reduction: CrysAlis
PRO (Rigaku, 2017); program(s) used to solve structure: SHELXS97 (Sheldrick, 2008); program(s) used to refine
structure: SHELXL2014 (Sheldrick, 2015); molecular graphics: ORTEP-3 for Windows (Farrugia, 2012); software used to
prepare material for publication: publCIF (Westrip, 2010).
Calcium hydrogen phosphite
Crystal data
CaHPO3
Mr = 120.06
Tetragonal, P43212
a = 6.67496 (6) Å
c = 12.9542 (2) Å
V = 577.18 (1) Å3
Z = 8
F(000) = 480
Dx = 2.763 Mg m−3
Mo Kα radiation, λ = 0.71073 Å
Cell parameters from 6820 reflections
θ = 3.0–27.5°
µ = 2.49 mm−1
T = 100 K
Prism, colourless 0.20 × 0.11 × 0.10 mm
Data collection Rigaku AFC12 CCD
diffractometer
Confocal mirrors, HF Varimax monochromator
Detector resolution: 28.5714 pixels mm-1
ω scans
Absorption correction: multi-scan (CrysAlis PRO; Rigaku, 2017)
Tmin = 0.811, Tmax = 1.000
7615 measured reflections 668 independent reflections 667 reflections with I > 2σ(I)
Rint = 0.030
θmax = 27.5°, θmin = 3.4°
h = −8→8
k = −8→8
l = −16→16
Refinement
Refinement on F2
Least-squares matrix: full R[F2 > 2σ(F2)] = 0.014
wR(F2) = 0.037
S = 1.26
668 reflections 51 parameters 0 restraints
Primary atom site location: structure-invariant direct methods
Hydrogen site location: difference Fourier map All H-atom parameters refined
w = 1/[σ2(F
o2) + (0.0206P)2 + 0.1946P]
where P = (Fo2 + 2Fc2)/3 (Δ/σ)max < 0.001
Δρmax = 0.28 e Å−3
Δρmin = −0.38 e Å−3
Extinction correction: SHELXL2014 (Sheldrick, 2015),
Fc*=kFc[1+0.001xFc2λ3/sin(2θ)]-1/4
Extinction coefficient: 0.056 (4)
Absolute structure: Flack x determined using
230 quotients [(I+)-(I-)]/[(I+)+(I-)] (Parsons et al., 2013)
supporting information
sup-2
Acta Cryst. (2019). E75, 997-1000 Special details
Geometry. All esds (except the esd in the dihedral angle between two l.s. planes) are estimated using the full covariance matrix. The cell esds are taken into account individually in the estimation of esds in distances, angles and torsion angles; correlations between esds in cell parameters are only used when they are defined by crystal symmetry. An approximate (isotropic) treatment of cell esds is used for estimating esds involving l.s. planes.
Fractional atomic coordinates and isotropic or equivalent isotropic displacement parameters (Å2)
x y z Uiso*/Ueq
Ca1 0.31831 (5) 0.10351 (5) 0.11917 (3) 0.00616 (14)
P1 0.29735 (7) 0.57084 (7) 0.10542 (3) 0.00575 (15)
H1 0.220 (4) 0.625 (4) 0.1928 (19) 0.013 (6)*
O1 0.4785 (2) 0.43959 (19) 0.12612 (11) 0.0080 (3)
O2 0.1356 (2) 0.4401 (2) 0.05361 (10) 0.0078 (3)
O3 0.3393 (2) 0.76729 (19) 0.05029 (9) 0.0081 (3)
Atomic displacement parameters (Å2)
U11 U22 U33 U12 U13 U23
Ca1 0.0058 (2) 0.00652 (19) 0.0061 (2) −0.00010 (12) 0.00026 (13) 0.00022 (12)
P1 0.0057 (2) 0.0056 (2) 0.0059 (2) −0.00049 (15) −0.00009 (17) 0.00001 (15)
O1 0.0070 (6) 0.0078 (5) 0.0092 (5) 0.0004 (5) −0.0005 (5) 0.0000 (5)
O2 0.0070 (6) 0.0086 (6) 0.0079 (5) −0.0012 (5) −0.0002 (5) −0.0001 (5)
O3 0.0100 (6) 0.0067 (6) 0.0076 (6) −0.0003 (5) −0.0002 (5) 0.0005 (5)
Geometric parameters (Å, º)
Ca1—O1i 2.2870 (13) P1—O3 1.5192 (13)
Ca1—O2ii 2.3600 (14) P1—O2 1.5423 (13)
Ca1—O2iii 2.3907 (13) P1—H1 1.30 (2)
Ca1—O3iv 2.4014 (12) O1—Ca1ii 2.2869 (13)
Ca1—O3v 2.4192 (13) O2—Ca1i 2.3600 (14)
Ca1—O1 2.4869 (14) O2—Ca1iii 2.3907 (13)
Ca1—O2 2.6938 (14) O3—Ca1vi 2.4014 (12)
P1—O1 1.5173 (13) O3—Ca1vii 2.4192 (13)
O1i—Ca1—O2ii 149.66 (5) O1—Ca1—O2 56.90 (4)
O1i—Ca1—O2iii 111.93 (5) O1—P1—O3 115.75 (8)
O2ii—Ca1—O2iii 95.90 (4) O1—P1—O2 107.96 (8)
O1i—Ca1—O3iv 81.56 (5) O3—P1—O2 114.40 (8)
O2ii—Ca1—O3iv 74.49 (4) O1—P1—H1 109.0 (12)
O2iii—Ca1—O3iv 161.56 (5) O3—P1—H1 104.1 (11)
O1i—Ca1—O3v 87.17 (5) O2—P1—H1 104.9 (11)
O2ii—Ca1—O3v 89.43 (5) P1—O1—Ca1ii 150.21 (8)
O2iii—Ca1—O3v 73.62 (4) P1—O1—Ca1 99.88 (7)
O3iv—Ca1—O3v 121.07 (5) Ca1ii—O1—Ca1 108.30 (5)
O1i—Ca1—O1 122.62 (4) P1—O2—Ca1i 120.90 (7)
sup-3
Acta Cryst. (2019). E75, 997-1000
O2iii—Ca1—O1 78.87 (4) Ca1i—O2—Ca1iii 105.94 (5)
O3iv—Ca1—O1 83.24 (5) P1—O2—Ca1 91.01 (6)
O3v—Ca1—O1 145.62 (5) Ca1i—O2—Ca1 99.78 (5)
O1i—Ca1—O2 70.38 (4) Ca1iii—O2—Ca1 92.99 (5)
O2ii—Ca1—O2 130.00 (4) P1—O3—Ca1vi 127.66 (7)
O2iii—Ca1—O2 77.54 (5) P1—O3—Ca1vii 128.07 (7)
O3iv—Ca1—O2 96.39 (4) Ca1vi—O3—Ca1vii 103.77 (5)
O3v—Ca1—O2 133.13 (5)
O3—P1—O1—Ca1ii 11.3 (2) O3—P1—O2—Ca1iii 53.71 (12)
O2—P1—O1—Ca1ii 140.99 (16) O1—P1—O2—Ca1 18.17 (8)
O3—P1—O1—Ca1 −149.73 (6) O3—P1—O2—Ca1 148.60 (6)
O2—P1—O1—Ca1 −20.05 (8) O1—P1—O3—Ca1vi 78.88 (11)
O1—P1—O2—Ca1i 120.21 (8) O2—P1—O3—Ca1vi −47.62 (13)
O3—P1—O2—Ca1i −109.36 (9) O1—P1—O3—Ca1vii −110.53 (10)
O1—P1—O2—Ca1iii −76.72 (11) O2—P1—O3—Ca1vii 122.98 (9)