The ongoing process of the concentration of milk production in the EU is giving rise to the number of milk producers on the European milk market which produce and supply significant volumes of milk. Apart from this, the gradual increase of the EU milk quotas in accordance to the cAP health check proposal and the eventual introduction of the EU milk market without production limits represent another chance for the most successful milk producers to raise their
production. “in the absence of quotas, the EU milk production collected increases by 5.0% which causes a 10.3% decrease in farm milk price” (réquillart et al. 2008). Subsequent to the milk production liberaliza-tion, the process of concentration of milk production is supposed to speed up. The volume of milk delivered by the agricultural producer for processing is one of the factors which determine the location and relation-ship of milk producer and milk processor.
Effects of the length of the milk collection route
on the choice of the locality of milk processing
Vliv délky trasy sběru mléka na rozhodovací proces o lokalitě
zpracování mléka
I. Bošková
Institute of Agricultural Economics and Information, Prague, Czech Republic
Abstract: The goal of the research was to identify how important was the distance between the milk producer and the milk processor in their decision of which dairy plant would do the processing. The study should indicate if the advantage of a lower price offered by the distant milk producer would be eliminated or preserved by the transport costs. in the study, the cost of various lengths of milk collection routes in central Europe has been examined. The difference in cost, whether a short or long journey was travelled, was compared to the range of raw milk prices within the chosen territories in central Europe. The results proved that the milk collection costs in Europe enable rather long journeys, from the producer to the processor, to be made. in three of the four examined regions, the usual collection route of 200 km followed by an additional journey of 400 km enabled the preservation of the milk price advantage gained due to this journey. The feasibility of long collection journeys would reduce the impact of the success of local processors on the economics of the surrounding milk producers and vice-versa and could play an important role in the movement of raw milk in Europe in the ongoing concent-ration and liberalization process of milk production in the EU.
Key words: milk collection, costs, milk price
Abstrakt: Studie přináší informaci, jaký význam v rozhodování o výběru zpracovatele má vzdálenost mezi producentem a zpracovatelem mléka. Výsledky měly prokázat, zda cenová výhoda, kterou získá zpracovatel u vzdáleného producenta mléka v podobě nižší ceny, může být přepravou mléka na tuto vzdálenost zachována či eliminována. Ve studii byly kalku-lovány náklady na sběr mléka pro různé vzdálenosti ve střední Evropě. rozdíl nákladů v případě krátké a dlouhé přepravy byl přirovnán k rozsahu ceny zemědělských výrobců mléka ve vybraných regionech střední Evropy. Výsledky potvrdily, že náklady na sběr mléka umožňují poměrně dlouhou přepravu od producenta mléka k jeho zpracovateli. Ve třech ze čtyř šetřených regionů byla zachována cenová výhoda v případě, že po standardní trase v délce 200 km následovala dodatečná přeprava v délce 400 km. Dostupnost přepravy mléka na dlouhou vzdálenost by mohla redukovat vliv ekonomiky lokální-ho zpracovatele na okolní producenty mléka a naopak a mohla by zaujímat významnou úlohu v pohybu syrovélokální-ho mléka v Evropě v postupujícím procesu koncentrace a liberalizace výroby mléka v EU.
There is a presumption that a change of the milk volume supplied by the producer affects the dis-tance between the milk producer and milk proces-sor as a significant volume of milk may represent the opportunity to address a distant processor. As a consequence of both the concentration and the liberalization processes, more movement of raw milk within Europe may appear.
GOAL
This research attempts to identify how important was the distance between the milk producer and the milk processor in their decision about which dairy plant would be the business partner for the farmer. in the study, the cost of various lengths of milk col-lection journeys in Europe have been examined and calculated. The difference in cost, between a short and a long journey travelled, was compared to the range of raw milk prices within the chosen area of central Europe. The results should demonstrate the reasonable journeys for raw milk in central Europe related to the milk price advantage reached within these routes. The study should therefore indicate the length of journey which the dairies in Europe may be willing to overcome in order to collect raw milk in the ongoing process of the concentration of milk production and the milk quota withdrawal.
METHODOLOGY
The interlink figures exhibits costs for 1 km trav-elled, and the final figures show the costs difference for the various distances travelled.
(1) Basic costs items were identified.
For the purpose of this analysis, the following costs items were assigned to be relevant.
1. Purchase costs of the vehicle and technical as-sets.
2. Depreciation costs of the vehicle and technical assets.
3. operational costs of the vehicle and technical assets.
4. Petrol costs. 5. Driver costs.
(2) The principle characteristics and parameters of the particular costs items were empirically examined.
An examination of the characteristics and values of the particular costs items for the purpose of this analysis was made. The examination was based on
the data and consultations provided by producers of techniques, by their dealers, by transport companies, dairy economists and other persons involved. The values are the averages of all information collected and they relate to 2007.
it is difficult to evaluate collection costs gener-ally as “... where small producers dominate produc-tion, those costs are considerable” (Kaspersson et al. 2002). Therefore, the results should not exhibit the collection costs generally but they should show the additional collection costs, when after the usual collection journey, an additional journey with raw milk is involved.
Based on empirical examination the characteristics of particular costs items were assigned as follows. ad (1) 1. Purchase costs of the vehicle and technical
assets.
in the evaluation of this item, several types and variations of transport vehicles were considered. For a usual milk collection, which could be combined with the transport of the collected milk to a distant processor, a tank on the truck supplemented with a trailer was identified as the most usual transport vehicle. The total capacity of this unit was presumed to be 29 000 kg of milk. The average price of the front part of this unit, consisting of the truck with the tank equipped with the milk sampler, was estimated to be 145 000 EUr. The average price of the trailer was estimated to be 40 000 EUr.
ad (1) 2. Depreciation costs of the vehicle and tech-nical assets.
The depreciation period for the truck and for the trailer was defined separately. The truck with a.m. equipment was defined to be depreciated within 5 years, while the lifetime of the trailer was designated for 10 years.
ad (1) 3. operational costs of the vehicle and techni-cal assets.
All necessary and usual costs for operation and the maintenance of the technical assets were included in this item. it covers the usual service costs for the vehicle including the change of tyres and apart from this the road taxes, insurance and other operational costs and fees are included. The average value of operational costs of technical assets was estimated to be 17 000 EUr/year.
ad (1) 4. Petrol costs.
and lower values represent the extremes, while the usual price should lay in the middle of the range. The average fuel consumption was estimated to be 35 litres/100 km.
ad (1) 5. Driver costs.
The initial characteristics for the formulation of driver costs were the daily utilization of the truck, the daily utilization of the labour and the price of labour. in this study, the following values of a.m. characteristics were assessed.
The average daily utilization of the truck was con-sidered to be 500 km for the standard collection journeys, (which means that the truck gets to one or more standard collection routes a day up to 500 km together). Besides this, a truck utilization of 600 km a day was considered. in this case, a standard collection route was considered, which was followed by a long journey with the eventual filling-up. As the journey with the finished collection is less time consuming than the milk collection itself, both 500 and 600 km daily utilizations were considered comparable from the aspect of time.
The daily utilization of the truck would, in average, be operated by two drivers. As there is a rather big difference in the driver salaries in central Europe, two levels of driver salaries have been analysed. The salary at level 1 was defined as 1 600 EUr/month (represent-ing the new EU member countries) and the salary at level 2 as 3 200 EUr/month (representing the older EU member countries). Both salary levels include tax.
An important note to be made is that the particular cost values may vary in the particular European coun-tries. generally, the differences in the items involving technical assets should not be large within Europe. Moreover, their share in the total cost is rather small, so that these differences may not be of a cardinal importance in the final calculation. The driver costs may vary more significantly. if this method is applied in the particular countries, the item of driver costs should be attentively followed.
(3) All figures related to time were converted to the rate per one kilometre.
Purchase costs, depreciation costs and operational costs of the vehicle and technical assets were converted into per 1 per kilometre value by using their lifetimes in days and their daily utilization. The drivers sala-ries were divided by the total number of kilometres travelled per month. As there weretwo alternatives of the daily use (up to 500 km or 600 km), two separate calculations for these daily routes were made. in the same way, the 1 kilometre rate for labour costs for both daily journeys, up to 500 km and 600 km, meant that two different rates were calculated.
(4) The Cost of one kilometre travelled was calcu-lated.
This characteristic is defined as the sum of all item costs stated in the step (1) expressed as a per 1 kilo-metre value (Tables 1 and 2).
(5) The costs of particular lengths of the collection routes were calculated.
in the first phase, the values for 1 kilometre travelled were multiplied by the scale of distances travelled for the collection of the milk. Journeys of 200 km, 500 km and 600 km was considered. The figures show the total costs of particular routes travelled by the truck and trailer (Table 3).
in the second phase, the costs of travelling the journeys were converted to the cost of 100 kg milk being transported on the route. The converting factor was the capacity of the truck and trailer 29 000 kg. These figures show the total costs for transporting 100 kg milk over the particular jour-neys (Table 4).
in the third phase, the costs for transporting 100 kg milk over 200 km and over 600 km were compared. These figures should show the costs of the additional journey of 400 km for 100 kg milk (Table 5).
(6) The range of milk price in the chosen European regions was examined.
The range of milk price was defined as the differ-ence between the maximum and the minimum milk price. These figures represent the maximum potential price advantage within the region.
Milk prices in 2006 and 2007 were examined in four European regions. Two of them are the federal states of germany, historically parts of the Western germany, namely Schleswig-holstein in the north and Bavaria in the South of germany. The third re-gion is the german Federal State of Saxony and the fourth the czech republic, both previously part of Eastern Europe.
czech republic, it is for the average of all volumes. The file contains all dairies followed by the mentioned statistics, which should represent all dairies in these regions (Table 11 and 12). in the Schleswig-holstein, a total of 15 dairies were examined, in Bavaria 69 dair-ies, in Saxony 6 dairies and in the czech republic prices from 55 dairies were collected.
(7) The difference of costs, when short and long journey were travelled (200 and 600 km,) were compared for the range of farm milk prices in Central and Western Europe.
These results should show if the advantage of the lower price offered by the distant milk producer would be dissolved or preserved by the transport costs.
RESULTS AND DISCUSSION
in the costs for 1 kilometre travelled, the most significant item was the petrol consumption. in the calculation with driver costs at the level 1, daily utiliza-tion of the truck of 500 km and the median presumed petrol price 1.45 EUr/l the petrol cost represented 52% of the total costs for 1 km travelled. When the
truck was used for 600 km a day, then the petrol consumption represented 55% of the total costs per 1 km travelled.
in the calculation with driver costs at the level 2, the share of petrol consumption in total costs was also the most significant item, however, its share of the total costs was lower than in the case of costs at the level 1 because the item of labour cost took up a higher share. The share of petrol consumption in the total costs for the equivalent values of the uti-lization of the truck and petrol price was 43% and 47%, respectively.
Labour costs were the second significant item. in the case of driver costs at the level 2, the lowest petrol price presumed and the utilization of the truck for 500 km, this item comes very close to the value of petrol costs.
on the other hand, in the calculation of drivers’ costs at the level 1, the item of labour costs came very close to the item of depreciation, although it remained the second important item.
[image:4.595.61.538.421.560.2]The range of costs for 1 km travelled was between 0.85 EUr/km for the lowest petrol price, the highest truck utilization and the driver costs at the level 1
Table 1. costs for 1 km travelled – driver costs at level 1
costs for 1 km travelled
up to 500 km/day up 600 km/day
Petrol price EUr/l 1.25 1.35 1.45 1.55 1.65 1.25 1.35 1.45 1.55 1.65 Petrol consumption EUr/km 0.44 0.47 0.51 0.54 0.58 0.44 0.47 0.51 0.54 0.58 Truck depreciation EUr/km 0.18 0.18 0.18 0.18 0.18 0.15 0.15 0.15 0.15 0.15 operational costs EUr/km 0.09 0.09 0.09 0.09 0.09 0.08 0.08 0.08 0.08 0.08 Driver costs EUr/km 0.21 0.21 0.21 0.21 0.21 0.18 0.18 0.18 0.18 0.18 Total cost EUr/km 0.92 0.95 0.99 1.02 1.06 0.85 0.88 0.92 0.95 0.99 Source: own calculations based on experts’ data
Table 2. costs for 1 km travelled – driver costs at level 2
costs for 1 km travelled
up to 500 km/day up 600 km/day
[image:4.595.65.537.609.747.2]and 1.27 EUr/km for the highest petrol price, the lowest truck utilization and the driver costs at the level 2. in this context, it has to be mentioned that the calculated petrol price of 1.65 EUr/km is an extreme price presumed as the potential future eventuality. costs of transporting 100 kg milk over the particu-lar routes, displayed in Table 4, are the intermediate results, which should be continued by the calculation of the difference of costs when short and long jour-neys are travelled. Therefore, the results displayed in Table 5 are taken to be the final instrument for mak-ing a comparison between the costs of an additional 400 km journey and the milk price advantage.
if we compare the collection costs for 100 kg milk when 600 km were travelled and when 200 km were travelled, we can see a difference of 1.13 EUr to 1.32 EUr (depending on the petrol price) for the driver costs at the level 1, eventually a difference of
1.33 EUr to 1.52 EUr when the driver cost at the level 2 are included. These figures represent the ad-ditional cost of the adad-ditional 400 km journey.
[image:5.595.63.535.335.438.2]The maximum milk prices paid by the dairies to milk producers in December 2006 were in the Schleswig-holstein 28.50 EUr/100 kg, in Bavaria 31.82 EUr/100 kg, in Saxony 29.72 EUr/100 kg and in the czech republic after currency conversion 32.14 EUr/100 kg. These prices were paid for the milk qualities mentioned in the part Method. in December 2007, the maximum milk prices recorded in the Schleswig-holstein was 45.60 EUr/100 kg, in Bavaria 49.50 EUr/100 kg, in Saxony 43.69 EUr per 100 kg and in the czech republic after the currency conversion 38.57 EUr/100 kg. There is a significant difference in price levels in both the examined periods due to the extreme price development in the second half year 2007.
Table 3. cost of a 200, 500 and 600 km journey – driver costs at the level 1 and level 2 costs for travelled
level 1 level 2
Petrol price EUr/l 1.25 1.35 1.45 1.55 1.65 1.25 1.35 1.45 1.55 1.65
200 km travelled EUr/truck 184 190 198 204 212 226 232 240 246 254
500 km travelled EUr/truck 460 475 495 510 530 565 580 600 615 635
600 km travelled EUr/truck 510 528 552 570 594 612 630 654 672 696
[image:5.595.64.533.493.598.2]Source: own calculations based on experts’ data
Table 4. The costs of transporting 100 kg milk over particular routes – driver costs at the level 1 and level 2
costs of transporting milk
level 1 level 2
Petrol price EUr/l 1.25 1.35 1.45 1.55 1.65 1.25 1.35 1.45 1.55 1.65 200 km travelled EUr/100 kg milk 0.63 0.66 0.68 0.70 0.73 0.78 0.80 0.83 0.85 0.88 500 km travelled EUr/100kg milk 1.59 1.64 1.71 1.76 1.83 1.95 2.00 2.07 2.12 2.19 600 km travelled EUr/100 kg milk 1.76 1.82 1.90 1.97 2.05 2.11 2.17 2.26 2.32 2.40
[image:5.595.64.531.683.742.2]Source: own calculations based on experts’ data
Table 5. cost difference for the collection and transportation of 100 kg milk over 200 km and 600 km journey driver costs at the level 1 and level 2
cost difference for the collection and transportation of milk
level 1 level 2
Petrol price EUr/l 1.25 1.35 1.45 1.55 1.65 1.25 1.35 1.45 1.55 1.65 cost difference EUr/100 kg milk 1.13 1.16 1.22 1.27 1.32 1.33 1.37 1.43 1.47 1.52
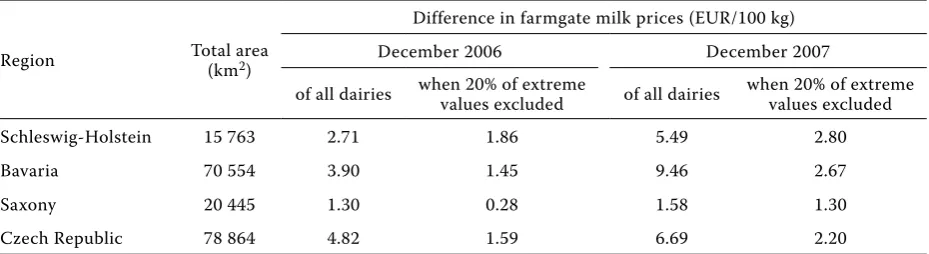
The differences between the maximum and mini-mum price paid in the particular regions are displayed in Table 6. As maximum and minimum prices can be affected by special factors, the price difference was calculated to remove the effect of these extremes by excluding 10% of the highest prices and 10% of the lowest. These figures are displayed in the same tables and are taken to be more relevant for the com-parison.
Farm gate milk prices in the examined areas in central Europe varied in December 2006 by up to 1.86 EUr/100 kg when the figures from the extreme 20% of dairies were excluded. in December 2007, when the price level was higher, the variability of farm gate milk prices in these regions was greater and was up to 2.80 EUr/100 kg.
comparing the price differences to the costs of the additional 400 km journey, there are the follow-ing results. All german federate states examined should be included in the category of driver costs at the level 2. in two of these federate states, namely the Schleswig-holstein and Bavaria, the costs of the additional 400 km journey did not exceed the price difference in December 2007 for all the presumed petrol prices. in the case of the more usual price level (December 2006) in Bavaria, the transportation costs were reasonable till the petrol price was 1.45 EUr/l. in Saxony, the additional journey of 400 km does not seems to be reasonable in any of the periods exam-ined. The results in Saxony were affected by the low price differences, which seem to be the impact of the small number of dairy plants in the area.
in the czech republic, which is a representative of the category driver costs at the level 1, the results proved that transporting milk for an additional 400 km enabled the advantage of a lower price to be preserved from the processors´ point of view in both examined periods. This is due mostly to the big differences of farmgate milk prices in this area because even if the
driver costs were at the level 2, still the transport remained advantageous.
CONCLUSIONS
– The milk collection costs in Europe enable rather long journeys, from the producer to the processor, to be made. in three of four examined regions, the usual collection journey of 200 km followed by the additional journey of 400 km enabled the preservation of the milk price advantage gained due to this journey.
– As the share of the driver costs represents an im-portant share of the total milk collection costs, there seems to be a higher utility for transporting milk for a long distance in the countries where the driver salaries are at a low level.
– The width of the milk price range in the region is af-fected by the milk price level. When the level of milk price increased generally, the range of milk prices in the examined regions was wider. These findings indicate the variability of the financial power of dairy plants. in these areas, where the processors´ financial ability is more differentiated, the long journey for milk seems to be more reasonable. – The feasibility of long collection journeys would
reduce the impact of the local processors on the economics of the surrounding milk producers. – This reality could play an important role in the
movement of raw milk in Europe if milk quotas are increased or abolished.
– The available choice of distant business partners (producers and processors) could grow with the vol-ume of milk being offered by the milk producer. – Farmers have to consider:
[image:6.595.67.532.85.212.2]– supporting the local dairy (even if its milk price is less favourable) preserving the advantage of choice for the future, or
Table 6. The difference in farmgate milk prices in chosen regions in December 2006 and in December 2007
region Total area(km2)
Difference in farmgate milk prices (EUr/100 kg)
December 2006 December 2007
of all dairies when 20% of extreme values excluded of all dairies when 20% of extreme values excluded
Schleswig-holstein 15 763 2.71 1.86 5.49 2.80
Bavaria 70 554 3.90 1.45 9.46 2.67
Saxony 20 445 1.30 0.28 1.58 1.30
czech republic 78 864 4.82 1.59 6.69 2.20
– sell their milk to a successful but more distant proc-essor risking the failure of the local procproc-essor and the future dependency on a monopoly purchaser.
REFERENCES
réquillart V., Bouamra-Mechemache z., Jongeneel r. (2008): The impact of removing quota. comparison of dairy market situation in 2015–16. in: Economic analysis of the effects of the expiry of the EU milk
quota system – final report. institut d’ Economie industrielle, contract 30-c3-0144181/00-0, 03-04. Available at http://ec.europa.eu/agriculture/ analysis/external/milk
Kaspersson E., rabinowicz E., Schwaag Serger S. (2002): Are the researched countries competi-tive in milk production? in: EU Milk Policy after Enlargement – competitiveness and Politics in Four candidate countries. Swedish institute for Food and Agricultural Economics (SLi), Sweden, pp. 87–90.
Arrived on 24th February 2009
Contact address: