Characterization and Optimization of Arc Spray Process Parameters
for Synthesis of TiO
2Nanoparticles
Liang-Chia Chen
1;*, Tsing-Tshih Tsung
2, Ho Chang
2and Jen-Yan Sun
11
Institute of Automation Technology, National Taipei University of Technology, 1, Sec. 3, Chun-Hsiao E. Rd., Taipei 106, Taiwan, R.O.China
2Department of Mechanical Engineering, National Taipei University of Technology, 1, Sec. 3, Chun-Hsiao E. Rd., Taipei 106, Taiwan, R.O.China
This article presents the process characterization and optimization of the nanoparticle fabrication process known as the Submerged Arc Spray Nanoparticle Synthesis System (SANSS) by using a developed on-line nanoparticle measurement system and Taguchi method. Without process characterization and optimization, preliminary experimental results indicated that the average secondary diameter of prepared nanoparticles, widely ranging from 45 to 350 nm, are significantly influenced by the process parameters, such as operating pressure, temperature, electrical current and type of dielectric liquids employed. To improve this, an on-line particle sizing system was developed and deployed to measure the particle dimension and analyze the nanoparticle synthesis process. Experiments based on Taguchi method were then conducted to investigate the optimum process parameters for producing nanoparticles with improved properties, such as particle size and uniformity. The experimental results revealed that the pulsed peak voltage and the pulsed peak current have the most significant effect on decreasing the secondary particle size of the TiO2nanoparticles and that the on-time duration and off-time duration also play an important predominant effect.
Using the optimized process parameters, the average secondary diameter of prepared TiO2particles was reduced from 160 to 65 nm and the
range of particle size disparity was narrowed from 300 to 170 nm. The primary particle size observed from TEM results also confirmed a significant reduction of the averaged TiO2nanoparticle diameter and size disparity.
(Received April 7, 2004; Accepted August 19, 2004)
Keywords: nanoparticles, process characterization, process optimization, on-line measurement, nanoparticle synthesis, Taguchi method
1. Introduction
Achieving the desired properties of nanomaterials have been widely recognized as a crucial step towards successful synthesis of nanomaterials for innovative products and processes. This article presents the process characterization and optimization for a TiO2 nanoparticle synthesis process known as the Submerged Arc Nanoparticle Synthesis System (SANSS).1,2) TiO
2 nanoparticles possess many excellent characteristics, such as strong anti-oxidation capability, high chemical stability, environmental safety and low cost.3)They have been extensively applied to many areas such as bacteria and fungus resistance, photo catalysis, emissions and water purification, self-cleaning, and photosynthesis. The nano-particles produced by SANSS are dispersed in deionized water, so this helps reduce potential aggregation problems encountered by other chemical particle synthesis methods in particle collection. This advantage also helps SANSS to avoid any particle spray processing requirements, as needed by the other techniques.
The size-controlling synthesis is considered to be one of the key processes on the practical application of nano-particles. There are two important reasons in this study for the size controlling synthesis. One is that it is expected to prepare TiO2particles having average diameter less than 100 nanometers, which is defined as an important size limit for any particle to be called nano-scale. Another important reason is that the degree of monodispersity of nanoparticles can significantly influence the quantum effect of particles, which is vital in determining particle properties for success-ful synthesis of nanomaterials.
SANSS, as shown in Fig. 1, has been developed to prepare nanofluids with metal nanoparticles.2,4) In SANSS, electric discharge energy is used to melt and vaporize a metal bar, applied as the electrode, in de-ionized water under a vacuum and low-temperature condition. A significant difference from the conventional electrical discharge machining (EDM) is the pressure-controlled and temperature-controlled mechanism designed for SANSS to enable preparation of nano-scale particles rather than micro-scale ones. Plasma is created and a vapor bubble forms around the channel. The vaporized metal is processed through nucleation, growth and condensation, and thus turns into nanoparticles uniformly dispersed in the dielectric liquid. More importantly, a novel particle sampling and liquid refilling device has been integrated to extract TiO2 particle suspension from the vacuum chamber automatically for on-line particle size analysis and process character-ization.5)
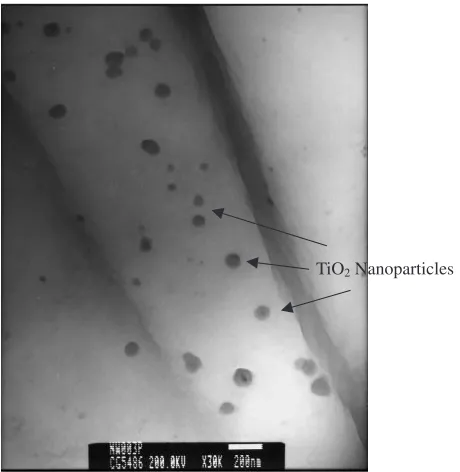
As shown in Figs. 2 and 3, the prepared particles were found with a broad range of size variation from 45 to 350 nm, as identified by TEM and a particle size analyzer using the dynamic light scattering (DLS) principle. Preliminary ex-perimental results indicate that the size and uniformity of nanoparticles are significantly affected by the operating pressure, temperature, electric current applied in the vacuum chamber, as well as other system parameters, such as the feeding rate and vibration mode of the electrode and type of dielectric liquids deployed in the vacuum chamber. It is vital to characterize and optimize the synthesis process for preparation of nanoparticles of the desired size with more uniformity.
Therefore, an innovative on-line particle sizing system was developed and used to measure and monitor the nanoparticle suspension produced in the SANSS, which is operating under
*Corresponding author, E-mail: [email protected]
a vacuum pressure condition (around 3990 Pa) at a low temperature (0–5C).5) Experiments were conducted to determine an ideal set of process parameters, including sampling duration (T), dielectric liquid volume (V) and suspension concentration, to achieve accurate nanoparticle measurement. The objective of employing the Taguchi experiment scheme was to analyze the effect of various process parameters on the size and distribution uniformity of the prepared nanofluids with TiO2nanoparticles. There were four process control parameters in the experiments
per-formed;i.e.pulsed electric peak current, pulsed electric peak voltage, on-time duration and off-time duration of electric power.
2. System Design and Implementation of the Automatic
Nanoparticle Sampling System
There are a few studies on the methods and apparatus for automatic on-line sampling and measurement of nanoparticle properties, such as particle size, distribution and concen-tration in suspension.6–10) Some other processes have been proposed for improving the manufacturing process, but none of them was purposely designed for automatic on-line sampling and measurement of nanoparticle suspension. In view of the above demands, this research developed a novel on-line inspection system for sampling and measuring
Fig. 1 Schematic diagram of the SANSS being integrated with the automatic on-line particle sampling and measurement device.
TiO2 Nanoparticles
Fig. 2 TEM picture of TiO2 nanoparticles prepared from preliminary
experiment.
d / nm
Fig. 3 Secondary particle size and distribution of TiO2 nanoparticles
[image:2.595.90.505.72.340.2] [image:2.595.55.285.380.616.2] [image:2.595.313.539.382.518.2]nanoparticle size to characterize the process parameters in the SANSS.
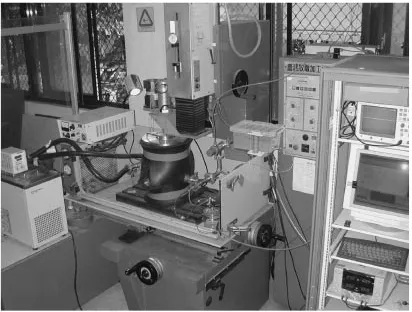
This automatic on-line sampling and inspection system is depicted in Fig. 1 and its hardware setup is illustrated in Fig. 4. It is important to note that the chamber operates under a vacuum condition at a low temperature. Two critical steps in the system design were utilized for extracting nanoparticle suspension from the vacuum chamber into the sample-collecting container. One is the utilization of the pressure difference between the working chamber and the container, which acts as the extracting force to remove nanoparticle suspension samples from the vacuum chamber. Another is to maintain a constant temperature of liquid sample along its transferring path to prevent sample vaporization due to liquid phase transformation.
To achieve this sampling operation, four subsystem units and apparatus are integrated with the SANSS for automatic on-line sampling and measurement. Firstly, automatic liquid refilling unit is used to refill the same quantity of sample as that removed by the sampling unit. The difference in pressure between the liquid supply tank and the vacuum chamber is used to inject fresh dielectric liquid into the vacuum chamber. When the liquid is refilled, the switch valves are deactivated and the spring pushes the injection cylinder back to its original position. Following the first unit, automatic sampling is performed by controlling the pressure difference between the vacuum chamber and the collecting container while the temperature of the suspension is well controlled under the liquid vaporization temperature. This unit consists of a suspension container, a sample-collecting container, a spe-cially designed temperature-control ring and some switch valves. After the prepared suspension has been extracted to the sample-collecting container, the nanoparticle-sizing task is performed by a Horiba particle analyzer and the results are transferred to the PC for data storage and further analysis. This unit consists of the Horiba particle analyzer, some liquid-transferring PU (Polyurethane) pipes and switch valves. In addition, with an adequate software interface, the control unit monitors the operation switch values for automatic manipulation of sampling tasks and data analysis. The basic principle of the DLS (dynamic laser scattering) is to measure distortions in laser light caused by the
Brownian movement of particles and to calculate the mobility of particles in de-ionized liquid so that the diameter of the particles can be further deduced. Laser light rays emitted from the semiconductor light source are concentrated into the particles in the sample cell.11) The scattering influence of the high density is constrained to the position of the convergence point, which is in close contact with the inner walls of the cell. The particle suspension sampled with a volume of 2 mL is delivered to the cell from the on-line sampling system. The scattered light generates fluctuations by Brownian motion, and the size of the fluctuation is dependent on the diameter of the sampling particles. The distribution of sample diameters is detected by analyzing the frequency elements using the Stokes-Einstein equation and autocorrelation.
3. Experimental Design
3.1 Determination of optimized sampling volume and
duration for data accuracy
The main objective of this research is to characterize and optimize the SANSS process by means of on-line measure-ment technique and Taguchi method. To achieve this, it is extremely important to detect and monitor the process characteristics dynamically and efficiently. Retaining the sample quality and its data representation with regard to process characteristics is the key factor in determining the success of the optimization. Some experiments were con-ducted to investigate an ideal set of parameters, such as the sampling duration (T), dielectric liquid volume (V) and liquid particle concentration, in order to obtain reliable particle measurement results. Thus, nanoparticle suspension was sampled using the developed automatic sampling equip-ment according to an experiequip-mental set of various dielectric liquid volume and sampling time periods under two different sets of arc spray process parameters (discharge breakdown voltage, pulsed peak current, pulsed on-time and off-time duration) to investigate variation of particle measurement results.11) The TEM (transmission electron microscopy) images of the prepared nanoparticle suspension, shown in Fig. 2, were also evaluated to ensure the accuracy of data measured by the on-line inspection system.
It was found that the particle size and distribution could generally be stabilized after a certain period of process operation, regardless of the liquid volume and process parameters. To ensure data representation and accuracy, some experimental results were obtained under sets of various process parameters with great electric arcing power differences. The TiO2particle suspension samples, shown in Fig. 5, were prepared with various sampling condition. Experimental results confirmed that the designed dielectric volume of 40 mL or more, and sampling period of 2 min could achieve reliable data measurement of particle proper-ties with acceptable data error level of within5%.
3.2 Experiment matrix employing the Taguchi L
orthogonal array
In preparing nanofluids with TiO2 nanoparticles by the method described above, many processing parameters are involved. However, only the following four dominated
[image:3.595.66.272.72.228.2]parameters listed in Table 1, namely electric voltage, Process parameter A; electric current, B; on-time duration and off-time duration of electric energy, C and D; as well as electric gap E, were selected for the study in Taguchi experiment.2) The optimum values associated with other processing parameters were determined in the pre-test described above. The experiments were arranged by using of L orthogonal array. Each experiment was conducted more than three times. The average secondary particle size and the width of particle size distribution of TiO2 nanoparticles were used as the output value, which represented a measure of a quality index for particle dimension effect in the Taguchi experiment.
4. Results and Discussion
4.1 Preparation and measurement of TiO2
nanoparti-cles
As mentioned in the preceding experiment section, TiO2 nanoparticles of different sizes suspending within dielectric liquid were obtained by varying the four selected parameters listed in Table 1. The pure titanium was heated by an electric arc with a temperature up to 6000C during the synthesis
process of the SANSS. To achieve accurate assignment of the system parameters, a parameter control module was applied to coordinate the condition of preparation. After metal vaporizing and suspending nanoparticles in the liquid for a preset sampling duration, a preset sampling quantity of nanoparticle was automatically injected into the particle collector and a series of particle analyzers were used to determine the characteristics of nanoparticle, such as particle size, distribution, structure images and optical property. The particle size was measured by Horiba-LB500 and TEM
(JEOL JEM-2000 Ex2). In addition, XRD (X-Ray Diffrac-tion) analysis was deployed to determine the components of the nanoparticle, and an UV-vis (Ultraviolet-Visible) spec-trophotometer was used to analyze the optical property.
4.2 Process optimization through Taguchi experiment
methodology
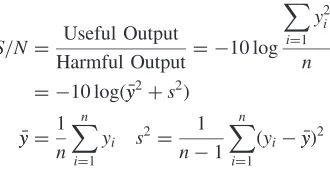
In process optimization, this research employed the Taguchi experiment methodology, and the data were ana-lyzed in terms of signal-to-noise ratio (S=N) and the average of TiO2particle sizes. TheS=Nratio represents an index of data quality, with a larger S=N number corresponding to better accuracy of measured data. The results of the Taguchi experiment are reported in Table 2, along with L orthogonal array. Figure 6 shows theS=Nratios calculated on the basis of the average size of nanoparticles. The quality indexS=N is expressed as
S=N¼ Useful Output
Harmful Output¼ 10 log Xn
i¼1
y2i
n
¼ 10 logðyy2þs2Þ
y y¼1
n
Xn
i¼1
yi s2¼ 1
n1 Xn
i¼1
ðyiyyÞ2
whereyirepresents the average particle size obtained fromn
experiments under identical process parameters,iis equal to 1nandsis the variance of thenexperiments.
Taguchi has proposed an optimization strategy in devel-oping optimal process parameters, which resulted in a robust design for the preparation of desired TiO2 particles.12) Optimization can be used to minimize the dimensional variability of the prepared particles by producing the strongest linear effects between signal factor (dependent variables such as the parameters A, B, C, D and E listed in Table 1) and output response (S=N ratios being calculated
[image:4.595.77.261.74.208.2] [image:4.595.304.549.102.331.2]Fig. 5 Particle suspension samples taken under various operation time.
Table 1 Process control factors and the associated factor levels employed in Taguchi experiments.
A(I) B(V) C(tON) D(tOFF) E(VGap)
Factor Electric Electric On-time Off-time Electrode Level current voltage period period gap
(Ampere) (Volt) (ms) (ms) (mm)
Level 1 0.5 90 2 2 5
Level 2 1.5 210 6 6 7
Level 3 2 215 100 100 10
[image:4.595.46.291.275.376.2]Level 4 3 220 1600 1600 15
Table 2 Results of Taguchi experiment. The left segment of the table is the design of L orthogonal array used. P1, P2and P3in the central segment are
the measured size of TiO2particles obtained from each experiment.
Exp. A B C D E P1 (nm)
P2
(nm) P3
(nm)
S=N
ratio (dB)
Average (nm)
[image:4.595.345.510.568.653.2]and particle size being prepared). This can be achieved by selecting the maximumS=Nratios and the minimum particle size for each control factor.
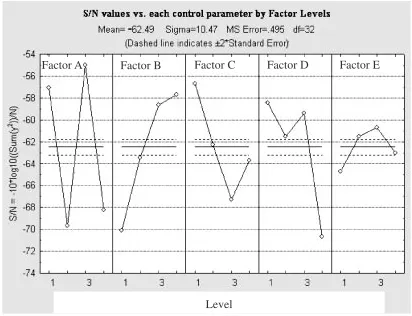
The effect of each control parameters onS=Nratio and the average secondary particle size (yy) can be expressed as response curves, as shown in Figs. 6 and 7, respectively. The difference between the maximum and minimum values of each process parameter relates to the effect of that particular process parameter onS=Nratio or average size. In Fig. 6, it can be noted that the process parameters A and B have a higher influence on the quality indexS=N, whereas E has a much lower effect. The process parameters C and D also have substantial effect on the quality index. Since a greaterS=N
corresponds to a better process stability, the process parameter combination A3–B4–C1–D1–E3 can be consid-ered to result in the highest process stability of experiment in this study. However, the influence of the process parameters on the prepared particle size depends on the average of secondary particle diameter, (i.e.the smaller the diameter the better it is), then the best combination is A1–B4–C1–D1–E2. Figure 7 reveals that Parameters B and A have the most significant effects on decreasing the secondary particle size of the TiO2nanoparticles, but Parameters C and D also play an important effect. These results confirm that the size of the prepared particles was significantly influenced by these four processing parameters in the SANSS although the electric
current and voltage have slightly more influence in determin-ing the particle size than the other two parameters. In contrast, Parameter E has less impact on the determination of the particle size. This is mainly caused by the fact that the electric gap was automatically manipulated and adjusted by the servo control system used in the SANSS for stable arcing operation. Thus, its effect on the particle forming was influenced by other system parameters.
[image:5.595.65.271.73.231.2]Furthermore, the analysis of variance (ANOVA) shown in Table 3 was performed on theS=Nratios. This was used to investigate which process parameters significantly affect the process response, i.e., the quality characteristic of the SANSS. The results of ANOVA indicate that pulsed peak voltage (A) is the most important process parameter affecting the process response, while pulsed peak current (B) and off-time duration (D) also have considerable influence. These three factors together contributed nearly 84% of the experimental variance. These observations are in good agreement with those given in Fig. 6.
4.3 Optimized results and analysis of the experimental confirmation
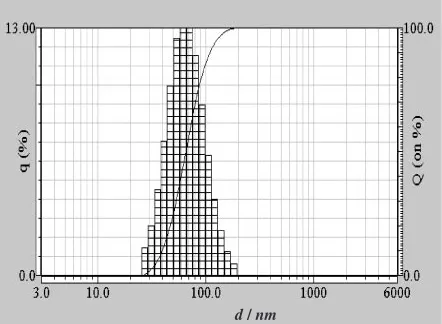
A confirmation trial under the selected optimal process parameters was performed to check the average secondary size and distribution of the prepared particles from the benchmark to the optimum. The parameters used in the confirmation run are listed in Table 4. The experimental results of the confirmation run, obtained by using a Horiba particle analyzer shown in Fig. 8, indicated that the average secondary particle size was 62 nm and the particle size distribution was ranging from 30 to 200 nm with a particle size disparity of 170 nm. It is apparent that the average secondary particle size was reduced by up to 60% (from 160 to 65 nm) and the particle disparity has also improved nearly 50% (from 300 nm down to 170 nm) after process parameters were optimized. The sizes of these nanoparticles were Factor A Factor B Factor C Factor D Factor E
Level
Fig. 6 Relationship betweenS=Nvalues and each control parameter.
Factor A Factor B Factor C Factor D Factor E
[image:5.595.305.548.83.201.2]Fig. 7 Relationship between average secondary particle size (yy) and each control parameter.
Table 3 ANOVA analysis of the Taguchi experimental data.
Effect Analysis of variance
Mean¼ 62:075 Sigma¼11:3185
SS df MS F p
[image:5.595.61.276.275.428.2]A 2354.987 3 784.9955 6349.033 0.00E-01 B 1399.970 3 466.6568 3774.314 0.00E-01 C 801.450 3 267.1501 2160.706 0.00E-01 D 1268.007 3 422.6690 3418.541 0.00E-01 E 192.676 3 64.2254 519.454 3.30E-27 Residual 3.956 32 0.1236
Table 4 The optimized parameters set being selected for the confirmation trial.
A(I) B(V) C(tON) D(tOFF) E(VGap)
Factor Electric Electric On-time Off-time Electrode Trial current voltage period period gap
(Ampere) (Volt) (ms) (ms) (mm) Confirmation
based on particle size
[image:5.595.304.549.701.785.2]examined with TEM, the element of nanoparticles was identified with XRD analysis, and the results are shown in Figs. 9 and 10, respectively. The XRD results confirmed that the synthesized nanoparticles were titanium oxide with anatase phase.
[image:6.595.312.541.72.263.2]It should be noted that the measurement results shown in Fig. 8 obtained as average secondary particle size by using a Horiba particle analyzer are obviously larger than the TEM results shown in Fig. 9. This is because the basic principle of the Horiba analyzer is based on DSL to calculate the mobility of particles for deducing the diameter of the particles. The accuracy of measurement results may be to some extent affected by the condition of partial particle clustering in TiO2 suspension. In contrast, the TEM results represent more direct observation of particle size and distribution within a more local region. Thus, the TEM results tend to be smaller than those of the Horiba analyzer, since there is less light occlusion incurred by particle clustering. However, the measurement results of the Horiba analyzer represent a larger sampling volume of TiO2suspension than one of TEM
measurement, and they can be used for on-line process evaluation. In general, it is suggested to include both types of the analysis for more accurate data interpretation.
To ensure a consistent evaluation of the process optimi-zation, the primary particle size estimated from TEM observation was also analyzed to evaluate the difference between the size of particle produced in preliminary experi-ment and that in confirmation run. The averaged TiO2 primary particle size was reduced from 150 to 10 nm, as estimated from TEM pictures shown in Figs. 2 and 9. In addition, the particle disparity was also reduced from 300 nm to less than 10 nm. It is clear that the primary and secondary particle sizing results have both validated that the particle size and disparity were effectively minimized in the process optimization.
It is worth noting that the particle dimension can still be further improved to be closer to the desired product dimension by considering more process parameters in the experimental design, such as the electrode size, the operation temperature of the suspension and the pressure of the vacuum chamber. Furthermore, partial particle clustering of TiO2 nanoparticle suspension was found to be the main reason for the difference between the primary particle size and the secondary particle size measured by TEM and Horiba particle size analyzer, respectively.
5. Conclusions
The process characterization of the nanoparticle fabrica-tion process (known as SANSS) has been effectively conducted to optimize the nanoparticle dimension by using an on-line nanoparticle measurement system and Taguchi method. This on-line sampling and measuring system can provide an effective solution for analyzing the nanoparticle synthesis process and monitoring the sample characteristics of the SANSS. Based on the Taguchi experimental design, the results indicate that the pulsed peak voltage and the pulsed peak current have the most significant effect on decreasing the secondary particle size of the TiO2 nano-particles, and that the process parameters such as pulsed on-d / nm
Fig. 8 Secondary particle size and distribution of TiO2 nanoparticles
prepared from the confirmation run. q stands for the percent of particle volume and Q denotes for the accumulated percent of particle volume.
Examples of particle clustering
Individual TiO2
nanoparticles
Fig. 9 TEM picture of TiO2nanoparticles prepared from the confirmation
[image:6.595.58.279.75.237.2]run.
Fig. 10 The RDX result of TiO2 nanoparticles prepared from the
[image:6.595.50.287.305.495.2]time duration and off-time duration also play an important effect in determining the particle dimension. In contrast, the electrode gap measured as a process parameter has much less influence on the determination of the particle size since this parameter was manipulated by the servo system during the particle synthesis process. By applying the optimized process parameters being identified through the above methodology, the experimental results indicate that the average secondary particle size was effectively reduced from 160 nm down to 65 nm with a clear improvement of 60% and the range of particle size disparity was reduced by 50% at the same time. The effectiveness of the process optimization was confirmed by observing TEM pictures that the averaged primary particle size was considerably reduced from 150 to 10 nm.
Acknowledgements
The study was supported by the National Science Council of Taiwan, the Republic of China through the grant number NSC 92-2212-E-027-014.
REFERENCES
1) T. T. Tsung, H. Chang, L. C. Chen, H. M. Lin and C. K. Lin:6th International Conference on Nanostructured Materials, June 16–21, Orlando, Florida, Vol. 1 (2002), paper No. PC3.20.
2) T. T. Tsung, H. Chang, L. C. Chen, L. L. Han, C. H. Lo and M. K. Liu: Mater. Trans.44(2003) 1138–1142.
3) H. D. Jang, S. K. Kim and S. J. Kim: J. Nanopar.: Res.3(2001) 141– 147.
4) H. Chang, T. T. Tsung, L.-C. Chen, Y.-C. Yang, H.-M. Lin, L.-L. Han and C.-K. Lin: Mater. Trans.45(2004) 806–811.
5) L. C. Chen,et al.: R.O.C. Patent No. 092116005 (2004). 6) B. D. Sowerby: US Patent No. 5,569,844 (1996). 7) S. H. Lee: R.O.C. Patent No. 78201622 (1989). 8) B. W. Tong: R.O.C. Patent No. 83202675 (1994).
9) H. Chang, T. T. Tsung and H. M. Lin: R.O.C. Patent No. 090126815 (2001).
10) T. T. Tsung, H. Chang and H. M. Lin: R.O.C. Patent No. 091114909 (2001).
11) L. C. Chen, T. T. Tsung, H. M. Lin and J. Y. Sun: Key Eng. Mater. (2004) (In press).