Selenium importance was recognized in animal nutrition in 1957, when Schwarz and Foltz (1957) found that selenium prevented exudative diathesis in broilers and liver necrosis in rats and geese. In the same year, Mills (1957) reported that selenium was a component of the cell enzyme glutathione peroxidase. The structure of this enzyme was de-termined by Rotruck et al. (1973). The major form of GSH-Px is Se-dependent, the role of Se in animal nu-trition has attracted considerable attention (Mahan, 1999). The blood plasma activity of this enzyme was significantly reduced in Se-deficient hens (Hassan, 1990b). Selenium in poultry nutrition was described in reviews by Surai (2002a,b). Se plays an important
role in the regulation of various metabolic processes in the body, being an integral part of selenoproteins. Organic Se in the form of selenomethionine is a pre-dominant form of this element in feed ingredients. Therefore the digestive system of animals including chickens has adapted to this form of the element during evolution. In this regard selenite (a common form of Se used in diets) is not found naturally and as a result it is less effective in terms of assimilation from the feed and building Se reserves in the body (Surai, 2002a). Inorganic Se can be found in differ-ent minerals in the form of selenite, selenate and selenide. In contrast, in forages, grains and oilseed meals Se is bound to different amino acids including
Supported by the Ministry of Agriculture of the Czech Republic (Project No. MZe 0002701403).
Effect of dietary sodium selenite, Se-enriched yeast
and Se-enriched Chlorella on egg Se concentration,
physical parameters of eggs and laying hen production
M. Skřivan
1,2, J. Šimáně
2, G. Dlouhá
1, J. Doucha
31Research Institute of Animal Production, Prague, Czech Republic 2Czech University of Agriculture, Prague, Czech Republic
3Institute of Microbiology, Academy of Sciences of the Czech Republic, Třeboň, Czech Republic
ABSTRACT: ISA Brown laying hens at 24 weeks of age, housed in laying battery cages, were used in this 4-group experiment. One group was fed a basal diet containing primarily maize, soybean meal and wheat. Selenium (Se) content of the basal diet was 0.07 mg/kg dry matter. The other hens received diets supplemented with Na2SeO3, Se-enriched yeast and Se-enriched alga Chlorella, respectively, in a concentration of 0.3 mg Se/kg. The experiment lasted twenty-seven weeks. Egg production, feed consumption, egg weight, physical parameters of egg white, yolk and egg shell were examined every third week and egg white and yolk Se content repeatedly. Se was determined by inductively coupled plasma mass spectrometry. All three sources of added Se increased the egg white and egg yolk Se content (P < 0.001). Selenium in the organic form increased further Se in the egg components compared to sodium selenite (P < 0.001). More Se was deposited in egg white than in egg yolk, especially in relation to the increasing time of the experiment. The increase of Se concentration in egg white corresponded with increasing egg white weight in both organic selenium sources (P < 0.05). Higher egg white thickness and better Haugh units were observed only in the Se-Chlorella group. Hens receiving the diet with Se-Chlorella also had better egg pro-duction compared to the basal diet (P < 0.05). Egg weight was significantly higher in the Se-Chlorella and Se-yeast groups compared to the basal diet and the diet with sodium selenite (P < 0.05). The Se-enriched alga Chlorella showed summarily best results.
methionine and cysteine. Plants absorb Se from the soil in the form of selenite or selenate and synthesise selenoaminoacids with SeMet representing about 50% of Se in cereal grains (Olson and Palmer, 1976) and Se-methyl-selenomethionine, selenocysteine and Se-methyl-selenocysteine. A selenium concen-tration in the animal tissue (Bobcek et al., 2004) and in edible egg components is generally a reflection of the nutrient levels and sources of the diet. Latshaw (1975) reported that the body tissue and eggs from hens fed natural Se contained more Se than did those from hens fed selenium selenite. Egg production, fer-tility and hatchability were low in Se-deficient hens, although these parameters were partially corrected by vitamin E supplementation, and completely nor-malized by an addition of Se (Latshaw and Osman, 1974). Hens fed barley Se had a significantly higher concentration of Se in egg yolk and egg white in comparison with those receiving sodium selenite (Hassan, 1990a). Stibilj et al. (2004) found a higher Se content in egg yolk than in egg white after the addition of Na2SeO3 into the hen diet. Kuricova et al. (2003) demonstrated advantages of chick feed with Se-enriched yeast due to more effective Se utilization and formation of mobile body deposits of this microelement than in supplementation with selenite. Hen’s egg contains about 60% of egg white and 30% of egg yolk. A half of egg white is com-posed by ovoalbumin. Dietary Se intake increases the concentration of selenoproteins in blood and body tissues. It is a question whether selenium has an influence on the amount of egg white in the egg or on the other egg quality indicators. It was published that Se addition into the hen diet could extend the freshness of storage eggs (Wakebe, 1998). Eggs qual-ity and freshness are evaluated by Haugh units i.a. (Haugh, 1937), which result from egg white thick-ness parameters.
The aim of the study was to find out the effect of a new selenoprotein source, Se-enriched alga Chlorella, on Se accumulation in eggs, qualitative egg indicators and marginally also on hen pro-duction indicators. The effect of Se-Chlorella was evaluated in relation to used Se sources, sodium selenite and Se-yeast.
MATERIAL AND METHODS
A total of 72 ISA Brown laying hens, 24 weeks old, were distributed in laying battery cages, three hens per cage, and randomly divided into 4 groups
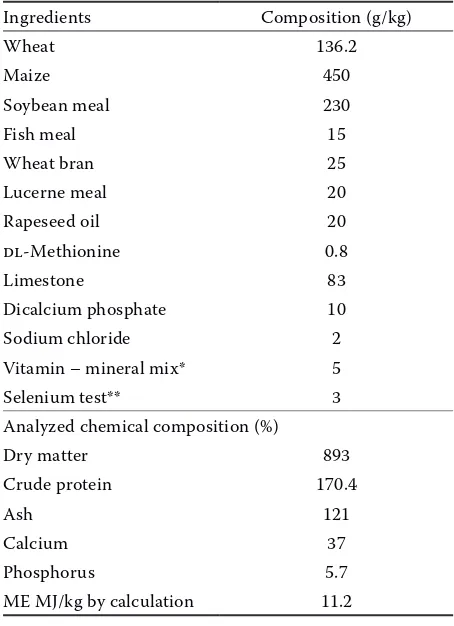
[image:2.595.303.530.276.589.2]of 18 birds each. Groove feeders were divided with sheet-metal barriers between the cages. Hens were housed in an environmentally controlled room and subjected to a photoperiod of 15 h light and 9 h dark. Feed and water were available ad libitum. A diet consisted primarily of maize, soybean meal and wheat (Table 1). Se-Chlorella was prepared in the Institute of Microbiology, Academy of Sciences of the Czech Republic, Třeboň. Se-yeast was ob-tained from Alltech incorporated.One group of hens received a basal diet. Analytically deter-mined Se content in the basal diet was 0.07 mg/kg
Table 1. Composition of the basal diet
Ingredients Composition (g/kg)
Wheat 136.2
Maize 450
Soybean meal 230
Fish meal 15
Wheat bran 25
Lucerne meal 20 Rapeseed oil 20 dl-Methionine 0.8
Limestone 83
Dicalcium phosphate 10 Sodium chloride 2 Vitamin – mineral mix* 5 Selenium test** 3 Analyzed chemical composition (%)
Dry matter 893
Crude protein 170.4
Ash 121
Calcium 37
Phosphorus 5.7
ME MJ/kg by calculation 11.2
*the vitamin/mineral premix provided per kg of diet: vitamin A 8 000 IU; cholecalciferol 2 250 IU; vitamin E 15 mg; mena-dion 1.5 mg; thiamine 1.5 mg; riboflavin 4 mg; pyridoxine 2 mg; vitamin B12 10 μg; niacin 20 mg; calcium pantothenate 6 mg; biotin 60 μg; folic acid 0.4 mg; choline chloride 250 mg; betaine 50 mg; butylated hydroxytoluone 50 mg; cobalt 0.3 mg; copper 6 mg; iron 30 mg; iodine 0.7 mg; manganese 60 mg; zinc 50 mg
**the test selenium supplement contained variable amounts of wheat meal and selenium sources
dry matter. The other hens received diets supple-mented with Na2SeO3, Se-enriched yeast and Se-en-riched Chlorella, respectively, in a concentration of 0.3 mg Se/kg (Table 1). The total Se content was 1 000 mg Se/kg Se-enriched yeast and 251 mg Se/kg Se-enriched Chlorella. The addition of Se-enriched Chlorella was 1.2 g/kg feed mixture and Se-enriched yeast was added at an amount of 0.3 g/kg feed mix-ture. The experiment lasted twenty-seven weeks.
Egg production was examined every day, feed consumption once a week. All eggs were weighed every week, the two same days consecutive. Egg physical parameters were examined every third week, 2 days consecutive. We used Kolumbus-M (Simeonová et al., 1992) for nondestructive deter-mination of eggshell strength.
Twenty eggs of each group were collected in the 2nd and 21st week of the experiment for analyses of
dry matter content and Se content in egg yolk and white. The eggs were weighed, egg yolks and whites were separated and subsequently weighed. Always 5 egg yolks or whites were homogenized and so 4 mixed samples of each group were created.
One g of the sample of feed, egg yolk and white was digested in a mixture of 5 ml HNO3 and 2 ml 30% H2O2 (trace analysis grade, Analytika, Ltd., Prague, Czech Republic), in teflon high-pressure vessels in an MDS-2 000 microwave oven (LabX, Midland, ON, Canada). Mineralisates were diluted with deionised water to the final volume of 50 ml. Se was determined by inductively coupled plasma mass spectrometry, using an ICP-MS Varian in-strument (Varian Australia, Cleyton South, MDC). The used analytical procedure was validated by the analysis of certified reference material NIST Whole Egg Powder 8415 containing 1.595 ± 0.050 mg Se/kg. The reference material was from the National Institute of Standards and Technology (Gaithersburg, MD, U.S.A.). Crude protein in the feed was determined using a Kjeltec Auto 1030 Ana- lyser (Tecator AB Comp., now FOSS Analytical AB, Sweden). Other analyses (ash, DM, Ca, P) were done by standard AOAC (1980) methods.
The data were evaluated by ANOVA: when ap-propriate (P < 0.05) post-hoc analyses were carried out using Scheffe’s test. All values were calculated on a DM basis.
RESULTS AND DISCUSSION
The analytically determined Se content in diets well corresponds to an addition of 0.3 mg Se/kg into the basal diet with 0.07 mg Se/kg (Table 1). In the range of 0.37–0.41 mg/kg Se did not exceed the limit allowed in EU, which is 0.5 mg Se/kg of diet (EU Directive, 2004). In the case of sodium selenite Se content in egg white increased twice, in the case of Se-yeast and Se-Chlorella more than three and a half times, within 14 days from the start of feeding Se-enriched diets. The difference between Se in sodium selenite and organic selenium sources was highly significant (P < 0.001). The increase of Se in egg yolk was lower than in egg white, but equally (P < 0.001). The second series of analyses showed a further increase in the amount of Se in egg white and egg yolk except Se in egg yolk from sodium selenite. In this case there was no change in com-parison with the first two weeks of the experiment. No significant differences were found between yeast and Chlorella. We demonstrated that Se-Chlorella was equally effective as Se-yeast for Se transfer from the feed into the eggs. On the other hand, Se in Na2SeO3 was much less effective. Surai (2000b) mentioned the coefficient of determination between dietary (organic) Se and Se in egg yolk R2 = 0.96 and Se in egg white in relation to Se in
diet R2 = 0.98 with P < 0.01. In our experiment Se
[image:3.595.62.533.680.726.2]in sodium selenite highly increased Se in egg white and yolk (P < 0.001). Cantor (1997) published that Se was more effectively deposited in egg yolk than in egg white. Hassan (1990a) found more Se from sodium selenite in egg yolk and more Se from barley in egg white. Stibilj et al. (2004) reported less Se in egg white than in egg yolk, but Na2SeO3 addition and total Se content in diet were approximately half
Table 2. Se concentration in egg white and yolk (mg/kg dry matter)
Basal Sodium selenite Se-yeast Se-Chlorella P-value Egg white Se content 0.58 ± 0.09c 1.36 ± 0.08b 2.05 ± 0.13a 2.13 ± 0.17a 0.001
Egg yolk Se content 0.62 ± 0.06c 0.93 ± 0.08b 1.48 ± 0.08a 1.60 ± 0.07a 0.001 a,b,c means marked with a different superscript letter within each column are significantly different, determined by Scheffe’s
compared with our experiment. More Se from all the examined sources was measured in egg white already after 14 days of the experiment (Table 2). The difference in comparison with egg yolk was much smaller than at 21 weeks of the experiment. Se content increased mainly in egg white when we used Se-yeast and Se-Chlorella. The increase in egg yolk was relatively lower, but in quantities mark-edly enough. In contrast with this, sodium selenite increased only in egg white.
The increase of Se in egg white corresponds with the increase in egg white weight in both organic Se sources (P < 0.05), which is illustrated in Table 3. Se-Chlorella contributed to higher egg white thick-ness (P < 0.05). Haugh units were higher only in Se-Chlorella diet (P < 0.05). When Wakebe (1998) evaluated egg freshness by Haugh units after an addition of 0.3 mg Se/kg from Se-yeast, differences were found only in storage eggs in comparison with fresh eggs. He did not find any differences in rela-tion to Se addirela-tions within the fresh and storage eggs. On the other hand, Se-Chlorella increased HU significantly in eggs which were laboratory processed immediately after collection (Table 3). In Na2SeO3 and Se-yeast group no significant influ-ence was observed. Se-Chlorella increased Se very
much in both egg components and simultaneously increased egg white quality characterized by pa-rameters of egg white thickness and HU.
Laying rate was high during the whole experiment (Table 4). It was the lowest in the sodium selenite group, but almost the same as in the basal diet. A sig-nificantly higher laying rate (P < 0.05) was recorded only in hens fed the Se-Chlorella diet compared to the basal diet. Feed consumption was not signifi-cantly different. Egg weight was signifisignifi-cantly higher in Se-Chlorella and Se-yeast compared to the basal diet and the diet with sodium selenite. Payne et al. (2005) mentioned a positive influence of Se-yeast addition on egg weight and they simultaneously mentioned a higher occurrence of eggshell defects. They did not note the effect of higher laying rate. Heavier eggs often have thinner and eventually less strong eggshell. Average eggshell thickness was the same during the whole experiment in all the diets (Table 3). The eggshell of heavier eggs resisted less the pressure at nondestructive strength measure-ments, but the differences were not significant.
[image:4.595.63.538.101.222.2]We tried to determine Se fractions, but the results varied. For that reason we could not determine the quantities of Se organic and inorganic form in Se-yeast and Se-Chlorella.
Table 3. Egg white, yolk and eggshell quality (mean ± SD)
Basal Sodium selenite Se-yeast Se-Chlorella P-value Egg white weight (g) 38.58 ± 3.56b 38.92 ± 4.52b 41.29 ± 5.85a 41.27 ± 4.07a 0.001
Egg white height (mm) 7.52 ± 1.33b 7.61 ± 1.51b 7.48 ± 1.16b 7.96 ± 1.24a 0.05
Haugh units (HU) 85.24 ± 8.26b 85.40 ± 9.51ab 84.71 ± 7.26b 87.37 ± 7.03a 0.05
Egg yolk weight (g) 15.91 ± 1.81a 15.83 ± 1.84ab 15.39 ± 2.00b 16.00 ± 1.84a 0.05
Egg yolk height (mm) 17.76 ± 1.50 18.08 ± 1.71 17.98 ± 1.52 18.07 ± 1.74 0.09 Eggshell strength (µm) 28.62 ± 6.54 29.04 ± 7.96 29.77 ± 7.78 29.29 ± 8.17 0.38 Eggshell thickness (mm) 0.39 ± 0.04 0.39 ± 0.04 0.39 ± 0.04 0.39 ± 0.04 0.57
a,bmeans marked with a different superscript letter within each column are significantly different, determined by Scheffe’s
test
Table 4. Laying rate, egg weight, feed consumption and feed conversion (mean ± SD)
Basal Sodium
selenite Se-yeast Se-Chlorella P-value Laying rate (%) 94.38 ± 6.07b 94.13 ± 6.69b 94.60 ± 7.90ab 96.46 ± 6.83a 0.05
Egg weight (g) 62.26 ± 4.74b 62.65 ± 5.78b 64.40 ± 7.37a 65.11 ± 5.57a 0.001
Feed consumption/hen/day (g) 117.05 ± 13.70 114.36 ± 11.70 112.04 ± 11.86 116.15 ± 11.92 0.74 Feed conversion rate/1 egg (g) 123.81 ± 16.00 121.19 ± 13.37 118.79 ± 12.27 120.40 ± 13.61 0.85 Feed conversion rate/kg eggs (kg) 2.00 ± 0.26 1.94 ± 0.22 1.84 ± 0.21 1.86 ± 0.22 0.34
a,bmeans marked with a different superscript letter within each column are significantly different, determined by Scheffe’s
[image:4.595.63.533.277.379.2]We can conclude that even if all the sources of added Se enriched the individual diets with about the same amount of this element, different results were obtained. Summarily, the lowest effect was found in sodium se-lenite, which was in line with literature. On the other hand, this inorganic selenium source was effectual in an Se increase in egg, especially in egg white. Remarkable differences were between Se-yeast and Se-Chlorella. Se-enriched Chlorella showed better results.
REFERENCES
AOAC (1980): Association of official analytical chemists. Official Methods of Analysis. Washington, DC. Bobcek B., Lahucky R., Mrazova J., Bobcek R., Novotna
K., Vasicek D. (2004): Effects of dietary organic seleni-um supplementation on seleniseleni-um content, antioxida-tive status of muscles and meat quality of pigs. Czech J. Anim. Sci., 49, 411–417.
Cantor A.H. (1997): The role of selenium in poultry nutri-tion. In: Lyons T.P., Jacques K.A. (eds.): Biotechnology in the Feed Industry. Proc. Alltech 13th Ann. Symp.,
Not-tingham University Press, NotNot-tingham, UK. 155–164. EU Directive (2004): 70/524/EEC.
Hassan S. (1990a): Influence of dietary sodium selenite and barley selenium on the performance of laying hens and their subsequent progeny. Acta Agric. Scand., 40, 267–278.
Hassan S. (1990b): Selenium concentration in egg and body tissue as affected by the level and source of selenium in the hen diet. Acta Agric. Scand., 40, 279–287.
Haugh R.R. (1937): The Haugh unit for measuring egg quality. US Egg Poult. Mag., 43, 552–555, 572–573. Kuricova S., Boldizarova K., Gresakova L., Bobcek L.,
Levkut M., Leng L. (2003): Chicken selenium status when fed a diet supplemented with Se-yeast. Acta Veter. Brno, 72, 339–346.
Latshaw J.D., Osman M. (1974): A selenium and vitamin E responsive condition in the laying hen. Poult. Sci.,
53, 1704–1708.
Latshaw J.D. (1975): Natural and selenite selenium in the hen and egg. J. Nutr., 105, 32–37.
Mahan D. (1999): Organic selenium: using nature’s model to redefine selenium supplementation for animals. In:
Lyons T.P., Jacgues K.A. (eds.): Biotechnology in the Feed Industry. Proc. Alltech’s 15th Ann. Symp.,
Notting-ham University Press, NottingNotting-ham, UK. 523–535. Mills G.C. (1957): Haemoglobin metabolism I.
Glutath-ione peroxidase, an erythrocyte enzyme which protect haemoglobin from oxidative damage. J. Biol. Chem.,
229, 189–197.
Olson O.A., Palmer L.S. (1976): Selenoaminoacids in tis-sues of rats administered inorganic selenium. Metabo-lism, 25, 299–306.
Payne R.L., Lavargne T.K., Southern L.L. (2005): Effect of inorganic versus organic selenium on hen produc-tion and egg selenium concentraproduc-tion. Poult. Sci., 84, 232–237.
Rotruck J.T., Pope A.L., Ganther H.E., Swanson A.B., Hafeman D.C., Hoekstra W.G. (1973): Selenium: bio-chemical role as a component of glutathione peroxi-dase. Science, 179, 588.
Schwarz K., Foltz C.M. (1957): Selenium as an integral part of factor 3 against dietary necrotic liver degen-eration. J. Am. Chem. Soc., 79, 3292.
Simeonová J., Vysloužil J., Jeřábek S. (1992): Methods of evaluation of mechanical properties of egg shell in the CSFR and abroad (in Czech). Živoč. Výr., 37, 1043– 1050.
Stibilj V., Vadnjal R., Kovač M., Holcman A. (2004): The effect of dietary arsenic additions on the distribution of selenium and iodine in eggs and tissues of laying hens. Arch. Environ. Contam. Toxicol., 46, 275–280. Surai P.F. (2002a): Selenium in poultry nutrition 1.
Anti-oxidant properties, deficiency and toxicity. Worlds Poult. Sci. J., 58, 333–347.
Surai P.F. (2002b): Selenium in poultry nutrition 2. Re-production, egg and meat quality and practical applica-tions. Worlds Poult. Sci. J., 58, 431–450.
Wakebe M. (1998): Organic selenium and egg freshness. Patent # 10-23864. Feed for meat chickens and feed for laying hens. Japanese Patent Office, Application Heisei 8-179629.
Received: 2005–09–06 Accepted after corrections: 2005–12–02
Corresponding Author
Prof. Ing. Miloš Skřivan, DrSc., Department of Animal Husbandry, Czech University of Agriculture, Kamýcká 957, 165 21 Prague 6-Suchdol, Czech Republic