Comparison of Two Clean up Techniques in Isolation
of Ochratoxin A from Red Wine
Elena BElaJoVá and Drahomíra RauoVá
Food Research Institute, Bratislava, Slovak Republic
Abstract
Belajová E., Rauová D. (2010): Comparison of two clean up techniques in isolation of ochratoxin A from red wine. Czech J. Food Sci., 28: 233–241.
Two procedures for the extraction of ochratoxin A (OTA) from red wine – the reference clean up procedure using specific immunoaffinity column (IAC), and solid phase extraction (SPE) in which an active carbon was employed, was compared. In SPE procedure, various mixtures of dichloromethane (D), toluene (T), acetonitrile (AC), methanol (M), and acetic acid (A) were used as OTA desorption agents. Two types of SPE carbonaceous columns were tested – commercial SPE columns (SupelcleanTM Envi-Carb) with a nonporous graphitised carbon, and SPE columns prepared
in our laboratory (further specified as Lab-Carb) that were filled with a micro particular granular carbon. OTA was extracted from spiked red wine by the use of both carbonaceous columns. The highest OTA mean recovery calculated in relation to the reference IAC procedure was 98.5%, using the Lab-Carb adsorbent and acetonitrile + toluene, 3 + 1 (v + v) as the elution mixture (OTA spike levels of 0.2 µg/l). Using the elution mixture of dichloromethane + methanol, 9 + 1 (v + v), the relative recoveries of 76.4% and 82.9% were reached at the OTA spike levels of 0.2 µg/l and 1.9 µg/l, respectively. The application of Envi-Carb adsorbent generally resulted in a very poor OTA recovery under the ex-perimental conditions used (less than 50%). OTA was detected by liquid chromatography with fluorescence detection (LC-FLD) providing the detection limit of 0.011 µg/l and the quantification limit of 0.033 µg/l.
Keywords: ochratoxin A; solid phase extraction; immunoaffinity column; carbon; adsorbents
Supported by the Research project of Ministry of Agriculture of Slovak Republic, Project No. 08W0301. Mycotoxins are normally undesirable substances
in the diet because of their toxic, mutagenic, car-cinogenic, and teratogenic features. Ochratoxin A (OTA) is a toxic mycotoxin naturally occurring in grain products, nuts, dried fruits, beans, and coffee, as well as in other food commodities, such as beer, wine, and grape juice, although in much lower concentrations. The main producers of OTA are the fungi belonging to the genera aspergillus
(a. niger, a. ochraceus, a. carbonarius) and Peni-cillium (P. verrucosum) (Sáez et al. 2004). As a wine contaminant, OTA was detected for the first time in 1996, and subsequently in 1999. The
spe-cies a. carbonarius was shown to be responsible for OTA contamination in grapes, wine, and vine fruits (Battilani et al. 2006). The first detection of OTA presence in wines in the concentration range of 0.005– 0.4 μg/l was reported by Zimmerli and Dick (1996). Some authors published variable data about OTA presence in both red and white wines, in which OTA levels ranged between 0.1 μg/l and 7.6 μg/l (Visconti et al. 1999; Ottender & Majerus 2000; Markaki et al. 2001; Pietri et al. 2001; Shephard et al. 2003; Gambuti et al.
concentration limit for wines and grape juices produced since the year 2005 to 2 μg/l (Commis-sion Regulation (EC) No. 1881/2006).
In the last decades, the methodology of identifi-cation and quantifiidentifi-cation of mycotoxins in foods has been improved and closely associated with the application of novel techniques and analytical ap-proaches. One of the methods used worldwide for the mycotoxin analysis includes the extraction of the sample with solvents, clean up process apply-ing solid phase extraction (SPE) or immunoaffinity column (IAC) followed by liquid chromatographic separation with fluorescence detection. Wines and grape juices as representatives of liquid matrices do not require an extensive pre-treatment with solvents in comparison with solid food matrices. Only few authors reported on the extraction of OTA from wine by liquid-liquid partitioning with chloroform or by simple dilution of wine when the wine sample had been mixed with phosphate buffered saline solution (PBS) before the clean up through SPE or IAC (Zimmerli & Dick 1996; Castellari et al. 2000; Ottender & Majerus 2000; Markaki et al. 2001; Sáez et al. 2004). The most promising approach to OTA extraction from wine is the dilution of wine with polyethylene glycol and sodium hydrogen carbonate solution followed by the clean up on IAC and subsequent reversed phase liquid chromatographic analysis with fluorescence detection (Visconti et al. 1999, 2001; Belli et al. 2002; Ratola et al. 2005 ). This method was validated for the mycotoxin determina-tion in both wine and beer in a collaborative study and was approved as the reference method by the European Committee for Standardization (CEN) in 2003 (Final Draft prEN 14133 2003). The official method adopted by the Association of Official Analytical Chemists (AOAC) is also based on this technique (Official Method 2001.01 2002).
The employment of antibody-based IAC in the clean up step significantly improved OTA analysis as well. These columns are commercially available (can be obtained from various producers) and represent the best solution in OTA analysis so far. In spite of their practicality and high efficacy, IAC are disposable and expensive therefore their repetitive use is considered in perspective.
Other optional materials could also be used under reversed phase conditions in the wine clean up. For example, carbonaceous adsorption media are convenient for organic polar and non-polar compounds from the matrices of both types of
polarity. Active carbon is an ideal medium for the adsorption due to its wide internal surface. It is usually available in two modalities – as powder activated carbon (PAC) and as granular activated carbon (GAC) (Tchobanoglous & Burton 1991). Active carbon is characterised by high efficacy in the removal of OTA from red wine and showed to be the most advisable among all fining materials tested (Castellari et al. 2001). Similarly, a selec-tive adsorption of OTA from both red and white wines was achieved (up to 72%) when an enologi-cal decolorising carbon was used (Gambuti et al.
2005). The application of active carbon originates prevailingly from the wine technologic practice and up to now, carbon has not been used in the analyses of wine when the quantitative OTA des-orption from the carbon has been required.
In the present work, different procedures were tested for OTA extraction from red wine using SPE technique with a carbon adsorbent. As the reference and comparative method, the extraction of OTA using IAC was applied. The focus of this work was to find an appropriate and simple-to-use method for maximal OTA recovery from wine, employing the selected adsorption media as the alternatives to IAC. For this purpose, various or-ganic solvents and their mixtures were also utilised in SPE procedures for maximal OTA desorption. The content of OTA in the extracts obtained was finally determined by in-house validated HPLC method with fluorescence detection.
MATeRIAl And MeThOds
Chemicals and materials. All the solvents and chemicals used were of analytical and HPLC grade purity: acetonitrile and methanol Chromasolv for HPLC were purchased from Sigma-Aldrich Laborchemikalien (Seelze, Germany); dichlo-romethane from Merck (Darmstadt, Germany); toluene and glacial acetic acid from AFT (Brati-slava, Slovak Republic); polyethylene glycol 6000 for synthesis from Merck (Hohenbrunn, Germany); sodium chloride and sodium hydrogen carbonate from Lachema (Brno, Czech Republic). Deionised water was prepared on Analyst HP model unit from Purite Ltd. (Oxon England).
(Supelco, Bellefonte, USA) and columns based on carbon Ambersorb 563 (Supelco, Bellefonte, USA), specified further in the text as Lab-Carb adsorb-ent, 6 ml, average packing of 501 mg, prepared in our laboratory. Some SPE extractions which required a vacuum support were accomplished on a twelve-column vacuum manifold (J. T. Baker Inc., Phillipsburg, USA) applying the maximal under-pressure of minus 10 kPa.
Preparation of solutions. The dilution and washing solutions were prepared in accord with the CEN final draft prEN 14133:2002. The dilu-tion soludilu-tion was prepared by dissolving 10 g of polyethylene glycol 6000 and 50 g of sodium hy-drogen carbonate in one litre of deionised water. The washing solution contained 25 g of sodium chloride and 5 g of sodium hydrogen carbonate in one litre of deionised water.
Crystal OTA from Sigma-Aldrich Chemie (Stein-heim, Germany) was used for the preparation of the stock standard solution in the concentration of 1.25 g/ml in a mixture of toluene + acetic acid, 99 + 1 (v + v); the spiking OTA solution (12.5 μg/ml) for the wine contamination was prepared from the stock OTA solution by diluting an appropriate volume with mobile phase.
Wine samples. One red wine variety of Slovak origin was used throughout all experiments. The wine was contaminated with the spiking OTA solu-tion to OTA levels of 0.2 µg/l (RSDR 13.9%, n = 10) and 1.9 μg/l (RSDR 13.6%, n = 15), respectively. Relative standard deviation (RSDR) represents the precision of wine spiking as well as the precision of OTA determination in wine, characterised by reproducibility during five months.
HPLC analyses. HPLC system of Agilent Tech-nologies 1100 Series (Waldbronn, Germany) equipped with an auto-sampler and a scanning fluorescence detector, set at the excitation and emission wavelengths of 333 nm and 460 nm, respectively, was used. The separation was per-formed on a stainless steel column Zorbax SB-C18 (250 mm × 4.6 mm, 5 μm particle size), connected to a guard column Zorbax SB-C18 (12.5 mm × 4.6 mm, 5 μm particle size). Acetonitrile with acidified water (20 ml of acetic acid in one litre of deionised water), 1 + 1 (v + v), at the flow rate of 1 ml/min was used as the mobile phase. All analyses were carried out at ambient tempera-ture. HPLC system was automatically controlled by Agilent ChemStation. The peak of OTA was identified by the corresponding retention time or
by the fluorescence spectra in the spectral range 360–440 nm, if appropriate.
Sample clean up using IACs. The procedure described in the European standard (Final Draft prEN 14133 2003) was employed. The volume of 10 ml of red wine diluted with dilution solution (1 + 1, v + v) was applied onto the Ochraprep im-munoaffinity column, previously conditioned with the filling solution being present in the column. The sample was let pass through the column by gravity. IAC was then washed with 5 ml of the washing solution followed by 5 ml of deionised water. The column was dried with air for 10 min and OTA was eluted with 2 ml of absolute metha-nol. The collected extract was then dried on a rotary vacuum evaporator to dryness and the residue was dissolved in 0.25 ml of the mobile phase (acetonitrile + deionised water + acetic acid, 49.5 + 49.5 + 1, v + v + v). The sample was then transferred into a dark vial and 100 μl aliquot was automatically injected onto the separation column using the auto-sampler.
To assess the possible loss of OTA on the glass fibre micro filter (pore size 1.0–1.2 μm), the clean up procedure on IAC with and without wine fil-tration was also carried out. After filfil-tration, the micro filters were extracted in 10 ml of methanol + deionised water, 7 + 3 (v + v), in an ultrasonic bath for 15 minutes. The solvent was then evapo-rated under vacuum to dryness and the residue was dissolved in 0.25 ml of the mobile phase and analysed by HPLC.
Sample clean up using SPE. Various condi-tions using carbonaceous packages were tested in order to find the optimal procedure for OTA recovery from wine, e.g. previous conditioning of carbon or filtration of wine prior to the clean up step. Regarding the carbon conditioning, 2 ml of deionised water or methanol was used for this purpose, before wine was applied on the carbon column. In the next steps, 5 ml of undiluted and filtered or unfiltered red wine was passed through the column. After washing with 2 ml of deionised water, the column was dried with air for 10 min-utes. Finally, OTA was eluted from the column with 2 ml of an elution mixture (the composition of elution mixtures is listed in Table 2).
Czech Republic) was used for the analysis of vari-ance (ANOVA). The statistical significvari-ance was considered at P-value < 0.05.
ResulTs And dIsCussIOn
For the determination of OTA in both white and red wines, HPLC method internally validated in our laboratory was used, following the Euro-pean standard procedure with immunoaffinity clean up process (Final Draft prEN 14133 2003). Quantification of OTA was performed using an external calibration curve in the linear range of 0.033–3.125 μg/l (correlation r2 = 0.9998). The calibration graph was designed through a series of OTA calibration solutions diluted with the mobile phase (acetonitrile + deionised water + acetic acid, 49.5 + 49.5 + 1, v + v + v). The preci-sion of the method, expressed by reproducibility (RSDR), was 10.4% (for OTA level 0.250 μg/l) and 4.3% (for OTA level 2.065 μg/l). The detection and quantification limits were found to be 0.011 μg/l and 0.033 μg/l, respectively.
The extraction of OTA from red wine using IAC was tested at four concentration levels, ranging from 0.2 μg/l to 2.5 μg/l (Table 1). The precision of IAC clean up procedure expressed as RSDr (relative standard deviation of repeatability) varied
from 3.5 to 10.3%. Maximum recovery achieved was 96.7% at the OTA level of 1.9 μg/l.
The recoveries of OTA achieved by SPE tech-nique were compared with those obtained by the immunoaffinity procedure. In all SPE experi-ments, unfiltered wine was used because of the non-significant difference between the filtered and unfiltered wine (P-value = 0.20134). In the recovery study, the OTA peak area coming from the analysis of blank wine (naturally contaminated wine with OTA trace concentration of 0.172 μg/l), was subtracted from the peak area obtained by the analysis of the wine spiked with OTA spiking solution. Blank wine was analysed simultaneously on each series of SPE columns and on each type of elution mixture used as well.
[image:4.595.62.536.503.599.2]The carbonaceous adsorption media were se-lected because they keep unique features for physi-cal adsorption of organic compounds. Two types of active carbon were tested in SPE – the micro particular granular activated carbon Ambersorb 563 (Lab-Carb, particle size up to 45 μm), and the nonporous graphitized carbon (Envi-Carb, parti-cle size up to 126 μm). According to the available data, both carbon types have a good affinity for organic polar and non-polar compounds and are commonly used for the purification of environ-mental samples. These materials are considered to be comparable to the bonded alkylsilica, in
Table 1. Mean recovery of OTA from red wine using IAC (Ochraprep)
OTA concentration
(µg/l) of measurementsNumber Mean OTA content determined (µg/l) SD (µg/l) Mean recovery (%)
0.2 4 0.137 0.006 68.5
1.2 3 1.125 0.085 93.7
1.9 3 1.838 0.064 96.7
2.5 4 2.312 0.239 92.5
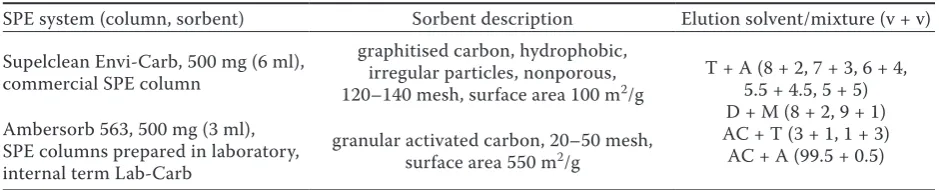
Table 2. Characteristics of used SPE cartridges and composition of elution mixtures
SPE system (column, sorbent) Sorbent description Elution solvent/mixture (v + v)
Supelclean Envi-Carb, 500 mg (6 ml), commercial SPE column
graphitised carbon, hydrophobic, irregular particles, nonporous,
120–140 mesh, surface area 100 m2/g T + A (8 + 2, 7 + 3, 6 + 4, 5.5 + 4.5, 5 + 5)
D + M (8 + 2, 9 + 1) AC + T (3 + 1, 1 + 3) AC + A (99.5 + 0.5) Ambersorb 563, 500 mg (3 ml),
SPE columns prepared in laboratory, internal term Lab-Carb
granular activated carbon, 20–50 mesh, surface area 550 m2/g
[image:4.595.63.533.641.736.2]relation to their structure and selectivity (Guide to Solid Phase Extraction 1998).
Different solvents and solvent mixtures with various polarities were used as the elution agents in SPE procedures (Table 2). At the beginning, toluene and acetic acid at various volume ratios were selected due to their capability of adsorption by active carbon, thus representing an efficient agent for OTA desorption. Undiluted wine with the OTA content of 1.9 µg/l was applied onto unconditioned carbon columns. The highest OTA recovery of 72.2% (RSD 4.9%) was achieved using
the Lab-Carb adsorbent and toluene+acetic acid as the elution mixture in the ratio 6 + 4 (v + v), whereas only 16.0% of OTA (RSD 10.0%) was recovered using Envi-Carb under the conditions used (Figure 1). The increase of acetic acid fraction in the elution mixture led to an enhanced transfer of some wine pigment matrix into the extract. It was noted that the process of OTA adsorption was quite different when using Lab-Carb and Envi-Carb adsorbents – the optimal proportion of toluene and acetic acid apparently varied for maximum OTA desorption.
Figure 1. The dependence of OTA recovery on toluene + acetic acid ratios achieved for adsorb-ents Lab-Carb and Envi-Carb (wine spiked to OTA concentration 1.9 µg/l)
[image:5.595.64.316.84.211.2]Continual line – Lab-Carb adsorbent; dotted line – Envi-Carb adsorbent
Table 3. Recovery of OTA from red wine using SPE procedure and the most advisable elution mixtures
OTA contamination
level (µg/l) Clean up column Elution mixure (v + v) Mean OTA content determined (µg/l) (µg/l)SD
Recovery (%) mean relative*
0.2
Reference IAC M 0.137 0.006 68.5
Lab-Carb
AC + T (3 + 1) 0.135 0.004 67.5 98.5
D + M (9 + 1) 0.114 0.018 56.8 82.9
D + M (8 + 2) 0.112 0.012 55.8 81.5
Envi-Carb
AC + T (3 + 1) 0.120 0.019 47.8 69.8
D + M (9 + 1) 0.024 0.005 12.0 17.5
D + M (8 + 2) 0.023 0.007 11.7 17.1
1.9
Reference IAC M 1.838 0.064 96.7
Lab-Carb
AC + T (3 + 1) 1.112 0.024 58.5 60.5
D + M (9 + 1) 1.404 0.168 73.9 76.4
D + M (8 + 2) 1.360 0.100 71.5 73.9
Envi-Carb
AC + T (3 + 1) 0.115 0.026 6.1 6.3
D + M (9 + 1) 0.076 0.010 4.0 4.1
D + M (8 + 2) 0.206 0.045 10.9 11.3
OTA – ochratoxin A; IAC – immunoaffinity column (Ochraprep); SD – standard deviation; D – dichloromethane; M – methanol; AC – acetonitrile; T – toluene
*Relative recovery (%) = [mean recovery (SPE)/mean recovery (IAC)] × 100 0
20 40 60 80
8+2 7+3 6+4 5.5+4.5 5+5
Toluene + acetic acid (v + v)
O
TA
re
co
ve
ry
(%
)
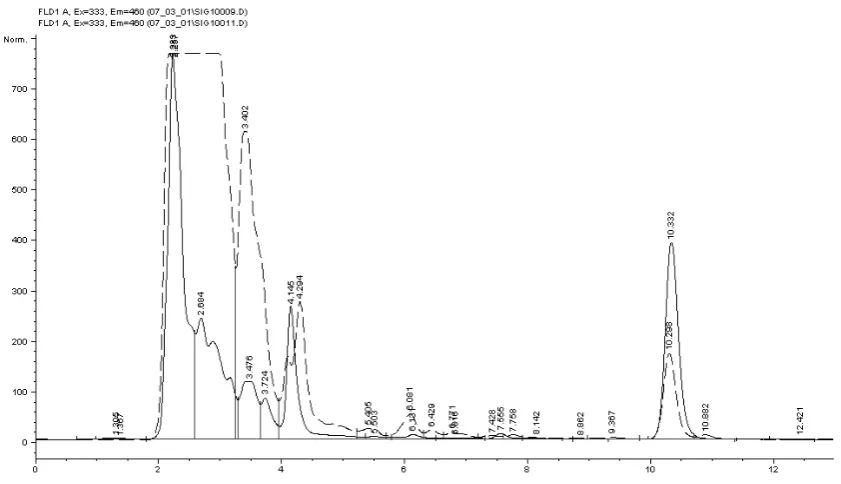
[image:5.595.66.533.438.710.2]Continual line – clean up on IAC (Ochraprep); dash line – clean up on SPE (Lab-Carb)
Figure 2. The extracts of spiked red wine (OTA concentration 1.9 µg/l) recovered by IAC (Ochraprep) and SPE (Lab-Carb adsorbent). The elution mixture was dichloromethane + methanol, 9 + 1 (v + v), for Lab-(Lab-Carb adsorbent; the peak of OTA was eluted in 11th minute
Surprisingly, preliminary conditioning of Lab-Carb adsorbent with deionised water or metha-nol provided OTA recoveries about 8–10% lower compared to the recoveries obtained when un-conditioned carbon was used, depending on the elution mixture. The single-positive effect of car-bon conditioning was noticed as easier wine flow through the adsorbent just by gravity, without the vacuum application. Based on statistical analysis of significance, carbon revealed a better OTA retention without previous conditioning.
Applying the elution solvents listed in Table 2 (with the exception of toluene + acetic acid mixtures), OTA recoveries were dependent on the proportions of individual solvents in the elution mixture. Table 3 involves the recoveries of OTA achieved by both Lab-Carb and Envi-Carb adsorbent. All recoveries obtained by SPE procedures were recalculated in relation to the recovery achieved by IAC and were expressed as “relative recovery” in percentage (relative recovery is a ratio of OTA mean recovery by SPE to OTA mean recovery by IAC, multiplied by 100).
As can be seen in Table 3, the recovery of OTA achieved by reference IAC assay was 68.5% (RSD 4.4%, n = 4) and 96.7% (RSD 3.4%, n = 3) at OTA contamination levels of 0.2 µg/l and 1.9 µg/l, respectively. The summary of the resulting OTA
recoveries apparently indicates that the Lab-Carb adsorbent proved to be a preferable material to the Envi-Carb. The highest OTA recovery was reached on Lab-Carb adsorbent with the elution mixture of acetonitrile + toluene, 3 + 1 (v + v), e.g. 67.5% (RSD 3.0 %, n = 3) that has conformed to the relative recovery of 98.5%, at OTA spike level of 0.2 µg/l. The most balanced recoveries were observed at the both OTA spike levels when the combination of dichloromethane + methanol, 9 + 1 and 8 + 2 (v + v) were used. As Table 3 also indicates, the application of Envi-Carb adsorbent generally resulted in a very low recovery.
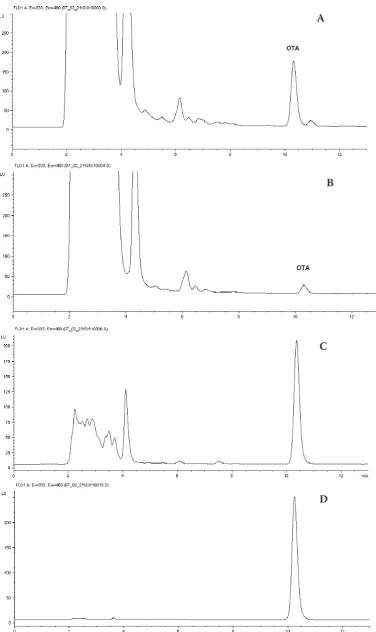
Figure 3. Comparison of adsorbents used in clean up of spiked red wine sample (OTA spike level of 1.9 µg/l); A – use of SPE (Lab-Carb), B – use of SPE (Envi-Carb), C – use of IAC (Ochraprep), D – directly injected standard solution of OTA (injection concentration of 0.0413 µg/ml); elution mixture for A and B was dichloromethane + methanol, 8 + 2 (v + v)
B
C
OTA on the adsorbent surface. Thus, we searched for this phenomenon and performed the analysis of the waste obtained after passing wine through the Envi-Carb column as well as after washing the col-umn with deionised water. The OTA recoveries were tested at margin concentrations of 0.2 µg/l and 1.9 µg/l. The analyses showed that the waste was free of OTA after wine passing through the adsorbent, while the aqueous waste from the washing step contained OTA in concentrations within the LOD–LOQ area (0.011–0.033 µg/l). The adsorption of OTA on Envi-Carb surface was probably strong and could not be disrupted by the elution medium used.
During the SPE extraction, both carbonaceous adsorbents strongly retained the red wine pigment matrix – the passing wine was colourless or faintly coloured. As a result of the elution agents application, the extracts gained some matrix pigments relieved off the carbon surface – thus after dissolving the dried extracts in the mobile phase (acetonitrile + deionised water + acetic acid, 49.5 + 49.5 + 1, v + v + v, pH 4.0–4.5), the colour changed to rosy. The cleanest extracts were achieved using the elution mixture of acetonitrile + acetic acid, 99.5 + 0.5 (v + v), however this mixture allowed very poor recoveries for both adsorbents, ranging from 28.0% to 39.5% at the spiking concentrations examined. In general, the extracts recovered by Envi-Carb adsorbent were less coloured or nearly colourless in comparison to those recovered by Lab-Carb.
Comparing both immunoaffinity and SPE clean up techniques, more wine pigments penetrated into the final extracts when SPE was used. This tendency was proportionally dependent on the increase of the elution solvents polarity. Regarding the separation of OTA from other wine components, OTA was eluted from the analytical column after elution of more polar constituents including pigments, hence they did not interfere in OTA analysis in any way, as it is apparent from the chromatographic record in Figure 2. As a proof, the part of OTA spectrum in the region of 360–440 nm was compared to that of the standard solution. Figure 3 provides a general view of the individual chromatograms obtained by SPE clean up techniques that are compared to the reference IAC procedure.
COnClusIOn
The results of this study indicate that the em-ployment of carbonaceous adsorbents, especially
granular activated carbon, is feasible as an alter-native to more expensive IAC technique in OTA analysis. The extraction and clean up techniques using this adsorbent could provide about 3.0–3.5 times lower cost of analysis comparing to the ap-plication of IAC. However, it is acknowledged that the power of IAC technique consists in a higher selectivity and specificity that allows the cleanest red wine extracts.
As a deduction from the present study, there are two aspects of improving OTA recovery from red wine by the application of SPE on carbonaceous adsorbents. The first one is to resolve the quantita-tive release of OTA from carbon adsorbent by the assistance of other possible desorption mixtures; the second one might be focusing, still prior to the application of SPE column, on the minimisation of the content of pigments in red wine that may show a competitive adsorption towards the OTA or may pass into the final wine extract.
References
Battilani P., Magan P., Logrieco A. (2006): European research on ochratoxin A in grapes and wine. Interna-tional Journal of Food Microbiology, 111: 52–54. Belli N., Marin S., Sanchis V., Ramos A.J. (2002):
Ochratoxin A (OTA) in wines, musts and grape juices: occurrence, regulations and methods of analysis. Food Science and Technology International, 8: 325–335. Castellari M., Fabbri A., Amati A., Galassi S.
(2000): Comparison of different immunoaffinity clean-up procedures for high-performance liquid chroma-tographic analysis of ochratoxin A in wines. Journal of Chromatography A, 888: 129–136.
Castellari M., Versari A., Fabiani A., Parpinello G.P., Galassi S. (2001): Removal of ochratoxin A in red wines by means of adsorption treatments with commercial fining agents. Journal of Agricultural and Food Chemistry, 49: 3917–3921.
Commission Regulation (EC) No 1881/2006 of 19 De-cember 2006 setting maximum levels for certain contaminants in foodstuffs. Official Journal of the European Union, 49: 5–24.
Final Draft prEN 14133 (2003): Foodstuffs –- Determina-tion of ochratoxin A in wine and beer – HPLC method with clean-up on an immunoaffinity column. Brussels – European Committee for Standardization.
wine. American Journal of Enology and Viticulture,
56: 155–162.
Guide to Solid Phase Extraction (1998): Bulletin 910, Sigma-Aldrich, Publication No. T197910.
Markaki P., Delpont-Binet C., Grosso F., Dragacci S. (2001): Determination of ochratoxin A in red wine and vinegar by immunoaffinity high-pressure liq-uid chromatography. Journal of Food Protection, 64: 533–537.
Official Method 2001.01 (2002): Determination of ochra-toxin A in wine and beer. Association of Official Ana-lytical Chemists.
Ottender M., Majerus P. (2000): Occurrence of ochra-toxin A (OTA) in wines: influence of the type of wine and its geographical origin. Food Additives and Con-taminants, 17: 793–798.
Pietri A., Beruzzi T., Pallaroni L., Piva G. (2001): Occurrence of ochratoxin A in Italian wines. Food Additives and Contaminants, 18: 647–654.
Ratola N., Abade E., Simoes T., Venancio A., Alves A. (2005): Evolution of ochratoxin A content from must to wine in Port wine microvinification. Analytical and Bioanalytical Chemistry, 382: 405–411.
Sáez J.M., Medina Á., Gimeno-Adelantado J.V., Mateo R., Jiménez M. (2004): Comparison of differ-ent sample treatmdiffer-ents for the analysis of ochratoxin
A in must, wine and beer by liquid chromatography. Journal of Chromatography A, 1029: 125–133. Shephard G.S., Fabiani A., Stockenstrom S.,
Mshi-cileli N., Sewram V. (2003): Quantitation of ochra-toxin A in South African wines. Journal of Agricultural and Food Chemistry, 51: 1102–1106.
Tchobanoglous G., Burton F.L. (eds) (1991): Waste-water Engineering: Treatment, Disposal and Reuse. 3rd Ed. McGraw-Hill, New York.
Visconti A., Pascale M., Centonze G. (1999): De-termination of ochratoxin A in wine by means of im-munoaffinity column clean-up and high-performance liquid chromatography. Journal of Chromatography A, 864: 89–101.
Visconti A., Pascale M., Centonze G. (2001): De-termination of ochratoxin A in wine and beer by immunoaffinity column cleanup and liquid chroma-tographic analysis with fluorometric detection: Col-laborative Study. Journal od AOAC International, 84: 1818–1827.
Zimmerli B., Dick R. (1996): Ochratoxin A in the table wine and grape-juice: occurrence and risk assessment. Food Additives and Contaminants, 13:
655–668.-Received for publication June 14, 2008 Accepted after corrections April 13, 2010
Corresponding author: