JOURNAL OF FOREST SCIENCE, 50, 2004 (7): 301–312
Beech (Fagus sylvatica L.) in the Polish part of the Carpathians is one of the major forest tree species, and it covers 25.3% of the forest area of this region, while the remaining major tree species – fir (Abies alba Mill.), spruce (Picea abies [L.] Karst.), and pine (Pinus sylvestris L.) take up 25%, 21.7%, and 17%, respectively (TRAMPLER et al. 1990).
The beech stands in the Carpathians between 1950 and 1990 were regenerated using the uniform shelterwood system, the most popular cutting method in the moun-tainous area of the Polish Carpathians. In the early 1980s this type of cutting was used on about 85% of the area of regenerated stands. Generally, the results of this method, with a 15–25-year regeneration period, were satisfactory. Undergrowth of good structure and stocking was obtained permitting beech stands of good quality to form. However, this created even-aged, one-storied stands where a large amount of small products (SCHÜTZ 2001) was harvested during costly tending operations, lowering the economic efficiency of forest management (AMMON 1995). The uniform shelterwood system, due to natural regeneration, decreased silvicultural risk. However, it did not eliminate such a risk (BERNADZKI 1995) due to a short regeneration period and large regenerated areas.
These shortcomings do not occur in the case of the Swiss irregular shelterwood system1 (Swiss femel
coupe1), and especially in the case of selection cut- ting.
The Swiss irregular shelterwood system is increas-ingly used in Carpathian pure fir stands and in stands composed of fir, beech, and spruce (FABIJANOWSKI, JAWORSKI 1996; PRZYBYLSKA,ZIĘBA 2003). The idea to “ecologize the forest management”, obligatory in Polish forestry since 1995, encourages the use of selection cut-ting, mainly in fir forests, especially in mountain forests where a protection function of the forest dominates ( BER-NADZKI 1971; GRANICZNY 1971; JAWORSKI 1979; FA-BIJANOWSKI,JAWORSKI 1996). The possibility of using selection cutting in beech forests is also taken into consid-eration, seeking examples in managed stands and forests of primeval character (reserves, national parks). There is a question whether beech forests of primeval character, known in the Eastern Carpathians of Slovakia and Poland and frequently having a complex structure in the grow-ing up stage (KORPEĽ 1995; JAWORSKI et al. 2000), may become the model for selection beech forests.
Therefore, the purpose of these investigations was to study the characteristics of beech forests of primeval character being in the selection phase of the growing up stage, and also the characteristics of a managed stand of many-storied structure, as well as to determine whether
Beech (Fagus sylvatica L.) forests of a selection structure in the
Bieszczady Mountains (southeastern Poland)
A. J
AWORSKI, Z. K
OŁODZIEJFaculty of Forestry, Department of Silviculture, Agricultural University, Cracow, Poland
ABSTRACT: The characteristics of two beech (Fagus sylvatica L.) stands are presented in this paper. One, the Tarnicki stand, situated in the Bieszczadzki National Park, represents the growing up stage and selection phase of a forest of primeval character. The other one, the Otryt stand, is situated in managed forests of the Lutowiska Forest District. In each stand two sample plots were established. The distribution of the number of trees in each sample plot agreed with de Liocourt sequence and Meyer curve. Both stands were characterized by the structure of many generations. The Otryt stand, with respective volumes of 238 and 324 m3/hain two sample plots, was characterized by a lack of large diameter trees and a high percent of trees of the smallest diameters, while the Tarnicki stand, with volumes of 442 and 517 m3/ha, was characterized by the presence of large diameter trees (d
1.3≥ 72 cm). The phase of the selection forest in the Tarnicki stand is of temporary character because, due to natural processes, a two-storied structure may develop there, and with time, a one-storied structure in the optimal stage. In the Otryt stand, representing a managed forest, the maintenance of the selection structure may be expected due to selection cuttings. It has to be acknowledged that managed stands of characteristics similar to those presented in this paper makes it possible to carry out selection cutting, especially in the protection zone surrounding the Bieszczadzki National Park.
Keywords: selection forest; primeval forest; development stages; Liocourt and Mayer distributions
the forests of such a structure may serve as models in using selection cutting in beech forests of southern Poland.
Study area and sample plots
The Western Bieszczady Mountains, where the Biesz-czadzki National Park is situated, are the most westerly range of the northeastern Carpathians. They are of me-dium height with Tarnica as their highest mountain of 1,348 m in elevation. They are situated within the flysch outer Carpathians (ZARZYCKI 1963).
Brown soils prevail in this area, and among 10 natural forest associations large complexes of old beech, beech-sycamore maple, and beech-fir stands (Dentario glandu-losae-Fagetum and Luzulo nemorosae-Fagetum typicum) dominate (MICHALIK, SZARY 1997).
The sample plots are situated in a belt 600–920 m in elevation (Table 1) where the climate is moderately cool with mean annual temperature from +4 to +6°C and an-nual total precipitation from 900 to 1,200 mm, depending on the elevation. The growing season in this area lasts for 192–199 days, and the snow cover persists for 107 to 114 days (NOWOSAD 1995).
The investigations were carried out in 1998 and 2002 in four stand fragments where a many-storied stand structure was present in a relatively small area.
Two plots, Tarnicki 1 and Tarnicki 2, each 0.25 ha in size, are situated in the Tarnicki forest complex of the Bieszczadzki National Park (compartment 260a, 48.51 ha in area), where no forest management activities have been carried out since 1973. The stand makes a mo-saic of development stages of a primeval forest, with the optimum and growing up stages prevailing. The plots are situated in stand fragments representing the growing up stage. The old growth is formed of beech (Fagus sylvatica L.) with admixture of sycamore maple (Acer pseudoplatanus L.), mountain elm (Ulmus glabra
Huds.), and fir (Abies alba Mill.), while the beech un-dergrowth, covering about 5% of the area, occurs in the
form of single trees, and less frequently in the form of small groups, 0.5–2 ares in size.
The remaining two plots, Otryt 1 and Otryt 2, 0.20 and 0.25 ha respectively, are situated in managed beech for-ests of the Otryt forest complex of the Lutowiska Forest District (compartment 145Ab – 21.45 ha in area). These forests adjoin the Bieszczadzki National Park. The plots represent the most frequently occurring stand fragments. Cuttings similar to the Bavarian group cutting were carried out in this stand till the mid-nineties of the last century. They promoted the development of a storied and complex age structure (see the results). Presently selection cutting is practiced in this stand.
METHODS
Field work
The field work included the measurement of height (Vertex type hypsometer) and diameter (d1.3 ≥ 6 cm) of all trees as well as the classification of tree development generations (A, B, C) according to ŘEHÁK (1964) (see the results). In order to determine tree age, increment cores were taken from 2–4 trees of each development genera-tion. The determination of age at the ground level was impossible in the case of some cores because the annual increments were difficult to read. In plots Otryt 1 and Tarnicki 1, where studies were carried out in 1998 during investigations concerning the primeval forests (Otryt 1 was a control plot), after determination of the tree age, the average age was computed for a given development gen-eration. In the case of plots Otryt 2 and Tarnicki 2 a more detailed method was used giving the age of each tree as well as its characteristics (see the results). The investiga-tions in these two plots were carried out in 2002 in order to get more detailed data on the stand structure.
[image:2.595.65.533.551.745.2]All trees with d1.3 ≥ 8 cm were considered to make up the main stand, while trees with d1.3 6.0–7.9 cm were included in the advanced undergrowth and classified to three classes
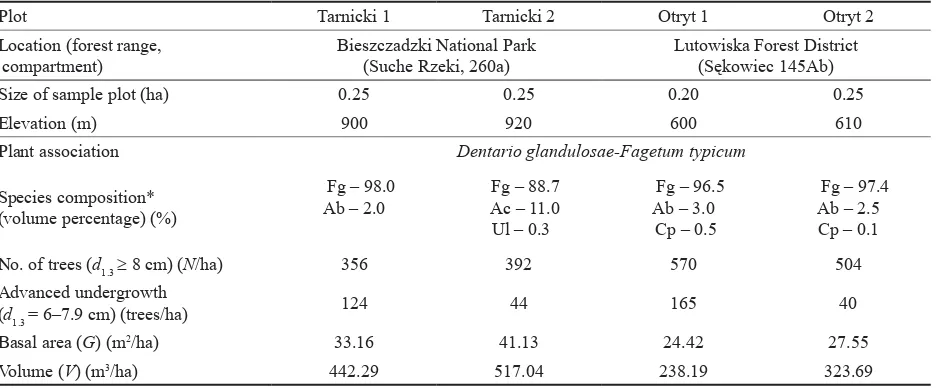
Table 1. Location of sample plots and their site and stand characteristics
Plot Tarnicki 1 Tarnicki 2 Otryt 1 Otryt 2
Location (forest range,
compartment) Bieszczadzki National Park (Suche Rzeki, 260a) Lutowiska Forest District (Sękowiec 145Ab)
Size of sample plot (ha) 0.25 0.25 0.20 0.25
Elevation (m) 900 920 600 610
Plant association Dentario glandulosae-Fagetum typicum
Species composition* (volume percentage) (%)
Fg – 98.0
Ab – 2.0 Fg – 88.7 Ac – 11.0 Ul – 0.3
Fg – 96.5 Ab – 3.0 Cp – 0.5
Fg – 97.4 Ab – 2.5 Cp – 0.1
No. of trees (d1.3 ≥ 8 cm) (N/ha) 356 392 570 504
Advanced undergrowth
(d1.3 = 6–7.9 cm) (trees/ha) 124 44 165 40
Basal area (G) (m2/ha) 33.16 41.13 24.42 27.55
Volume (V) (m3/ha) 442.29 517.04 238.19 323.69
(D1, D2, and D3) on the basis of their vitality and growth tendency (see the results).
Principles of data analysis
For trees of d1.3 ≥ 8 cm the parameters of theoretical dis-tribution of the number of trees were computed according to the de Liocourt geometric sequence
A, A .·q–1, A . q–2, ... A . q–n
where: A – number of trees in the lowest size gradation, q – parameter,
n – number of size gradations
and the MEYER function (1933)
Nd = k · e–ad
where: Nd – number of trees in the size gradation d, k,a – parameters.
The method proposed by RUTKOWSKI (1968) was used for computations. It ensures the equality between the number of trees and mean d1.3 in the existing stand (diameter distribution) and the theoretical stand. It should be stressed that this method makes it possible to compute not the Liocourt quotient but its reverse 1/q indicated here as qR.
The following formulas in following table were used (table).
On the basis of computed parameters the theoretical diameter distributions were made for four investigated stands (per 1 ha). The theoretical and real distributions in 4-cm size gradations (based on the number of trees determined in sample plots) were compared using the chi-squared test at the significance level α = 0.05.�
In this study the Liocourt formula as well as the Meyer formula were used in spite of the identity of theoretical distributions of the number of trees obtained (MEYER
1933) because in the publications concerning selection beech forests the authors presented parameters of one of these two formulas (GROSSMANN 1959; GEROLD, BIEHL 1992; SANIGA 1998a,b; SANIGA, SZANYI 1998).
The stand volume was computed using the “Zasoby” computer program based on the GRUNDNER-SCHWAP-PACH tables (1952).
RESULTS
The stands in sample plots differed in volume (Tarnicki 1 and 2 – 442 and 517 m3/ha; Otryt 1 and 2 – 238 and 324 m3/ha), basal area (Tarnicki 1 and 2 – 33.16 and 41.13 m2/ha; Otryt 1 and 2 – 24.42 and 27,55 m2/ ha), and the number of trees (Tarnicki 1 and 2 – 356 and 392 trees/ha; Otryt 1 and 2 – 570 and 504 trees/ha) – Table 1. They also differed with respect to the distribution of the number of trees and volume in individual diameter classes (Figs. 1–3).
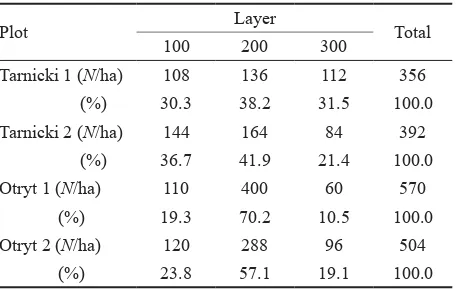
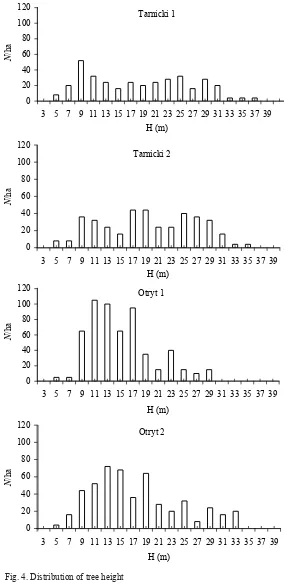
The investigated stands had a diversified storied structure (Table 2, Fig. 4). There were uneven-aged stands ranging in
Formulas Denotations
Meyer function 1
a = ––––– d – b N
1 k = ––– e–ad1
N1 = N (1 – e–a(d1 + 0.5 ε – b)
a, k – parameters d – mean stand d1.3
b – d1.3 measurement threshold
N1 – theoretical number of trees in the first size gradation e – base of a natural logarithm
ε – range of size gradation (4 cm)
d1 – middle value of the first size gradation (10 cm) N – number of trees in a stand (No./ha)
Liocourt sequence qR = e– aε
1 q = ––– qR
A = N . (1 – qR)
qR – quotient of the Liocourt geometric sequence according to Rutkowski; 0 < qR < 1 q – parameter
ε – as in Meyer function
A – theoretical number of trees in the first size gradation N– as in Meyer function
Table 2. Percentage of trees in individual stand layers (according to IUFRO classification)
Plot Layer Total
100 200 300
Tarnicki 1 (N/ha) 108 136 112 356 (%) 30.3 38.2 31.5 100.0
Tarnicki 2 (N/ha) 144 164 84 392
(%) 36.7 41.9 21.4 100.0
Otryt 1 (N/ha) 110 400 60 570
(%) 19.3 70.2 10.5 100.0
Otryt 2 (N/ha) 120 288 96 504
[image:3.595.305.533.82.227.2]age from about approximately 20 to 170 years (Tarnicki), and from approximately 50 to 120 years (Otryt) (no regeneration was taken into account) (Tables 3 and 4).
Trees of the growing up generation of normal vitality (C2) were the most abundant in all plots (Fig. 5). Trees
of the generation of optimal growth, luxuriant (B1) and of normal vitality (B2) were more abundant in the Tarnicki 1 and 2 plots than in the Otryt 1 and 2 plots. Trees of the generation B3 (weakened and dying) occurred only in the Tarnicki 1 and 2 plots, and they were not numerous there (Fig. 5).
There were no trees of the old age generation (A) in the Otryt 1 plot, while in the Otryt 2 plot they were not numerous.
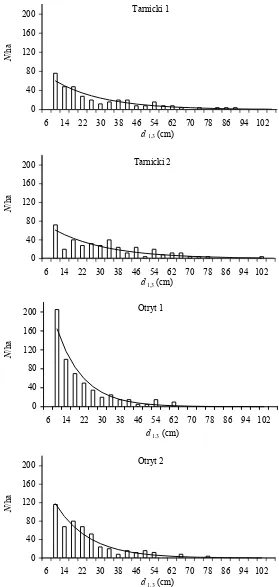
The parameters of theoretical diameter (d1.3) distributions computed for the Liocourt geometric sequence and Meyer function are shown in Table 5, and the diameter distribution in Fig. 1. The results of the chi-squared test showed that real (empirical) distributions of the number of trees were in agreement with the Liocourt-Meyer theoretical distribution in all plots investigated (Fig. 1).
The advanced undergrowth (D), from which the recruitment to the lower story takes place, showed a considerable variability in density in the Otryt 1 and 2 plots (165 and 40 trees/ha) as well as in Tarnicki 1 and 2 plots (124 and 44 trees/ha). In both stands vital beech under-growth (D2) dominated (Table 6).
DISCUSSION
The stands investigated during this study differed with respect to the number of trees per hectare, diameter (d1.3) structure, height structure, age, and volume per hectare. It is unlikely that differences in volume resulted from site variability because both stands are situated in a belt 600–920 m in elevation where the Carpathian beech forests (Dentario glandulosae-Fagetum) occurring between about 500 and 1,150 m in elevation grow under optimal conditions (ZARZYCKI 1963; MICHALIK, SZARY 1997).
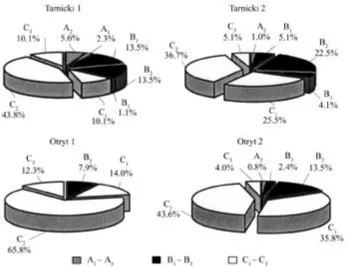
The different origin of these two stands is the main factor responsible for these differences. The Tarnicki stand is situated in a zone of inaccessible stands. It developed as a result of spontaneous natural processes and is of primeval character with many large trees with d1.3 ≥ 52 cm (Figs. 1 and 2). The Otryt stand was formed by intentional silvicultural activities, i.e. the cutting system similar to the Bavarian group cutting with a very long regeneration period.
[image:4.595.59.338.64.651.2]The maximum age of beech trees was distinctly different in the two stands under discussion. In the Otryt stand it was about 120 years, while in the Tarnicki stand approximately from 150 to 170 years (Tables 3 and 4). This maximum age is much different from the age re-ported in the Keula selection forest, where it was 300 years
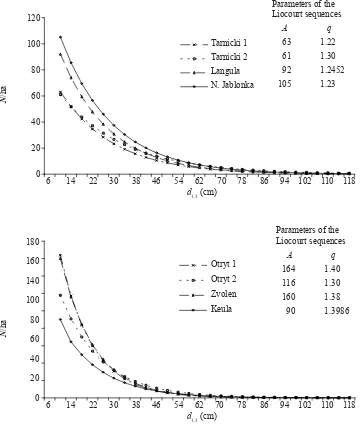
Fig. 1. Diameter (d1.3) distribution compared to the Liocourt and Meyer curve Fig. 1
Otryt 1
0 40 80 120 160 200
6 14 22 30 38 46 54 62 70 78 86 94 102
d1.3 (cm)
N/ha
Tarnicki 1
0 40 80 120 160 200
6 14 22 30 38 46 54 62 70 78 86 94 102
d1,3 (cm)
N/ha
Tarnicki 2
0 40 80 120 160 200
6 14 22 30 38 46 54 62 70 78 86 94 102
d1,3 (cm)
N/ha
Otryt 2
0 40 80 120 160 200
6 14 22 30 38 46 54 62 70 78 86 94 102
d1,3 (cm)
N/ha
N
/ha
N
/ha
N
/ha
N
(d1.3 over 80 cm) (LANDBECK 1952). It should be pointed out that the oldest beech trees measured in the Carpathian Mountains are not more than 250 years old (KORPEĽ 1995).
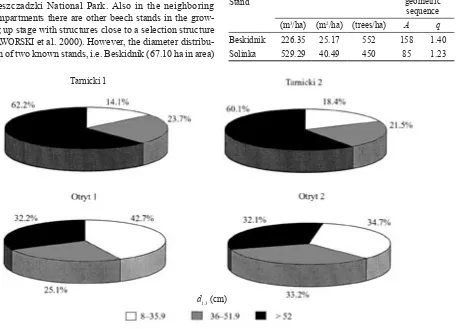
The Tarnicki stand is not the only stand that is in the selection phase of the growing up stage known in the Bieszczadzki National Park. Also in the neighboring compartments there are other beech stands in the grow-ing up stage with structures close to a selection structure (JAWORSKI et al. 2000). However, the diameter distribu-tion of two known stands, i.e. Beskidnik (67.10 ha in area)
[image:5.595.79.504.58.307.2]and Solinka (25.63 ha), does not agree (according to the chi-square test) with the Liocourt and Meyer distributions, as shown by the following comparison:
Fig. 2. Percentage of the number of trees in three diameter classes
Fig. 3. Percentage of tree volume in three diameter classes
Stand V G N
Parameters of Liocourt geometric
sequence (m3/ha) (m2/ha) (trees/ha) A q
Beskidnik 226.35 25.17 552 158 1.40
Solinka 529.29 40.49 450 85 1.23
Tarnicki 2
Tarnicki 1
[image:5.595.76.532.410.739.2]The selection phase of a primeval forest is associated with the growing up and break-up stages (KORPEĽ 1995). The stands present in Tarnicki 1 and 2 plots are in the selection phase of the growing up stage because of the domination of trees of the growing up generation, the small number of trees of the old age generation (A) (Fig. 5) and volume per hectare (Table 1). The selection phase lasts for about 30 years, i.e. one-tenth of the entire
cycle (KORPEĽ, SANIGA 1993), which in beech forests is about 230–250 years (KORPEĽ 1995). As a result of subsequent development a diversified storied structure begins to disappear (KORPEĽ 1995).
In the primeval forests of the Eastern Carpathians the growing up stage develops under a wide range of stand volume per hectare (see the comparison on the next page), and this volume is often larger than the volume in the optimum stage.
It may be expected that the diversified structure in the Otryt stand will be maintained thanks to selection cuttings presently being carried out. The lack of data concerning the tree increment, rate of tree mortality (Tarnicki 1 and 2, Otryt 1 and 2), and also the extent of cutting (Otryt 1 and 2) does not allow to determine whether the permanent maintenance of a complex structure of these stands is possible. It is possible that in order to reach this goal it may be necessary to lower stand volume per hectare (mainly it concerns the Tarnicki 1 and 2 plots).
Since site conditions are similar, the stands investigated during this study may be compared to selection beech forests in Slovakia (SANIGA 1998 a,b; SANIGA, SZANYI 1998) (Table 5, Fig. 6).
The stand in the Otryt 1 plot and stands in Slovakia (Zvolen and Čergovska Mts. – SANIGA 1988a,b) are characterized by the same theoretical diameter distribution curve (Fig. 6). Such a curve in the stand in the Otryt 2 plot indicates a smaller number of trees in small and medium size gradations than is present in selection forests of Slovakia (Zvolen and Čergovska Mts.), but a larger number than in Keula (GROSSMAN 1959) (Fig. 6). The diameter distribution curves for stands in the Tarnicki 1 and Tarnicki 2 plots are very similar (Fig. 6, Table 5). However, these distributions are flatter than in selection stands of Langula (GEROLD, BIEHL 1992) and Nižna Jablonka (Slovakia) (SANIGA, SZANYI 1998) (Fig. 6). It should be pointed out that in the case of the Langula stand the authors gave parameters of Meyer distribution (k = 160,
a = 0.055) which are replaced in the graph by the parameters q and A of the Liocourt sequence.
[image:6.595.59.343.56.642.2]The maintenance of the structure characteristic of a selection forest requires, among other things, the continuity of the regeneration process. In the stands under study of the Bieszczady Mountains the number of the advanced undergrowth (d1.3 6–7.9 cm) from which the recruitment to the lower stand story takes place was 44 and 124 trees per hectare (Tarnicki 1 and 2), and
Fig. 4. Distribution of tree height
Tarnicki 1 0 20 40 60 80 100 120
3 5 7 9 11 13 15 17 19 21 23 25 27 29 31 33 35 37 39 H (m) (N/ha) Tarnicki 2 0 20 40 60 80 100 120
3 5 7 9 11 13 15 17 19 21 23 25 27 29 31 33 35 37 39 H (m) (N/ha) Otryt 1 0 20 40 60 80 100 120
3 5 7 9 11 13 15 17 19 21 23 25 27 29 31 33 35 37 39 H (m) (N/ha) Otryt 2 0 20 40 60 80 100 120
40 and 165 trees per hectare (Otryt 1 and 2) (Tables 1 and 6).
It is worth pointing out that the number of advanced undergrowth does not show the expected relationship with stand volume. This suggests that volume, even when site conditions are comparable, may only be one of many fac-tors affecting the amount of regeneration.
SCHÜTZ (1989), quoting the results of DUC, reported that in order to secure recruitment in fir selection forests there should be 160–350 trees, 4–8 cm in d1.3, per hectare in the undergrowth. Data concerning beech undergrowth may be found in the paper of SANIGA and SZANYI (1998). There the number of trees (d1.3 2–7 cm) in the undergrowth was 156 per hectare. It may therefore be assumed that the number of trees in the advanced undergrowth is satisfactory in the Tarnicki 1 and Otryt 1 plots (Table 6), while in the Tarnicki 2 and Otryt 2 plots it is too small.
SCHÜTZ (2001) stressed that a satisfactory number of trees in the regeneration and the lower stand layer is a basic problem in beech selection forests. Moreover, these trees should be of good vitality and growth, which guarantees their constant transfer to higher size gradations. He also concluded that at a stand volume above 300 m3/ha and basal area above 27 m2/ha these requirements were impossible to fulfill. These values are considerably higher in the Tarnicki stands 1 and 2 (Table 1).
Stand Volume
(m3/ha) Stage and phase Author Stužica 564 growing up stage KORPEĽ (1995) Stužica* 710 selection phase
Vihorlat 400-600 optimal stage REH (1993)
Popričny 700 REH (1993)
Havešová 720 KORPEĽ (1989)
[image:7.595.306.533.83.256.2]*Fir participation 20%
Table 3. Mean age of beech trees in the Tarnicki 1 and Otryt 1 plots (1998 data)
Plot Class of development generation* Age at ground level (years)
Tarnicki 1
C1 70
C2 20
B1 110
A2 150–160
Otryt 1
C1 50
C2 50
B2 80–90
[image:7.595.64.532.424.740.2]*Development classes of trees: Vitality: A – generation of old age 1 – luxuriant B – generation of optimal growth 2 – normal C – generation of growing up 3 – weakened
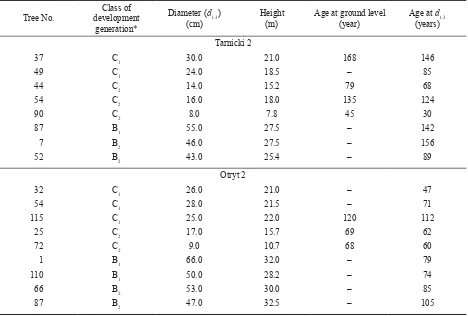
Table 4. Age of beech trees in the Tarnicki 2 and Otryt 2 plots (2002 data)
Tree No. development Class of generation*
Diameter (d1.3)
(cm) Height (m) Age at ground level (year) Age at (years)d1.3 Tarnicki 2
37 C1 30.0 21.0 168 146
49 C1 24.0 18.5 – 85
44 C2 14.0 15.2 79 68
54 C2 16.0 18.0 135 124
90 C2 8.0 7.8 45 30
87 B1 55.0 27.5 – 142
7 B2 46.0 27.5 – 156
52 B2 43.0 25.4 – 89
Otryt 2
32 C1 26.0 21.0 – 47
54 C1 28.0 21.5 – 71
115 C1 25.0 22.0 120 112
25 C2 17.0 15.7 69 62
72 C2 9.0 10.7 68 60
1 B1 66.0 32.0 – 79
110 B1 50.0 28.2 – 74
66 B2 53.0 30.0 – 85
87 B2 47.0 32.5 – 105
However, constant transfer of trees into the higher sto-ries is indicated in these stands by satisfactory vitality of beech trees in the lower layer (generation C) and in the undergrowth (D) (Fig. 5, Table 6).
In selection forests the continuity of processes of re-generation and tree transfer to higher height classes is associated, among others, with the optimal stand volume
per hectare (Der optimale Gleichgewichtsvorrat). There is a question of how the volumes of the four investigated plots compare with the volume of beech selection forests assumed to be the optimal.
[image:8.595.113.462.57.324.2]According to SCHÜTZ (1992), who quoted Schaffer, a stand volume below 250 m3/ha is required in order to keep the rule of the biological automation of production
[image:8.595.64.535.480.590.2]Fig. 5. Percentage of trees in individual classes of Rehak’s development generations
Table 5. Parameters of the Meyer distribution and Liocourt sequence of investigated sample plots
Sample plot
Meyer function Liocourt sequence
a k A qR
Tarnicki 1 0.0490 103 63 0.8222 1.22
Tarnicki 2 0.0420 93 61 0.8454 1.18
Otryt 1 0.0848 383 164 0.7123 1.40
Otryt 2 0.0664 229 118 0.7667 1.30
Table 6. Characteristics of beech undergrowth in the investigated plots
Plot
Classes of beech undergrowth*
D1 D2 D3 Total
(N/ha) (%) (N/ha) (%) (N/ha) (%) (N/ha) (%)
Tarnicki 1 16 12.9 96 77.4 12 9.7 124 100
Tarnicki 2 – – 28 63.6 16 36.4 44 100
Otryt 1 10 6.0 125 75.8 30 18.2 165 100
Otryt 2 8 20.0 32 80.0 – – 40 100
*D1 – luxuriant undergrowth with increased rate of growth showing tendency to enter the lower stand story, D2 – vital undergrowth but waiting
[image:8.595.59.540.632.731.2](permanent dynamic regeneration and transfer of trees in diameter and height classes). On the basis of studies in Langula GEROLD and BIEHL (1992) also indicated the ne-cessity to maintain a low stand volume (180–240 m3/ha) at poorer sites (Oberhohenleistungklasse 3). For the Langula beech selection forest SCHÜTZ (2001) assumed an opti-mal volume of 220 m3/ha. The Otryt stand has a volume (238 m3/ha) close to the volume cited above, but smaller than that assumed by SANIGA (1998a,b) (260 and 280 m3 per ha). Thus it is similar to a selection forest formed as a result of using the modified selection cutting (SCHÜTZ 1981) aimed at the production of medium size products. The maintenance of such stands requires active promotion of regeneration, higher number of trees in the lowest size gra-dations and distinctly lower stand volume. The Otryt 2 stand has a volume (324 m3/ha) close to the average volume in the Keula stand (280–315 m3/ha), but much lower than in the Keula sample plot 19/20 (410 m3/ha) – DITTMAR (1990).
The stands in the Tarnicki 1 and 2 plots are character-ized by a considerably higher volume (442 and 517 m3 per ha) and large percent of very large diameter trees, and also a relatively small number of trees in the lowest size gradation (Figs. 1 and 2). These characteristics cor- respond to characteristics typical of a forest managed by the classical selection cutting aiming at the production of large diameter products during longer periods of time, which is particularly useful in fir stands (SCHÜTZ 1981). A considerably higher stand volume in the Tarnicki 2 plot (Table 1) may, however, hinder the regeneration process, as indicated by a lack of generation D1 trees (Table 6).
In the Tarnicki 1 and 2 plots the volume per hectare is higher than that assumed by GEROLD and BIEHL (1992) as the optimal volume for beech stands at the best sites (300–360 m3/ha) where trees at the most grow to 32 m in height (Oberhohenleistungklasse 1). According to these authors a selection structure disappears at a stand Fig. 6 0 20 40 60 80 100 120 140 160 180
6 14 22 30 38 46 54 62 70 78 86 94 102 110 118
d1,3 (cm)
(N
/h
a)
1
Otryt 1 164 1,40 Otryt 2 116 1,30 Zvolen 160 1,38 Keula 90 1,3986 Parameters of the Liocourt sequences
A q 0 20 40 60 80 100 120
6 14 22 30 38 46 54 62 70 78 86 94 102 110 118
d1,3 (cm)
(N
/h
a)
Tarnicki 1 63 1,22 Tarnicki 2 61 1,30 Langula 92 1,2452 N. Jablonka 105 1,23 Parameters of the Liocourt sequences A q Tarnicki 1 Tarnicki 2 Langula N. Jablonka Otryt 1 Otryt 2 Zvolen Keula
Parameters of the Liocourt sequences
A q
63 1.22
61 1.30
92 1.2452
105 1.23
Parameters of the Liocourt sequences
A q
164 1.40
116 1.30
160 1.38
90 1.3986 12120 100 80 60 40 20 0 12180 160 140 100 80 60 40 20 0 N /ha N /ha
6 14 22 30 38 46 54 62 70 78 86 94 102 110 118 d1.3 (cm)
[image:9.595.64.427.57.485.2]6 14 22 30 38 46 54 62 70 78 86 94 102 110 118 d1.3 (cm)
volume below 100 m3/ha and above 500 m3/ha. In the Eastern Carpathians (Slovakia) the selection forests with fir (40%) and beech (60%) are in equilibrium at an optimal stand volume of 470–500 m3/ha (SANIGA, SZANYI 1998). Under conditions of the Bieszczady Mountains beech reaches the highest stand quality (JAWORSKI et al. 1991), which made it possible in the primeval forest to form the selection phase in the growing up stage at a relatively high stand volume. Under strict protection, i.e. without human interference in the growth and development of stands, this phase will be maintained for about 30 years (KORPEĽ, SANIGA 1993), and in the next period with an increasing stand volume per hectare the phase of a two-storied structure will begin to form, and probably with time a one-storied structure in the optimum stage. This has been indicated by other fragments of the Tarnicki stand (compartment 260a), and other stands of the primeval beech forests in the Bieszczadzki National Park (JAWORSKI et al. 2002). It may be supposed that in the case of managed forests growing at such rich sites the formation of beech selection forests of about 440 m3/ha per hectare is possible as was indicated by the results of SANIGA and SZANYI (1998) cited above.
The stands, investigated during this study, confirm the suppositions of Mitscherlich (ASSMANN 1961) that there are many states of equilibrium in a selection management system depending the on site and production goal. To determine how close the actual stand volume per hectare is to the optimal one requires control studies and also the determination of the rate of tree transfer within diameter classes.
CONCLUSIONS
This study carried out in beech forests of the Biesz-czady Mountains showed that the selection structure may develop in forests of primeval character (Tarnicki) as well as in managed forests (Otryt).
The managed Otryt stand, characterized by a high number of trees, considerable percent of small diameter trees and small stand volume (238 and 324 m3/ha) may be recommended in the case of production of medium-sized products in forests where protection and recreation func-tions dominate. The Tarnicki 1 stand of primeval charac-ter, characterized by a larger stand volume (442 m3/ha) and a smaller number of trees in the selection phase of the growing up stage, makes it possible to obtain large size products during longer production periods at full mainte-nance of protection functions. The Tarnicki 2 stand shows a selection structure at high volume (517 m3/ha), which probably hindered the regeneration. At the same time the stands in the Tarnicki 1 and 2 sample plots show a possibil-ity of the formation of the selection phase in the growing up stage in forests of primeval character.
References
AMMON W., 1995. Das Plenterprinzip in der Waldwirtschaft. Bern, Verlag Paul Haupt: 172.
ASSMANN E., 1961. Waldertragskunde. München, BLV: 490. BERNADZKI E., 1971. Problem zagospodarowania
drzewosta-nów jodłowych. Sylwan, 130 (8): 19–30.
BERNADZKI E., 1995. Gospodarka leśna w obliczu zmian klimatu. Sylwan, 13 (1): 19–32.
DITTMAR O., 1990. Untersuchungen im Buchen-Plenterwald Keula. Forst u. Holz, 45 (15): 419–423.
FABIJANOWSKI J., JAWORSKI A., 1996. Kierunki postępo-wania hodowlanego w lasach karpackich wobec zmieniających się warunków środowiska. Sylwan, 140 (8): 75–98.
GEROLD D., BIEHL R., 1992. Vergleich zwischen Buchen-plenterwald und Buchenbetriebsklasse. Allg. Forstz., 47 (2): 91–94.
GRANICZNY S., 1971. Niektóre problemy sposobów zagospo-darowania lasu w drzewostanach jodłowych i jodłowo-miesza-nych na Roztoczu w świetle badań. Sylwan, 130 (8): 9–17. GROSSMANN H., 1959. Ergebnisse der im Jahre 1957
durch-geführten Holzvorrats- und Zuwachsinventur im Plenterwald Keula. Arch. Forstw., 8 (6/7): 666–689.
GRUNDNER F., SCHWAPPACH A., 1952. Massentafeln. Berlin, Verlag Paul Parey: 216.
JAWORSKI A., 1979. Charakterystyka hodowlana wybranych drzewostanów z udziałem jodły (Abies alba Mill.) w Karpatach i Sudetach. Acta Agr. et Silv. ser. Silv., 18: 19–60.
JAWORSKI A., SKRZYSZEWSKI J., ŚWIĄTKOWSKI W., KARCZMARSKI J., 1991. Budowa i struktura dolnoreg-lowych drzewostanów o charakterze pierwotnym na wy-branych powierzchniach w Bieszczadach Zachodnich. Zesz. Nauk. AR w Krakowie 254, Leśnictwo, 20: 17–43.
JAWORSKI A., KOŁODZIEJ ZB., OPYD ZB., 2000. Bukowe lasy o charakterze pierwotnym jako model lasów przerę-bowych. Acta Agr. et Silv. ser. Silv., 38: 3–31.
JAWORSKI A., KOŁODZIEJ ZB., PORADA K., 2002. Structure and dynamics of stands of primeval character in selected areas of the Bieszczady National Park. J. For. Sci., 48 (5): 185–201. KORPEĽ Š., 1989. Pralesy Slovenska. Bratislava, Veda: 329. KORPEĽ Š., 1995. Die Urwälder der Westkarpaten. Stuttgart,
Gustav Fischer: 310.
KORPEĽ Š., SANIGA M., 1993. Výberný hospodársky spôsob. Praha, VŠZ a Písek, Matice lesnická: 127.
LANDBECK H., 1952. Über die Buchenplenterwälder in Nord-thüringen. Der Wald, 2 (8): 244–247; (9): 279–282.
MEYER H., 1933. Eine mathematisch-statistische Untersuchung über den Aufbau des Plenterwaldes. Schweiz. Z. Forstwes., 84 (3): 33–46; (4): 88–103, (5): 124–131.
MICHALIK ST., SZARY A., 1997. Zbiorowiska leśne Biesz- czadzkiego Parku Narodowego. Monografie Bieszczadzkie, 1: 1–175.
NOWOSAD M., 1995. Zarys klimatu Bieszczadzkiego Parku Narodowego i jego otuliny w świetle dotychczasowych badań. Roczniki Bieszczadzkie, 4: 163–183.
PRZYBYLSKA K., ZIĘBA ST., 2003. Rezultaty wdrożenia ręb-ni stopręb-niowej udoskonalonej w Leśnym Zakładzie Doświad- czalnym w Krynicy. Sylwan, 147 (2): 20–29.
ŘEHÁK J., 1964. Vývoj stromů a porostních útvarů v přiroze-ných lesích. Ochr. Přír., 19 (7): 105–113.
RUTKOWSKI B.,1968. Rozkład pierśnic według krzywej frekwencji Liocourta i Meyera. Zesz. Nauk. WSR w Krakowie, 38, Leśnictwo, 3: 1–19.
SANIGA M.,1998a. Optimalizácia štruktúry a regeneračných procesov bukového výberkového lesa. Zvolen, Acta Fac. For., 40: 17–27.
SANIGA M., 1998b. Štruktúra a regeneračné procesy bukového výberkového lesa. Lesnictví, 44 (6): 241–249.
SANIGA M., SZANYI O., 1998. Modely výberkových lesov vo vybraných lesných typoch a geografických celkoch Slovenska. Ved. Štúd., Zvolen, Technická Univerzita, 4/A: 1–50. SCHÜTZ J. PH., 1981. Que peut apporter le jardinage a notre
sylviculture. Schweiz. Z. Forstwes., 132 (4): 219–241.
SCHÜTZ J. PH., 1989. Der Plenterbetrieb. Zürich, ETH: 54. SCHÜTZ J. PH., 1992. Die Waldbauliche Formen und die
Gren-zen der Plenterung mit Laubbaumarten. Schweiz. Z. Forstwes., 143 (6): 442–460.
SCHÜTZ J. PH., 2001. Der Plenterwald. Berlin, Parey Buch-verlag: 207.
TRAMPLER T., MĄKOSA K., GIRŻDA A., BĄKOWSKI J., DMYTERKO E., 1990. Siedliskowe podstawy hodowli lasu. Warszawa, PWRiL: 197.
ZARZYCKI K., 1963. Lasy Bieszczadów Zachodnich. Acta Agr. et. Silv. ser. Silv., 3: 3–132.
Received for publication March 10, 2004 Accepted after corrections May 18, 2004
Bukové lesy se strukturou výběrného lesa v pohoří Bieszczady (jihovýchodní Polsko)
A. JAWORSKI, Z. KOŁODZIEJ
Faculty of Forestry, Department of Silviculture, Agricultural University, Cracow, Poland
ABSTRAKT: Příspěvek pojednává o porostních charakteristikách dvou bukových (Fagus sylvatica L.) porostů. První, nazývaný Tarnicki, nacházející se v Národním parku Bieszczady, představuje stadium dorůstání v porostu s výběrnou strukturou a prale-sovitým charakterem. Druhý porost se jmenuje Otryt. Nachází se v hospodářském lese na Lesní správě Lutowiska. V každém z porostů byly založeny dvě zkusné plochy. Rozdělení četností stromů na zkusných plochách odpovídá Liocourtovu pořadí a Meyerově křivce. Oba porosty jsou charakteristické strukturou mnoha generací. Porost Otryt se zásobami zkusných ploch 238 a 324 m3/ha byl charakteristický nedostatkem silných stromů a vysokým procentem nejtenčích jedinců, zatímco porost Tarnicki se zásobami zkusných ploch 442 a 517 m3/ha byl charakteristický zastoupením silných (d
1,3 ≥ 72 cm) stromů. Výběrná fáze porostu Tarnicki má dočasný charakter, protože zde vzhledem k přírodním procesům může dojít k vytvoření dvouetážové a později ve stadiu optima jednoetážové struktury. V porostu Otryt reprezentujícím hospodářský les lze udržení výběrné struktury očekávat vzhledem k aplikaci výběrné seče. Z toho tedy vyplývá, že v podobně strukturovaných obhospodařovaných porostech je možné pokračovat s aplikací výběrné seče, zvláště v ochranné zóně obklopující Bieszczadský národní park.
Klíčová slova: výběrný les; prales; vývojová stadia; Liocourtovo a Mayerovo rozdělení
Cílem práce je zjistit, jaké jsou porostní charak-teristiky bukových lesů pralesovitého charakteru ve výběrné fázi stadia dorůstání (porost Tarnicki, oddělení 260a – dvě zkusné plochy) a hospodářských bukových lesů s mnohovrstevnou strukturou (Otryt – dvě zkusné plochy). Dále pak určit, zda porosty s touto strukturou mohou sloužit jako model k užití výběrné seče v bu-kových lesích jihovýchodního Polska. Porost Otryt se zásobami zkusných ploch 238 a 324 m3/ha byl charak-teristický nedostatkem silných stromů (d1,3 < 52 cm) a vysokým procentem nejtenčích jedinců (8,0–15,9 cm), zatímco v porostu Tarnicki se zásobami zkusných ploch 442 a 517 m3/ha byl počet slabých stromů výrazně menší a procento silných stromů zase vyšší. Sledované porosty
jsou charakteristické diverzifikovanou víceetážovou struk-turou a různověkou strukstruk-turou zastoupenou na malém území (Tarnicki 20–170 let, Otryt 50–120 let). Tyto porosty jsou zřetelně rozdílné s ohledem na rozdělení počtu stromů a zásoby v jednotlivých tloušťkových a výškových třídách. Výsledky testu chí-kvadrát ukázaly, že skutečné (empirické) rozdělení počtu stromů na sledovaných plo-chách odpovídají v obou porostech teoretickému Liocour-tovu a Meyerovu rozdělení (α = 0,05).
Analýza vitality a růstové tendence obnovy a ovšem i stromů v nižších i vyšších stromových etážích ukázala trvalý přesun stromů do vyšších porostních vrstev.
diverzifikovaná struktura. Naopak u obhospodařovaného porostu Otryt je možné očekávat udržení dosavadní struktury vzhledem k současné aplikaci výběrné seče. Lze
předpokládat, že obhospodařované porosty s podobnými porostními charakteristikami umožňují použití výběrné seče.
Corresponding author:
Dr. ZBIGNIEW KOŁODZIEJ, Agricultural University, Faculty of Forestry, Department of Silviculture, Al. 29 Listopada 46, 31 425 Cracow, Poland