JOURNAL OF FOREST SCIENCE, 53, 2007 (12): 529–537
In forestry, ecology and nature protection there often exists a task when it is necessary to completely evaluate the qualitative attributes of the forest eco-system or its smaller parts – forest stands, biotopes and the like. It can be related to site quality, biologi-cal diversity, ecologibiologi-cal stability, threat of injurious agents, management condition and so on. Currently, it is an especially crucial topic in the NATURA 2000 Project, where so-called Favourable Conservation Status (FCS) of forest biotopes of European and na-tional significance is evaluated. In general, the unit of evaluation (of forest stand, biotope) is assigned to the corresponding qualitative category in accordance with in-advance defined criteria and indicators, for example in forest biotopes into 4 classes: A – excel-lent status, B – good status, C – disturbed status, D – inconvenient status. This evaluation is simple and clear. It becomes problematic when it is nec-essary to express the status of evaluated unit in a complex way with regard to all evaluated criteria and indicators or when it is necessary to assess the global status of a larger number of units and to aggregate the evaluation to higher hierarchical levels – locali-ties, regions and to the national level and/or to the
European Community. The situation is becoming much more complicated when the evaluated units are of different size (area) and when the used evalu-ation criteria and indicators have different weights (significance, importance). Categories A, B, C, D are typical qualitative variables to which common numerical operations are not applicable (from bio-metric characteristics only the mode can be used – the category of the highest abundance).
Quantification can be the initial solution – so the numerical formulation of this qualitative evaluation. Four solution methods are introduced in the present paper. More options are taken into consideration to judge these methods and to select the most suitable – without weights and with weights and with the assigning of different numerical values to qualita-tive categories A, B, C, D. All of them are verified on model examples with the application to the system of evaluation of forest biotopes within the NATURA 2000 Project. Computer software for the automated processing of evaluation results is a part of the so-lution. The programme is designed in the DELPHI environment and the authors will provide it to inter-ested persons free of charge by request.
Evaluation of qualitative attributes of forest ecosystems
by means of numerical quantifiers
Š. Šmelko, M. Fabrika
Ecological and Forestry Research Agency – EFRA, Zvolen, Slovak Republic
ABSTRACT: This paper presents a proposal of four variants of quantifiers for the numerical expression of qualitative attributes of forest ecosystems, for example site, naturalness, biodiversity, ecological stability, threat of injurious agents, status of forest biotopes of European significance in the NATURA 2000 network and so on. Quantifiers enable to completely characterise the whole set of these qualitative attributes of the ecosystem by one number which directly indicates the relative approximation of the ecosystem (in %) to the required most favourable status. They have more advantages: different numerical operations can be done with them, it is possible to aggregate evaluated units of the ecosystem to larger entities, to determine average value, variability and confidence limits of the final evaluation and to compare resulting statuses mutually or very objectively on the principle of biometric monitoring in a longer time. The construction of quantifiers is opened and it arbitrarily enables to choose input parameters at need (numerical quantifications of ecosystem quality statuses and weights of their criteria and indicators) and to search for optimal solutions. The reaction of quantifiers to different input situations is analysed on model examples and suggestions for their introduction into practice are presented. Special PC software was elaborated for the automated calculation of quantifiers.
METHODS
Model example of the initial solution for the evaluation of forest biotope
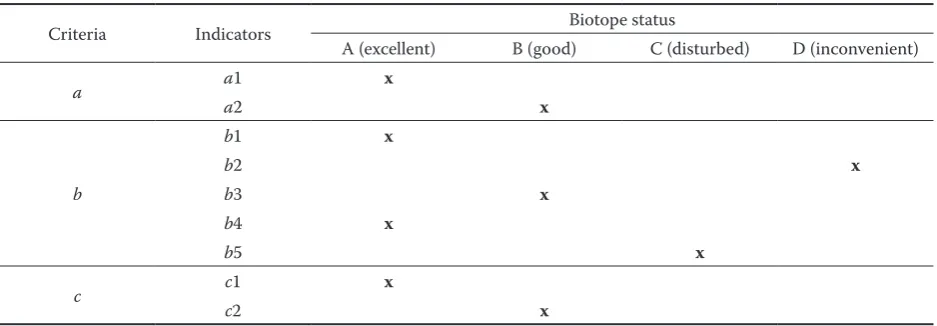
The problem will be explained and gradually solved on a common model example. This is a concern of the forest biotope within which three criteria were evaluated – tree species composition (a), inside structure (b) and negative influences which affect it (c) and within them other specific indicators (ai, bi, ci). The biotope was assigned to the corresponding categories of favourable status A, B, C, D in accordance with that. Results are shown in Table 1. As you can see, for a given forest biotope, 9 different evaluations of its FCS arose: (A, B), (A, D, B, A, C), (A, B). Excellent status A was assigned to its tree species composition, age structure, oc-currence of rough and extra valuable trees and health condition. On the contrary, from the aspect of the occurrence of rough deadwood its status is bad C and from the aspect of natural regeneration it is almost inconvenient D. Now the task is to integrate this relatively heterogeneous evaluation of individual FCS into the final assessment which would allow to completely judge the total status of the biotope and consequently to compare it either to statuses of the same biotope in a long-term pe-riod or to other biotopes.
Different methods of quantification of forest biotope qualitative status
The task formulated in the previous section can be solved by several methods. We are considering two
basic approaches and more variants within them. Each of the variants has different attributes, advan-tages and disadvanadvan-tages. It can differently sensitively react to the characteristics of evaluated biotope in different situations and thus provide different results. That is why we will apply the considered variants, except for the example in Table 1, to other model biotopes; obtained results will be mutually compared and conclusions for their practical us-ability will be derived.
Average point value (mark) of biotope status
By this variant the point value (mark) Z = 1 – 2 – 3 – 4 will be assigned to qualitative categories A, B, C, D and relative weights wi willbe given to criteria a, b, c and another proportions of these weights wij, e.g. according to Table 2a, will be given to indicators ai, bi, ci within the criteria. Not only marks Zi and weights wi, wijbut also their multiples Zi × wiand Zij ×wij for all the possible combinations are intro-duced in this table because of the clearness and easiness of calculations. Of course the choice of marks and weights can be different, but it depends on mutual proportions between them and on the simplicity of their use. The resulting average mark will be calculated from the concrete evaluation of criteria a, b, c of the A, C, B biotope, for example as an arithmetic mean of assigned points
– either simple (without weights) n
ZS =
Σ
Zi/n, for A = 4, C = 2, B = 3 →i=1
[image:2.595.64.533.545.708.2]ZS = (4 + 2 +3)/3 = 3.0 (1)
Table 1. A scheme of criteria and indicators for assigning the biotope to the category A, B, C, D in accordance with its status, taken over from the NATURA 2000 SK Project (Schwarz et al. 2005) (x – example of a concrete evaluation)
Criteria Indicators Biotope status
A (excellent) B (good) C (disturbed) D (inconvenient)
a a1 x
a2 x
b
b1 x
b2 x
b3 x
b4 x
b5 x
c c1 x
c2 x
For Table 1 to 3:
– or weighted (with regard to chosen weights) n
ZW =
Σ
wiZi, for A = 4, C = 2, B = 3 i=1and weights 0.45– 0.35 – 0.20 →
Zv = (0.45 × 4 + 0.35 × 2 + 0.2 × 3) = 3.1 (2) Average marks Z for the evaluation of indicators ai, bi, ciwould be calculated in a similar way, the result would be Zs = 3.1 and Zw = 3.4.
In accordance with the calculated mean Z from single marks of individual criteria and indicators it is backwardly possible to assign the total qualitative category (FCS) to the whole biotope, e.g. by linear interpolation of the possible scale of the best (4) and the worst (1) evaluation in this way: A (4.0 – 3.25), B (3.25 – 2.5), C (2.5 – 1.75), D (1.75 – 1.0).
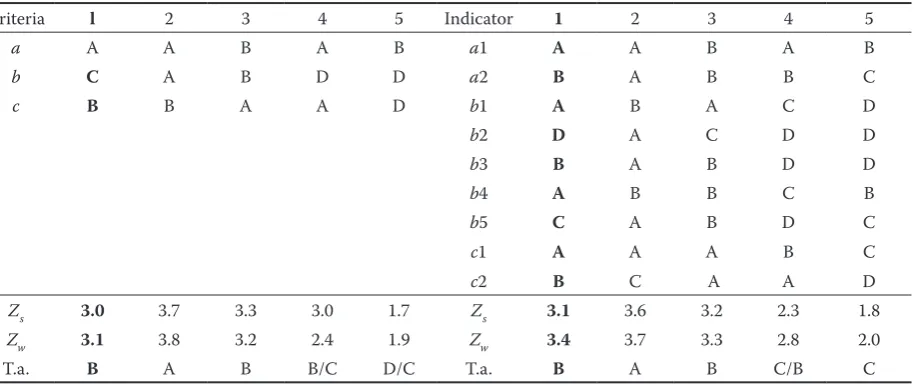
In Table 2b, this quantification is also carried out for another 4 model examples which have very different input characteristics. An approach to the solution is double – rougher and more detailed: in
the left half of the table the person charged with evaluation evaluates criteria a, b, c as a part together, in the right half of the table the person charged with evaluation also records separately his/her evaluation for the individual indicators ai, bi, ci. The following generalisations can be derived from presented dem-onstrations:
– Point evaluation of the biotope status is very sim-ple, logically easy to understand;
– Average mark Z schematically embodies the bio-tope quality, the nearer to 4.0, the more favourable the status of the biotope is;
– In general, the weighted mean provides better characterisation of the real biotope status; – Individual point values 4, 3, 2, 1 are graded in
[image:3.595.75.533.293.486.2]the same intervals, they suppose that the biotope status B, C, D is 2-times, 3-times, 4-times worse than the status A, which does not corresponds fairly well to the biological matter of these cate-gories;
Table 2. Evaluation of the biotope status by the method of average point value (mark)
a) Assigned point values (Zij) for the categories of biotope status A, B, C, D and weights (wij) for criteria a, b, c and indicators ai, bi, ci (x – concrete evaluation of model example 1)
Criteria (weights)
A B C D Indicator
(weights)
A B C D
Z = 4 Z = 3 Z = 2 Z = 1 Z = 4 Z = 3 Z = 2 Z = 1
a = 0.45 1.8 1.35 0.9 0.45 a1 = 0.30 1.2 0.90 0.6 0.30
a2 = 0.15 0.6 0.45 0.3 0.15
b = 0.35 1.4 1.05 0.7 0.35
b1 = 0.10 0.4 0.30 0.2 0.10
b2 = 0.05 0.2 0.15 0.1 0.05
b3 = 0.10 0.4 0.30 0.2 0.10
b4 = 0.05 0.2 0.15 0.1 0.05
b5 = 0.05 0.2 0.15 0.1 0.05
c = 0.20 0.8 0.60 0.4 0.20 c1 = 0.10 0.4 0.30 0.2 0.10
c2 = 0.10 0.4 0.30 0.2 0.10
b) Examples of evaluation 1–5: Zs – simple mean (without weights), Zw – weighted mean (with weights)
Criteria l 2 3 4 5 Indicator 1 2 3 4 5
a A A B A B a1 A A B A B
b C A B D D a2 B A B B C
c B B A A D b1 A B A C D
b2 D A C D D
b3 B A B D D
b4 A B B C B
b5 C A B D C
c1 A A A B C
c2 B C A A D
Zs 3.0 3.7 3.3 3.0 1.7 Zs 3.1 3.6 3.2 2.3 1.8
Zw 3.1 3.8 3.2 2.4 1.9 Zw 3.4 3.7 3.3 2.8 2.0
– Worse evaluation C, D will not be expressed strongly enough in the resulting mark, not even by the occurrence of two criteria and/or five indica-tors with the evaluation of D, an average mark is ca 2.0, so the total status of the biotope is evaluated as “disturbed”, not as “inconvenient”;
– Thus the method is applicable only for approxi-mate, orientation quantification of the biotope total status.
Quantifier expressing the relative approximation of the biotope status to the required optimum
By this variant, appropriate quantifiers Qij, e.g. according to Table 3a, will be assigned to all the possible combinations of criteria and indicators ai,
[image:4.595.63.530.101.272.2] [image:4.595.64.532.307.509.2]bi, ci with grades of biotope quality A, B, C, D. Ap-plied quantifiers originated from the assigned values 1.0 – 0.8 – 0.5 and minus 1.0 (they express the relative approximation of the biotope to the favourable status relatively well at 100 – 80 – 50% and very badly – at minus 100%) to qualitative categories A – B – C – D, relative weights 0.45 – 0.35 – 0.20 were assigned to criteria a – b – c and to indicators within the criteria further proportions of these weights, similarly like in Table 2a with regard to different significance of these attributes. Of course, other different combinations are also possible. They are purposely chosen to have a sufficient “distance” from each other in a model case when their influence on the final evaluation result will be better shown. Three different methods Table 3. Resultant (aggregated) evaluation of the biotope status by the method of numerical quantifiers Q
a) Assigned quantifiers Qijfor A, B, C, Dbiotope qualitative statuses and wijweights for evaluation criteria a, b, c and for indicators ai,.bi, ci(x – evaluation of example 1)
Criterion and its
weights (wi) Indicator and its weights (wij)
Biotope status and its quantifiers Qj
A B C D
Q = 1.0 Q = 0.8 Q = 0.5 Q = –1.0
a = 0.45 a1 = 0.30 0.30 0.24 0.150 –0.30
a2 = 0.15 0.15 0.12 0.075 –0.15
b = 0.35
b1 = 0.10 0.10 0.08 0.050 –0.10
b2 = 0.05 0.05 0.04 0.025 –0.05
b3 = 0.10 0.10 0.08 0.050 –0.10
b4 = 0.05 0.05 0.04 0.025 –0.05
b5 = 0.05 0.05 0.04 0.025 –0.05
c = 0.20 c1 = 0.10 0.10 0.08 0.050 –0.10
c2 = 0.10 0.10 0.08 0.050 –0.10
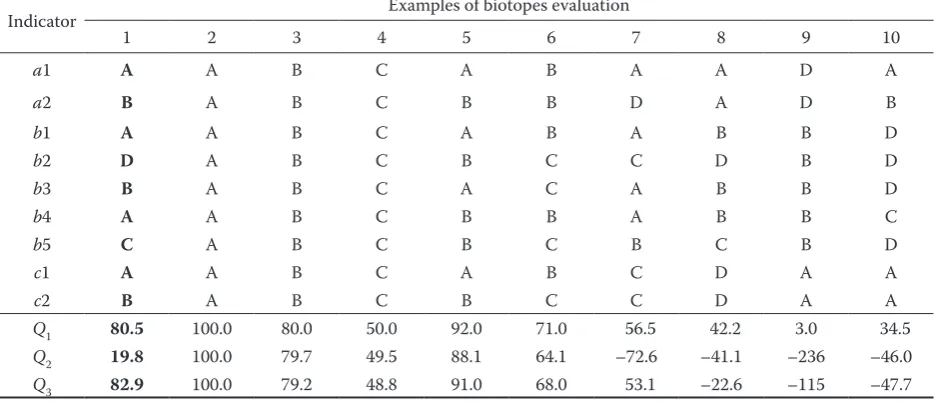
b) Examples of evaluation 1–10: quantifiers Q1, Q2and Q3
Indicator Examples of biotopes evaluation
1 2 3 4 5 6 7 8 9 10
a1 A A B C A B A A D A
a2 B A B C B B D A D B
b1 A A B C A B A B B D
b2 D A B C B C C D B D
b3 B A B C A C A B B D
b4 A A B C B B A B B C
b5 C A B C B C B C B D
c1 A A B C A B C D A A
c2 B A B C B C C D A A
Q1 80.5 100.0 80.0 50.0 92.0 71.0 56.5 42.2 3.0 34.5
Q2 19.8 100.0 79.7 49.5 88.1 64.1 –72.6 –41.1 –236 –46.0
Q3 82.9 100.0 79.2 48.8 91.0 68.0 53.1 –22.6 –115 –47.7
Q1 – determined by simple sum of Qij (the operator OR)
Q2 – determined by EMDS method fromQijof all 9 indicators (the operator AND)
of the final quantifier derivation were tested for own quantification of the biotope status using the princi-ple of the knowledge system NetWeaver (Reynolds 1999), which is a part of the EMDS system (EMDS –Ecomanagement Decision Support System) for the support of the decision-making process in ecological management. Results for a model biotope and anoth-er 9 various examples are summarised in Table 3b. Quantifier Q1
It is defined as a simple sum of Qij quantifiers as-signed to individual indicators in categories A, B, C, D. The operator OR, the logical sum is applied, thus an assumption about mutual independence of indicators. The result is expressed in %:
n
Q1 = 100 ×
Σ
Qij, for example 1 →Q1 =i=1
= 100 × (0.30 + 0.12 +...+ 0.08) = 80.5% (3) Quantifier Q2
It is derived from allQij quantifiers for criteria and indicators together on the principle of the EMDS (Reynolds 1999) system. The operator AND is used, thus an assumption about mutual dependence of indicators and the result is expressed in % of the maximal possible value of the best biotope status Q2(max), i.e. of the status where all criteria and in-dicators are evaluated by A:
min(Qij) + [AVG(Qij) – min(Qij)] × [min(Qij) + 1]/2
Q2 = ––––––––––––––––––––––––––––––––––––––× 100 (4) Q2 (max)
0.3 + 0.15 + ... + 0.1
Q2(max) = 0.05 +
[
––––––––––––––––– – 0.05]
× 9× [0.05 + 1]/2 = 0.0821 (5)
We will obtain this equation for example 1 0.3 + 0.12 + ... + 0.08
Q2 = (–0.05 +
[
–––––––––––––––––– – (–0.05)]
× 9× [–0.05+ 1]/2)/Q2(max) × 100 →
0.0162
→ Q2 = ––––––– × 100 = 19.8% (6)
0.0821
Quantifier Q3
It is also determined on the principle of EMDS (Reynolds 1999), but combined – from the sum of Qij quantifiers within criteria a, b, c.The same formula as for Q2 will be used, but only with a difference that the values of quantifiers assigned to indicators (a1,
a2), (b1, b2, b3, b4, b5) and (c1, c2) will be summed within the criteria at first and the resultant sums will be considered as the formula. These facts are the rea-son: mutual dependence of attributes is not assumed within the individual criteria – e.g. the structure of the biotope can be relatively good if one of the condi-tions a1, a2 is satisfied at least, e.g. all required tree species occur, but the herb cover is not sufficient, partial quantifiers can be summed (the operator OR is applied). On the other hand, much higher condi-tionality exists between criteria a, b, c – the biotope cannot maintain the favourable status if it does not meet for example the criterion of tree species com-position (a) although it excellently meets the other criteria (b, c), that is why the operator AND has to be applied for the aggregation of the evaluation. The boundary value Q3 will also be naturally changed af-ter this modification as follows: for the best case (all evaluations of A) will be Q3 (max) = +0.280.
We will obtain this equation for our model example 1: sums Qa = 0.2 + 0.04 + 0.04 = 0.28
Qb = 0.4 + 0.05 = 0.45
Qc = 0.04 + 0.05 + 0.05 = 0.14 (7) 0.28 + 0.45 + 0.14
Q3 = 0.14 +
[
––––––––––––––– – 0.14]
× [0.14 + 1]/2 = 3= (0.255/0.280) × 100 = 80.5% (8) If we compare the results in Table 3b, we can state that:
– Of all three quantifiers the quantifier Q3 seems to be the most suitable from the material and logical aspect, it best represents the real biotope status, sufficiently sensitively reacts to worse evaluation (C, D) and combination of the operators OR and AND, well considers the mutual relation (condi-tionality) of evaluation criteria and indicators; quantifier Q1 can serve as the orientation one, Q2 is not applicable;
– By its value Q3 expresses the direct rate of approxi-mation of the evaluated biotope status to the most favourable status = 100%;
– Q values are quantitative variables and therefore it is possible to execute all numerical operations, e.g. to determine the average value as a character-istic of the total biotope quality level, variability of individual Qi values from forest spatial units on a local level, on the level of the biotope and the whole country, and also the rate of accuracy of the obtained result;
Q3 > 90% → A, Q3 = 90–70% → B, Q3 = 70–49% → C,
Q3 < 49% → D
Q3 calculation can also be well handled on a hand-held calculator and automated on a PC.
Software for automated calculation of numerical quantifiers
The main motivation for software elaboration was a difficult calculation chiefly by using the Q2 and Q3 quantifiers. Quantifiers utilise the operator AND calculated by so-called minimum-biased weighted average, which is complicated for the use of a hand-held calculator. The automation of calculation is primarily required:
– when searching for an optimal number of criteria and their indicators for the evaluation of forest biotope status, determination of their weights and marks for individual qualitative statuses,
[image:6.595.66.521.316.744.2]– by the single routine calculation of quantifiers with-in the process of the evaluation of forest biotopes. The software was designed in the DELPHI pro-gramming environment. The program is intended for operation systems of the type Windows 95, 98, 2000, NT, Millennium and XP. Its architecture is built on a single library of algorithms for the calcula-tion of Q1, Q2 and Q3 quantifiers. The encapsulation of algorithms to a single object secures its simple incorporation into the wider host information sys-tem, eventually its implementation to hand-held field computers (so-called Handheld PC). The user operating environment was designed in the form of extension over objects except for the single library of objects. The user operating environment ena-bles comfortable work by determination of criteria, indicators and their weights, by determination of evaluation marks for qualitative statuses and also by single calculation of forest biotope status on the basis
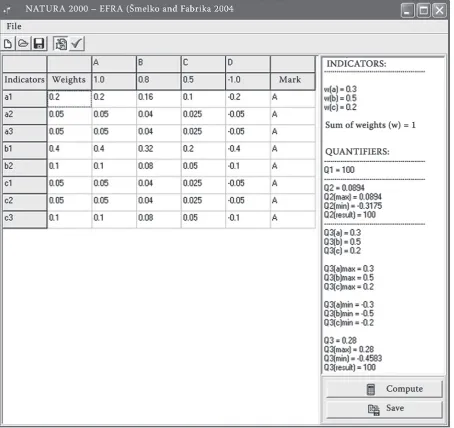
of marks for individual indicators. The menu of the software is presented in Fig. 1. The software consists of file menu, toolbar, table part and calculation part.
The table part contains a table in the form known from MS Excel program. The first column contains individual indicators. The second column contains their weights. Another column contains weights for qualitative statuses (A, B, …) and the last one con-tains assigned mark to specified indicator. The table can be switched to two modes. Modes are switchable by buttons placed on the toolbar:
Edit mode: it enables to change the values of weights (w) for individual indicators. Weights are changed by clicking on a corresponding weight box and by editing from the computer keyboard. It is not possible to change converted weights for individual qualitative statuses, because they are automatically changing within the process of calculation in accord-ance with determined algorithms.
Selection mode: it enables to assign statuses (marks) for individual indicators. The cursor is changed into a “hand with finger”. Its mark will be given by clicking the cursor on the indicator row and on the column of corresponding mark and it will be displayed in the last column.
The calculation part contains a review window with results. The help of Calculate button on its bot-tom part updates the window. It is possible to save the window content into the text file on disc by help of Save button on its bottom part. At first, it is necessary to define a name and a path for the text file by Win-dows system dialog. The window contains the follow-ing information from the calculation of quantifiers: – Weights w for individual criteria and total control
sum of weights (it should contain the value of 1), – Total quantifier Q1,
– Quantifier Q2, its maximal value as well as the resulting value expressed relatively in terms of percentage from the maximum,
– Quantifier Q3 and the resulting values for indi-vidual criteria, maximal values for indiindi-vidual criteria, total quantifier for the whole biotope, maximal value for the total quantifier and total value of the total quantifier expressed relatively in terms of percentage from the maximum. The content of the table part for the entry of indica-tor weights and marks is flexible and changeable by help of submenu of the main menu File or by help of equivalent buttons on the toolbar:
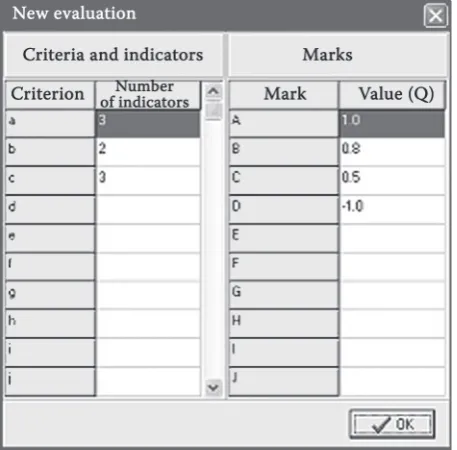
New: the button (submenu of the File menu) ena-bles to enter a new evaluation. The following window menu will be displayed after its start (Fig. 2). It is possible to specify the number of indicators for in-dividual criteria in the window in Fig. 2. It is possible
to enter 24 criteria. Small letters of the alphabet (a to z) designate criteria. Criteria which have defined the number of indicators are accepted. In the window it is also possible to specify the number of qualitative grades for the evaluation of biotope status indicator as well as their relative marks (e.g. from –1.0 to +1.0). It is possible to enter 10 qualitative grades. Capital letters of the alphabet (A to J) designate grades. The scale of entered mark is arbitrary, but with regard to the character of algorithms for quantifier calculation the scale from –1.0 to +1.0 is recommended.
Open: the button (submenu of the File menu) ena-bles to open the existing evaluation table from an external file. It is necessary to specify the name and the path to the file on disc by the dialog of Windows operating system.
Save: the button (submenu of the File menu) ena-bles to save the current evaluation table on disc. It is necessary to specify the name and the path to the file on disc by the dialog of Windows operating system after its use.
DiSCuSSiOn
[image:7.595.305.534.57.282.2]expressed the average quality and its variability in the stand (e.g. 2.26 ± 0.65). A similar procedure was used in the second case – by the monitoring of the forest health condition when more authors (Heško et al. 1989; Palát et al. 1994) tried to express the tree composition in the known defoliation classes of tree crowns 0, 1, 2, 3, 4 (to 10%, 11–25%, 26–60%, 61–99%, 100%) by one common number, they used the average as an indicator, from these numerically marked classes, which was weighted with their rela-tive frequencies. Both solutions are very similar to our variant of determination of so-called average mark, and that is why they have basically the same characteristics and also shortcomings as we men-tioned in the text above. This practice is especially disadvantageous in the classification of tree health condition because individual classes have a very dif-ferent range, which distorts the final evaluation and mainly its accuracy; it disables the objective return transformation into the average value of defoliation and it also has other negative impacts as Šmelko (1997) warned. The number of similar quantifica-tion attempts is much lower in the field of ecology and nature protection. Greater attention has been paid to this theme in the last period because of the NATURA 2000 Project implementation. In general, it also remains here on the principle of average mark; only the question of suitable weights for individual criteria and indicators of biotope statuses is more elaborated and discussed. Interesting examples can be found in the publications from Bavaria (Fischer et al. 2002) for forest biotopes in the area of “Hien-heimer Wald” and from Slovakia (Polák, Saxa 2005) for bird and non-forest biotopes.
Our proposals are more oriented to a new gen-eration of numerical quantifiers designated as Q, where the theory of EMDS (Reynolds 1999) is used and the current need for creating preconditions for introducing optimal biometric methods by the process of monitoring of forest ecosystems and for establishing the corresponding information system is taken into regard. All three variants of quantifiers Q1, Q2, Q3were tested against an extensive survey. Different combinations were tested, namely on 22 concrete forest biotopes integrated into the net-work of NATURA 2000 in Slovakia. Different rela-tive values in the scale from +1 to –1, e.g. 1.0 – 0.4
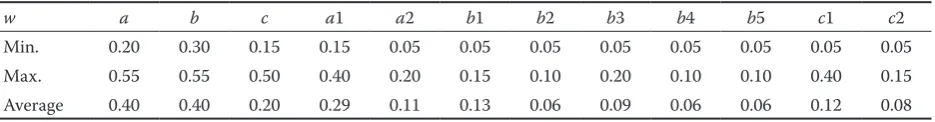
– (–0.4) – (–1.0), 1.0 – 0.5 – 0 – (–0.5), 1.0 – 0.5 – 0 – (–1) were assigned to qualitative statuses A, B, C, D and such weights were attributed to the criteria and indicators which corresponded best to a given biotope according to the experts’ opinion. It showed that the different relative quantification of A, B, C, D statuses did not cause any serious differences in the total evaluation of the biotope on condition that the limit values of quantifiers Q are reasonably ad-justed for their return transformation (in 10 tested model cases none of the biotopes was assigned for this reason to another category than it was originally appertained). A different situation is in weights w; these have to be chosen for each biotope or a group of related biotopes individually. The weights of cri-teria a, b, c and indicators ai, bi, ci varied in rather a wide range in the 22 tested biotopes (Table 4). Aver-age values of weights common for all biotopes were also quite well applicable. Obtained results were fully used for a preliminary evaluation of the favourable status of forest biotopes of the European significance in the territory of the Slovak Republic (Schwarz et al. 2005) and were taken to a manual for programmes of NATURA 2000 solicitude (Polák, Saxa 2005).
COnCluSiOn
[image:8.595.65.533.696.757.2]In general, it can be stated that the proposed quantifiers, mainly variant Q3, are suitable and well applicable to the evaluation of qualitative attributes of forest ecosystems including forest biotopes in the NATURA 2000 network. They directly express the rate at which the given ecosystem approximates to the required optimal status (100%) by its numerical value (e.g. 95%, 60%, 20%) and they have a number of other advantages. They completely characterise several qualitative aspects of the ecosystem by one number, different numerical operations can be done with them, it is possible to aggregate evaluated units of the ecosystem to larger entities, to determine aver-age value, variability and confidence of the precision of final evaluation and to compare resulting statuses mutually or very objectively on the principle of bio-metric monitoring in a longer time. The construction of quantifiers is opened and it arbitrarily enables to choose input parameters at need (numerical quan-tifications of A, B, C, D statuses and weights of their
Table 4. Variability of criteria weights a, b, c and indicators ai, bi, ci in 22 tested biotopes
w a b c a1 a2 b1 b2 b3 b4 b5 c1 c2
criteria and indicators) and to search for optimal solutions. Special software for personal computers was elaborated for this purpose and for routine use of quantifiers.
References
FISCHER M., MÜLLER-KROEHLING S., GULDER H.J., HEINIG B., 2002. Managementplan für das FFH – Gebiet „Hienheimer Wald“. Bayerische Staatsforstverwaltung für Wald und Forstwirtschaft, Forstdirektion Niederbayern – Oberpfalz: 62.
HEŠKO J., KONÔPKA J., TOMA R., 1989. Zdravotný stav smreka a jedle v SeŠL Žilina. [Štúdia.] Zvolen, VÚLH: 35. PALÁTM., VAŠÍČEK F., HENŽLÍK V., KAPERIDUS H.D.,
1994. Monitorování stavu lesa na trvalých zkusných plo-chách v oblasti Moravskoslezských Beskyd. In: Vliv imisí na lesy a lesní hospodářství Beskyd (6). Brno, VŠZ: 15–20. POLÁK P., SAXA A., 2005. Priaznivý stav biotopov a druhov
európskeho významu. Banská Bystrica, ŠOP SR: 736.
PRIESOL A., 1961. Základy kontroly produkcie v rámci hospodárskej úpravy lesov. Bratislava, Vydavateľstvo SAV: 131.
REYNOLDS K.M., 1999. NetWeaver for EMDS user guide (version 1.0): a knowledge base development system. General Technical Report PNW-GTR-XX. Portland, OR: U.S. Department of Agriculture, Forest Service, Pacific Northwest Research Station:20.
SCHWARZ M., VLADOVIČ J., ŠEBEŇ V., RIZMAN I., POLÁK P., DRAŽIL T., KMEŤOVÁ Z., LONGAUER R., ČABOUN V., 2005. Hodnotiace tabuľky priaznivého stavu zachovania pre lesné biotopy. In: POLÁK P., SAXA A. (eds), Priaznivý stav biotopov a druhov európskeho významu. Banská Bystrica, ŠOP SR: 150–200.
ŠMELKO Š., 1997. Metodické problémy kvantifikácie stavu a vývoja poškodenia korún stromov v lesných porastoch. In: Medzinárodná vedecká konferencia, sekcia 3, Les – drevo – životné prostredie 97. Zvolen, TU: 103–111.
Received for publication July 3, 2007 Accepted after corrections October 9, 2007
Corresponding author:
Prof. Ing. Štefan Šmelko, DrSc., Národné lesnícke centrum – Lesnícky výskumný ústav, T. G. Masaryka 22, 960 92 Zvolen, Slovenská republika
tel.: + 421 455 314 241, fax: + 421 455 314 192, e-mail: [email protected]
Hodnotenie kvalitatívnych vlastností lesných ekosystémov pomocou číselných
kvantifikátorov
ABSTRAKT: V príspevku sa podáva návrh na štyri varianty kvantifikátorov pre číselné vyjadrenie kvalitatívnych vlastností lesných ekosystémov, ako je napr. stanovište, prirodzenosť, biodiverzita, ekologická stabilita, ohrozenosť škodlivými činiteľmi, stav lesných biotopov európskeho významu v sústave NATURA 2000 ap. Kvantifikátory umož-ňujú charakterizovať celý súbor takýchto kvalitových znakov ekosystému komplexne jedným číslom, ktoré svojou hodnotou priamo udáva relatívne priblíženie sa ekosystému (v percentách) k želanému najpriaznivejšiemu stavu. Majú viaceré prednosti – dajú sa s nimi robiť rôzne počtárske operácie, agregovať hodnotené jednotky ekosystému do vyšších celkov, stanoviť priemernú hodnotu, variabilitu i rámec presnosti výsledného hodnotenia a porovnávať zistené stavy navzájom alebo v dlhšom časovom slede s uplatnením princípov biometrického monitorovania. Kon-štrukcia kvantifikátorov je otvorená, dovoľuje ľubovoľne podľa potreby voliť vstupné parametre (číselné kvantifikácie kvalitových stavov ekosystému a váhy ich kritérií a indikátorov) a hľadať optimálne riešenia. Reakcia kvantifikátorov na rôzne vstupné situácie sa rozoberá na modelových príkladoch a predkladajú sa námety na ich praktické použitie. Pre automatizovaný výpočet kvantifikátorov je vypracovaný špeciálny program na PC.