INTRODUCTION
Competitiveness is a widely used term with a number of definitions. This term has a number of aspects: e.g. potential competitiveness, real competitiveness, or the process leading to competitiveness (Matoková 2002). This last aspect is related to organisation and adminis-tration framework, which enables potential competitive-ness to become a real one.
Most of the potential competitiveness measures focus on monitoring and analysing various items such as price, production intensity, accessibility of certain production factors and production costs. In my article, I focus on the analysis of variable costs, which I compare in Slovakia, the Czech Republic, Poland, Hungary, Germany, Austria and France. This represents one of the steps in the ana-lysis of potential competitiveness.
MATERIAL AND METHODS
No comparable data on the total production costs of individual agricultural crops in the observed countries are available. The only data available are those on the variable costs of the selected crops. According to Brooks (Brooks 2003), countries use different specific items of variable costs, what has its grounds in differing account-ing methods and farmaccount-ing practices. E.g. works on fields (ploughing, sowing, spraying and cropping) performed by the farmer himself using his own workforce may be considered fixed costs. If the farmer contracts most of the work on the fields, the costs of such work may be classi-fied as variable costs. Some fixed costs items in one country may be, therefore, considered variable costs in another. This is very common and there are differences even within the same country.
Competitiveness in the production of selected crops
from the perspective of variable costs
Konkurencieschopnos pestovania vybraných rastlinných komodít z h¾adiska
variabilných nákladov
D. M
ATOKOVÁResearch Institute of Agricultural and Foodstuffs Economics, Bratislava, Slovak Republic
Abstract: This article deals with the issue of Slovakia’s competitiveness vis-à-vis the Czech Republic, Poland, Hungary, Germany,
Austria and France in terms of basic variable costs invested into seeds (planting stocks), fertilisers and chemical protective in the period from 2001 to 2003. In addition to these costs, the article also compares total revenues, profit, effect of inputs into production and the variable costs profit margin. This comparative analysis uses data published for 2002. While the data for years 2001 and 2003 for Slovakia and the Czech Republic are actual, those for other countries have been simulated. The basic variable costs per tonne of the produced crop (average figure for 2001 and 2003) in Slovakia are lower, i.e. it is competitive in the production of cereals, sunflower and sugar beet vis-à-vis the observed EU-15 countries, barley, sunflower and sugar beet vis-à-vis the Czech Republic, wheat and barley vis-à-vis Poland and barley vis-à-vis Hungary.
Key words: competitiveness, total revenue, basic variable costs, profit margin, gross margin
Abstrakt: Príspevok sa zaoberá konkurencieschopnosou Slovenska voèi Èesku, Po¾sku, Maïarsku, Nemecku, Rakúsku a Francúzsku z h¾adiska základných variabilných nákladov na osivá (sadivá), hnojivá a chemické ochranné prostriedky pri pestovaní rastlinných komodít v období rokov 2001 a 2003. Okrem uvedených nákladov sa v príspevku komparujú aj cel-kové príjmy, zisk, efekt vloených vstupov do výroby a rentabilita variabilných nákladov. Základom pre komparatívnu analýzu boli publikované údaje za rok 2002. Údaje za roky 2001 a 2003 za Slovensko a Èesko sú skutoèné, údaje za ostat-né krajiny sú nasimulovaostat-né. Z h¾adiska základných variabilných nákladov na tonu vyrobenej komodity v priemere za roky 2001 a 2003 má Slovensko niie náklady, t.j. je konkurencieschopné voèi sledovaným krajinám EÚ-15 pri obilninách, sl-neènici a cukrovej repe, voèi ÈR pri jaèmeni, slsl-neènici a cukrovej repe, voèi PR pri penici a jaèmeni a voèi MR pri jaèmeni.
This comparative analysis uses the data published for the year 2002(Brooks 2003). Figures for Slovakia and the Czech Republic for years 2001 and 2003 were obtained from the Research Institute of Agricultural and Food Eco-nomics, the Research Institute of Agricultural Econom-ics and the Ministry of Agriculture of the Czech Republic. Statistics for other countries have been simulated, as-suming that the quantity of seeds, fertilisers and chemi-cal protective used in the years 20012003 was stabilised and adequate in terms of areas of the respective crops. The year 2002 is the basic year, the prices of fertilisers and chemical protective were adjusted using the price indices of industrial producers published for the respec-tive years in the CANSTAT and Agricultural Statistics (EUROSTAT) bulletins. The data on the prices of crops in Poland were obtained from the Ministry of Agriculture in Warsaw and those for Hungary from the Research and Information Institute for Agricultural Economics (AKII)
in Budapest. The data on per hectare yields and crop ar-eas were obtained from the FAO database.
The following data were used for simulation for the individual crops:
– price
– per hectare yield
– costs of seeds, fertilisers and chemical protective – subsidies (area payments)
The following indicators were calculated on the basis of the above data:
– revenue from sales = price x hectare yield – total revenue = revenue from sales + subsidies – basic variable costs = costs of seeds + fertilisers +
chem-ical protective
– profit = price (per tonne) – basic variable costs (per tonne)
[image:2.595.56.526.326.708.2]– gross margin = total revenue – basic variable costs
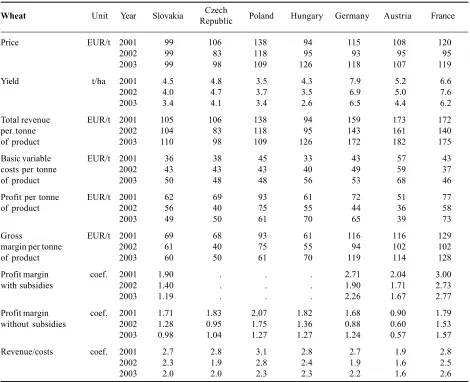
Table 1. Slovakia’s competitiveness in the production of wheat vis-à-vis selected countries from the perspective of variable costs and gross margin
Wheat Unit Year Slovakia RepublicCzech Poland Hungary Germany Austria France
Price EUR/t 2001 99 106 138 94 115 108 120
2002 99 83 118 95 93 95 95
2003 99 98 109 126 118 107 119
Yield t/ha 2001 4.5 4.8 3.5 4.3 7.9 5.2 6.6
2002 4.0 4.7 3.7 3.5 6.9 5.0 7.6
2003 3.4 4.1 3.4 2.6 6.5 4.4 6.2
Total revenue EUR/t 2001 105 106 138 94 159 173 172
per tonne 2002 104 83 118 95 143 161 140
of product 2003 110 98 109 126 172 182 175
Basic variable EUR/t 2001 36 38 45 33 43 57 43
costs per tonne 2002 43 43 43 40 49 59 37
of product 2003 50 48 48 56 53 68 46
Profit per tonne EUR/t 2001 62 69 93 61 72 51 77
of product 2002 56 40 75 55 44 36 58
2003 49 50 61 70 65 39 73
Gross EUR/t 2001 69 68 93 61 116 116 129
margin per tonne 2002 61 40 75 55 94 102 102
of product 2003 60 50 61 70 119 114 128
Profit margin coef. 2001 1.90 . . . 2.71 2.04 3.00
with subsidies 2002 1.40 . . . 1.90 1.71 2.73
2003 1.19 . . . 2.26 1.67 2.77
Profit margin coef. 2001 1.71 1.83 2.07 1.82 1.68 0.90 1.79 without subsidies 2002 1.28 0.95 1.75 1.36 0.88 0.60 1.53
2003 0.98 1.04 1.27 1.27 1.24 0.57 1.57
Revenue/costs coef. 2001 2.7 2.8 3.1 2.8 2.7 1.9 2.8
2002 2.3 1.9 2.8 2.4 1.9 1.6 2.5
2003 2.0 2.0 2.3 2.3 2.2 1.6 2.6
Total revenue and basic variable costs were recalcu-lated per hectare and tonne of the produced crop (Tibenská 2001). The following indicators were then calculated:
– quantity of produced crops (in Euros) per 1 Euro of inputs = revenue from sales / basic variable costs – profit margin with subsidies = gross margin / basic
vari-able costs and
– profit margin without subsidies = profit / basic vari-able costs.
RESULTS AND DISCUSSION
In terms of variable costs, 1 tonne of wheat in years 20012003 was produced most cheaply in France, the Czech Republic and Hungary. The costs were only by 2% higher in Slovakia. The EU-15 countries enjoy the high-est total revenue per 1 tonne of wheat because of higher production prices.
This is due to a higher level of subsidisation in the EU-15 countries than in the countries of the V-4.
The highest profit margin on variable costs, taking into account the provided subsidies, was achieved in France. While Austria had the lowest profit margin calculated excluding subsidies in 20012003 (0.69), Poland had the highest (1.70). As regards the effect of inputs into pro-duction, 1.7 to 2.7 Euros were gained from 1 Euro of basic variable costs; notably, this indicator was higher in the V-4 countries than in the EU (Table 1).
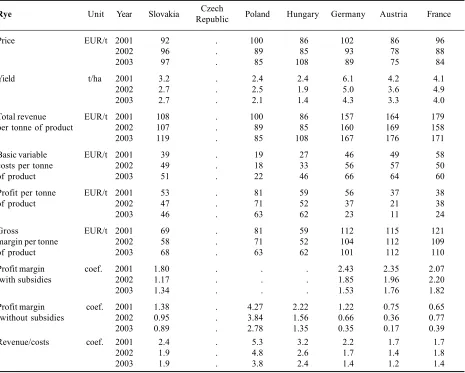
As the Table 2 indicates, in the observed period of years 20012003, rye was produced most cheaply in Po-land and Hungary. The costs per tonne of rye in PoPo-land represented, on average 43%, and in Hungary 76% of those in Slovakia. On the basis of this measure, the sum invested in seeds, seed stocks, fertilisers and protective in the EU-15 is by 20% higher than that in Slovakia.
[image:3.595.60.525.372.745.2]Slovakia had by 17% higher revenue per tonne of rye than other V-4 countries because of the higher price, per hectare yield and subsidies. The EU-15 countries, how-ever, had, on average, by 50% higher revenue owing to high subsidies and per hectare yields. Hungary and Po-land had in the production of rye the highest profit mar-gin on variable costs without subsidies. Excluding
Table 2. Slovakia’s competitiveness in the production of rye vis-à-vis selected countries from the perspective of variable costs and gross margin
Rye Unit Year Slovakia RepublicCzech Poland Hungary Germany Austria France
Price EUR/t 2001 92 . 100 86 102 86 96
2002 96 . 89 85 93 78 88
2003 97 . 85 108 89 75 84
Yield t/ha 2001 3.2 . 2.4 2.4 6.1 4.2 4.1
2002 2.7 . 2.5 1.9 5.0 3.6 4.9
2003 2.7 . 2.1 1.4 4.3 3.3 4.0
Total revenue EUR/t 2001 108 . 100 86 157 164 179 per tonne of product 2002 107 . 89 85 160 169 158
2003 119 . 85 108 167 176 171
Basic variable EUR/t 2001 39 . 19 27 46 49 58
costs per tonne 2002 49 . 18 33 56 57 50
of product 2003 51 . 22 46 66 64 60
Profit per tonne EUR/t 2001 53 . 81 59 56 37 38
of product 2002 47 . 71 52 37 21 38
2003 46 . 63 62 23 11 24
Gross EUR/t 2001 69 . 81 59 112 115 121
margin per tonne 2002 58 . 71 52 104 112 109
of product 2003 68 . 63 62 101 112 110
Profit margin coef. 2001 1.80 . . . 2.43 2.35 2.07
with subsidies 2002 1.17 . . . 1.85 1.96 2.20
2003 1.34 . . . 1.53 1.76 1.82
Profit margin coef. 2001 1.38 . 4.27 2.22 1.22 0.75 0.65 without subsidies 2002 0.95 . 3.84 1.56 0.66 0.36 0.77
2003 0.89 . 2.78 1.35 0.35 0.17 0.39
Revenue/costs coef. 2001 2.4 . 5.3 3.2 2.2 1.7 1.7
2002 1.9 . 4.8 2.6 1.7 1.4 1.8
2003 1.9 . 3.8 2.4 1.4 1.2 1.4
subsidies, the EU-15 countries would have the lowest profit margin. The inputs were most effectively used in the production of rye in Poland, where, in average, 4.6 Euros were earned per 1 Euro of invested variable costs. In Slovakia it was 2.1 Euros, more than in the countries of the EU-15.
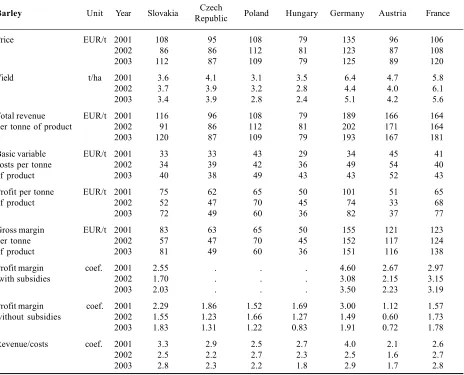
In average, in years 20012003 in Slovakia, it was ne-cessary to invest less into seeds, fertilisers and chemical protective for the production of 1 tonne of barley than in the observed countries, which represents a comparative advantage in terms of costs. Revenues from one tonne of produced barley are, however, affected by the price and per hectare yields. Due to better per hectare yields, this indicator was much higher in the EU-15 countries than in the countries of the V-4, which was caused also due to the significant area payments provided within the frame of the CAP. Slovakia achieved a very good result in the field of effect of inputs into the production of bar-ley, making 2.9 Euros on 1 Euro of basic variable costs. The top scorer in this field was Germany (3.1 Euros). Slo-vakias average profit margin in the field of variable costs without subsidies during the observed years was
1.89, a good result in comparison to other countries (Ta-ble 3).
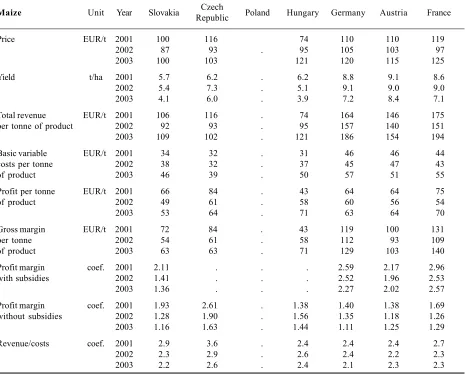
[image:4.595.61.525.370.745.2]In the years 20012003, the production of one tonne of maize cost more in Slovakia than in the Czech Republic or Hungary. Basic inputs in the countries of the EU-15 were approximately by 20% more expensive. The revenue from the sale of a tonne of maize in the V-4 countries was lower because of low prices and per hectare yields. Due to high-er prices, phigh-er hectare yields and subsidies, the revenue that EU-15 countries made from 1 tonne of maize was 60% higher than that in Slovakia. The average profit margin in the field of variable costs with subsidies in Slovakia in the years 20012003 was 1.63. The EU-15 countries are able to make a high, 2.00 plus profit margin because of the area payments. If no subsidies were provided, these countries would still produce maize with profit, but the difference would not be so significant in comparison to the V-4 coun-tries. Variable inputs costs were invested more effectively in Slovakia than in the EU-15 countries 2.5 Euros were made on 1 Euro of basic variable costs invested into maize production. The best scorer in this category is the Czech Republic (3.0) (Table 4).
Table 3. Slovakia’s competitiveness in the production of barley vis-à-vis selected countries from the perspective of variable costs and gross margin
Barley Unit Year Slovakia RepublicCzech Poland Hungary Germany Austria France
Price EUR/t 2001 108 95 108 79 135 96 106
2002 86 86 112 81 123 87 108
2003 112 87 109 79 125 89 120
Yield t/ha 2001 3.6 4.1 3.1 3.5 6.4 4.7 5.8
2002 3.7 3.9 3.2 2.8 4.4 4.0 6.1
2003 3.4 3.9 2.8 2.4 5.1 4.2 5.6
Total revenue EUR/t 2001 116 96 108 79 189 166 164 per tonne of product 2002 91 86 112 81 202 171 164
2003 120 87 109 79 193 167 181
Basic variable EUR/t 2001 33 33 43 29 34 45 41
costs per tonne 2002 34 39 42 36 49 54 40
of product 2003 40 38 49 43 43 52 43
Profit per tonne EUR/t 2001 75 62 65 50 101 51 65
of product 2002 52 47 70 45 74 33 68
2003 72 49 60 36 82 37 77
Gross margin EUR/t 2001 83 63 65 50 155 121 123
per tonne 2002 57 47 70 45 152 117 124
of product 2003 81 49 60 36 151 116 138
Profit margin coef. 2001 2.55 . . . 4.60 2.67 2.97
with subsidies 2002 1.70 . . . 3.08 2.15 3.15
2003 2.03 . . . 3.50 2.23 3.19
Profit margin coef. 2001 2.29 1.86 1.52 1.69 3.00 1.12 1.57 without subsidies 2002 1.55 1.23 1.66 1.27 1.49 0.60 1.73
2003 1.83 1.31 1.22 0.83 1.91 0.72 1.78
Revenue/costs coef. 2001 3.3 2.9 2.5 2.7 4.0 2.1 2.6
2002 2.5 2.2 2.7 2.3 2.5 1.6 2.7
2003 2.8 2.3 2.2 1.8 2.9 1.7 2.8
Revenues from 1 tonne of rape are substantially lower in the V-4 countries than in the EU-15 (Table 5). The rea-sons are lower prices, per hectare yields and the amount of subsidies. In terms of variable costs, most of the ob-served countries were able to produce rape in the years 20012003 much more cheaply than Slovakia where the production became very expensive, especially in 2003.
The quantity of production (in Euros) per 1 Euro of inputs oscillated between 1.4-2.6 Euros in the V-4 coun-tries in the years 20012003, while in the EU-15 councoun-tries it was 2.0-2.8. Slovakias result (1.4 Euro made on 1 Euro of variable costs of rape) represents the worst result among all observed countries. Slovakia reached the worst result also in the field of profit margin on variable costs, achieving with and without subsidies only 0.54 or 0.35 respectively.
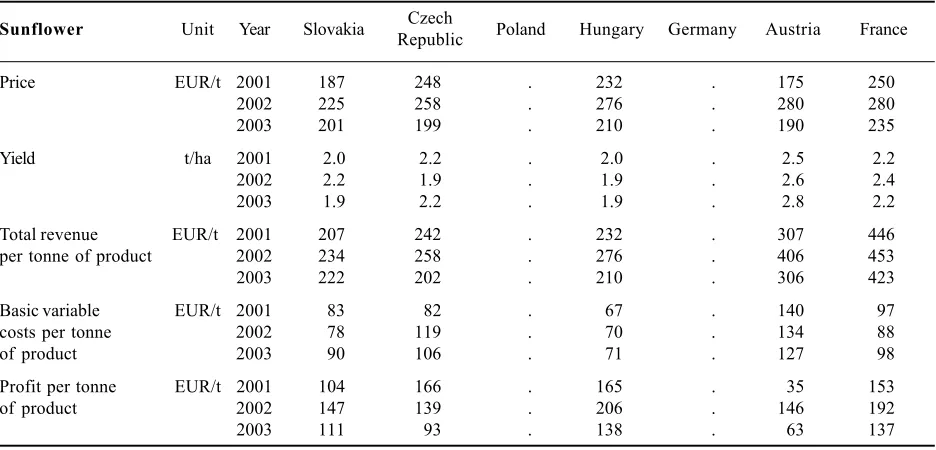
Total revenues from1 tonne of produced sunflower in 2003 were slightly higher in Slovakia than in Hungary and the Czech Republic. Higher per hectare yields and subsidies helped the EU-15 countries make very high revenue. With regard to costs of seeds, fertilisers
and chemical protective, all the observed countries ex-cept for Hungary invested more into production of a tonne of sunflower than Slovakia. The basic variable costs invested in Hungary in 20012003 were by 17% lower than in Slovakia. Slovakias profit margin in the field of variable costs with subsidies was 1.65, exceed-ing that of Austria. Hungary is currently producexceed-ing sun-flower seed without subsidies with the highest profit margin. Excluding subsidies, Austrias profit margin would be only 0.61. The inputs into production of sun-flower were invested most effectively in Hungary (3.4 Euro). Other countries were able to make 1.62.7 Euros on 1 Euro of costs of variable inputs (Table 6).
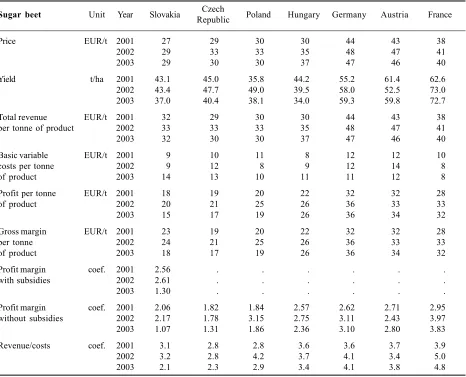
[image:5.595.60.525.372.746.2]The prices and per hectare yields of sugar beet were lower in the V-4 countries than in the EU-15 countries. This had adequate impact on the amount of revenues. While the revenue from a tonne of sugar beet was rough-ly the same in all V-4 countries, in the EU-15 countries it was by 2040% higher. In this connection, it is necessary to point out that the sugar beet production was subsi-dised only in Slovakia (Table 7).
Table 4. Slovakia’s competitiveness in the production of maize vis-à-vis selected countries from the perspective of variable costs and gross margin
Maize Unit Year Slovakia RepublicCzech Poland Hungary Germany Austria France
Price EUR/t 2001 100 116 74 110 110 119
2002 87 93 . 95 105 103 97
2003 100 103 121 120 115 125
Yield t/ha 2001 5.7 6.2 . 6.2 8.8 9.1 8.6
2002 5.4 7.3 . 5.1 9.1 9.0 9.0
2003 4.1 6.0 . 3.9 7.2 8.4 7.1
Total revenue EUR/t 2001 106 116 . 74 164 146 175 per tonne of product 2002 92 93 . 95 157 140 151
2003 109 102 . 121 186 154 194
Basic variable EUR/t 2001 34 32 . 31 46 46 44
costs per tonne 2002 38 32 . 37 45 47 43
of product 2003 46 39 . 50 57 51 55
Profit per tonne EUR/t 2001 66 84 . 43 64 64 75
of product 2002 49 61 . 58 60 56 54
2003 53 64 . 71 63 64 70
Gross margin EUR/t 2001 72 84 . 43 119 100 131
per tonne 2002 54 61 . 58 112 93 109
of product 2003 63 63 . 71 129 103 140
Profit margin coef. 2001 2.11 . . . 2.59 2.17 2.96
with subsidies 2002 1.41 . . . 2.52 1.96 2.53
2003 1.36 . . . 2.27 2.02 2.57
Profit margin coef. 2001 1.93 2.61 . 1.38 1.40 1.38 1.69 without subsidies 2002 1.28 1.90 . 1.56 1.35 1.18 1.26
2003 1.16 1.63 . 1.44 1.11 1.25 1.29
Revenue/costs coef. 2001 2.9 3.6 . 2.4 2.4 2.4 2.7
2002 2.3 2.9 . 2.6 2.4 2.2 2.3
2003 2.2 2.6 . 2.4 2.1 2.3 2.3
Table 6. Slovakia’s competitiveness in the production of sunflower vis-à-vis selected countries from the perspective of variable costs and gross margin
Sunflower Unit Year Slovakia RepublicCzech Poland Hungary Germany Austria France
Price EUR/t 2001 187 248 . 232 . 175 250
2002 225 258 . 276 . 280 280
2003 201 199 . 210 . 190 235
Yield t/ha 2001 2.0 2.2 . 2.0 . 2.5 2.2
2002 2.2 1.9 . 1.9 . 2.6 2.4
2003 1.9 2.2 . 1.9 . 2.8 2.2
Total revenue EUR/t 2001 207 242 . 232 . 307 446 per tonne of product 2002 234 258 . 276 . 406 453
2003 222 202 . 210 . 306 423
Basic variable EUR/t 2001 83 82 . 67 . 140 97
costs per tonne 2002 78 119 . 70 . 134 88
of product 2003 90 106 . 71 . 127 98
Profit per tonne EUR/t 2001 104 166 . 165 . 35 153
of product 2002 147 139 . 206 . 146 192
[image:6.595.57.525.539.764.2]2003 111 93 . 138 . 63 137
Table 5. Slovakia’s competitiveness in the production of rape seed vis-à-vis selected countries from the perspective of variable costs and gross margin
Rape Unit Year Slovakia RepublicCzech Poland Hungary Germany Austria France
Price EUR/t 2001 171 204 224 209 216 216 206
2002 177 204 220 230 245 245 233
2003 203 243 243 234 260 260 247
Yield t/ha 2001 2.5 2.9 2.4 1.9 3.7 2.6 2.7
2002 2.3 2.3 2.6 1.6 3.4 2.3 3.2
2003 1.0 1.6 1.8 1.5 2.9 1.8 3.1
Total revenue EUR/t 2001 194 203 224 209 305 345 329
per tonne of 2002 189 204 220 230 343 391 339
product 2003 266 238 243 234 373 440 356
Basic variable EUR/t 2001 96 63 102 77 85 99 92
costs per tonne 2002 109 114 95 89 92 114 78
of product 2003 310 172 141 98 110 147 81
Profit per tonne EUR/t 2001 75 141 122 132 131 117 114
of product 2002 68 90 125 141 153 131 155
2003 108 71 102 136 150 113 166
Gross margin EUR/t 2001 98 140 122 132 220 246 237
per tonne 2002 80 90 125 141 250 276 261
of product 2003 44 67 102 136 263 293 275
Profit margin coef. 2001 1.03 . . . 2.58 2.48 2.58
with subsidies 2002 0.73 . . . 2.71 2.41 3.36
2003 0.14 . . . 2.40 2.00 3.39
Profit margin coef. 2001 0.78 2.25 1.19 1.73 1.54 1.18 1.24 without subsidies 2002 0.62 0.79 1.31 1.59 1.65 1.14 1.99
2003 0.35 0.41 0.72 1.39 1.37 0.77 2.04
Revenue/costs coef. 2001 1.8 3.3 2.2 2.7 2.5 2.2 2.2
2002 1.6 1.8 2.3 2.6 2.7 2.1 3.0
2003 0.7 1.4 1.7 2.4 2.4 1.8 3.0
Gross margin EUR/t 2001 123 160 . 165 . 167 349
per tonne 2002 157 138 . 206 . 272 365
of product 2003 132 95 . 138 . 179 325
Profit margin coef. 2001 1.48 . . . . 1.19 3.62
with subsidies 2002 2.02 . . . . 2.03 4.16
2003 1.46 . . . . 1.41 3.33
Profit margin coef. 2001 1.24 2.01 . 2.45 . 0.25 1.59 without subsidies 2002 1.90 1.16 . 2.93 . 1.09 2.19
2003 1.23 0.87 . 1.94 . 0.50 1.40
Revenue/costs coef. 2001 2.2 3.0 . 3.5 . 1.3 2.6
2002 2.9 2.2 . 3.9 . 2.1 3.2
2003 2.2 1.9 . 2.9 . 1.5 2.4
[image:7.595.59.525.353.730.2]Source: see Table 1
Table 7. Slovakia’s competitiveness in the production of sugar beet vis-à-vis selected countries from the perspective of variable costs and gross margin
Sugar beet Unit Year Slovakia RepublicCzech Poland Hungary Germany Austria France
Price EUR/t 2001 27 29 30 30 44 43 38
2002 29 33 33 35 48 47 41
2003 29 30 30 37 47 46 40
Yield t/ha 2001 43.1 45.0 35.8 44.2 55.2 61.4 62.6 2002 43.4 47.7 49.0 39.5 58.0 52.5 73.0
2003 37.0 40.4 38.1 34.0 59.3 59.8 72.7
Total revenue EUR/t 2001 32 29 30 30 44 43 38
per tonne of product 2002 33 33 33 35 48 47 41
2003 32 30 30 37 47 46 40
Basic variable EUR/t 2001 9 10 11 8 12 12 10
costs per tonne 2002 9 12 8 9 12 14 8
of product 2003 14 13 10 11 11 12 8
Profit per tonne EUR/t 2001 18 19 20 22 32 32 28
of product 2002 20 21 25 26 36 33 33
2003 15 17 19 26 36 34 32
Gross margin EUR/t 2001 23 19 20 22 32 32 28
per tonne 2002 24 21 25 26 36 33 33
of product 2003 18 17 19 26 36 34 32
Profit margin coef. 2001 2.56 . . . .
with subsidies 2002 2.61 . . . .
2003 1.30 . . . .
Profit margin coef. 2001 2.06 1.82 1.84 2.57 2.62 2.71 2.95 without subsidies 2002 2.17 1.78 3.15 2.75 3.11 2.43 3.97
2003 1.07 1.31 1.86 2.36 3.10 2.80 3.83
Revenue/costs coef. 2001 3.1 2.8 2.8 3.6 3.6 3.7 3.9
2002 3.2 2.8 4.2 3.7 4.1 3.4 5.0
2003 2.1 2.3 2.9 3.4 4.1 3.8 4.8
Source: see Table 1
With the exception of Poland, Hungary and France, the basic variable costs of 1 tonne of sugar beet were higher in the observed countries than in Slovakia. Excluding subsidies, Slovakia would not achieve the same profit margin in the production of sugar beet as other countries with the exception of the Czech Republic. While Slova-kia made 2.8 Euro per 1 Euro of the invested variable costs, the highest figure (4.6 Euro) was achieved in France.
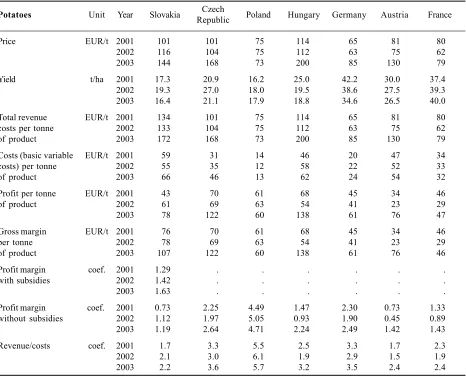
Potatoes in Slovakia belong among the crops with one of the highest prices and lowest per hectare yields from all the monitored countries. Unlike other countries, the production of potatoes was heavily subsidised in Slovakia. The costs of seeds, fertilisers and chemical protection were much higher in Slovakia and Hungary than in other countries. Basic variable costs in Poland in 20012003 were for instance by 78% lower than those in Slovakia. The individual countries had a varying profit margin on the invested costs. The highest profit margin without subsidies was achieved in Poland, fol-lowed by the Czech Republic and Germany. While the profit margin in Austria excluding subsidies was 0.87, it
was 1.01 in Slovakia. Inputs into production were most efficiently invested in Poland, where 5.8 Euros were made on 1 Euro (2 Euros in Slovakia) (Table 8).
The Table 9 compares the average basic variable costs, revenue, profit margin and the quantity of production per 1 Euro of inputs into the production of selected crops in the observed countries in years 20012003.
CONCLUSION
[image:8.595.59.525.367.744.2]The article focuses on the analysis of the competitive-ness of crop production in terms of basic variable costs (costs of seeds, fertilisers and chemical protection), com-parable in all monitored countries. At the same time, I anal-ysed the total revenue, profit margin, the quantity of production per 1 Euro of invested inputs and profit. The profit margin and profit were calculated in two variants -with and -without subsidies. Slovakia subsidised all ob-served crops, which is reflected in the gross margin fi-gures. Similarly, the EU-15 countries subsidised all the crops subject to observation with the exception of root and
Table 8. Slovakia’s competitiveness in the production of potatoes vis-à-vis selected countries from the perspective of variable costs and gross margin
Potatoes Unit Year Slovakia RepublicCzech Poland Hungary Germany Austria France
Price EUR/t 2001 101 101 75 114 65 81 80
2002 116 104 75 112 63 75 62
2003 144 168 73 200 85 130 79
Yield t/ha 2001 17.3 20.9 16.2 25.0 42.2 30.0 37.4 2002 19.3 27.0 18.0 19.5 38.6 27.5 39.3
2003 16.4 21.1 17.9 18.8 34.6 26.5 40.0
Total revenue EUR/t 2001 134 101 75 114 65 81 80
costs per tonne 2002 133 104 75 112 63 75 62
of product 2003 172 168 73 200 85 130 79
Costs (basic variable EUR/t 2001 59 31 14 46 20 47 34
costs) per tonne 2002 55 35 12 58 22 52 33
of product 2003 66 46 13 62 24 54 32
Profit per tonne EUR/t 2001 43 70 61 68 45 34 46
of product 2002 61 69 63 54 41 23 29
2003 78 122 60 138 61 76 47
Gross margin EUR/t 2001 76 70 61 68 45 34 46
per tonne 2002 78 69 63 54 41 23 29
of product 2003 107 122 60 138 61 76 46
Profit margin coef. 2001 1.29 . . . .
with subsidies 2002 1.42 . . . .
2003 1.63 . . . .
Profit margin coef. 2001 0.73 2.25 4.49 1.47 2.30 0.73 1.33 without subsidies 2002 1.12 1.97 5.05 0.93 1.90 0.45 0.89
2003 1.19 2.64 4.71 2.24 2.49 1.42 1.43
Revenue/costs coef. 2001 1.7 3.3 5.5 2.5 3.3 1.7 2.3
2002 2.1 3.0 6.1 1.9 2.9 1.5 1.9
2003 2.2 3.6 5.7 3.2 3.5 2.4 2.4
tuber crops. The gross margin data on the Czech Repub-lic, Poland and Hungary are provided excluding subsidies.
From the perspective of basic variable costs of 1 tonne of produced crop in the period 2001 to 2003, the costs in Slovakia are lower, i.e. it is compatible vis-à-vis: – the observed EU-15 countries as regards cereals,
sun-flower and sugar beet (with the exception of France), – the Czech Republic as regards barley, sunflower and
sugar beet,
– Poland as regards wheat and barley – Hungary as regards barley.
Slovakias profit margin, calculated as the gross mar-gin over the basic variable costs (including subsidies) is lower than that of the EU-15 countries.
The situation is different when we consider the aver-age profit margin for the period 20012003 calculated excluding subsidies. The average profit margin achieved in Slovakia and other V-4 countries is 1 plus. The
produc-Table 9. Comparison of basic variable costs (Slovakia = 100%), profit margin and quantity of production per 1 Euro of inputs (on average for years 20012003)
Slovakia Czech Republic Poland Hungary Germany Austria France
Basic variable costs per tonne
wheat 100 99 105 99 112 142 98
rye 100 . 43 76 121 123 121
barley 100 103 126 102 119 143 117
maize 100 87 . 99 125 122 120
rape 100 68 66 51 56 70 49
sunflower 100 123 . 83 . 159 112
sugar beet 100 110 90 90 110 117 81
potatoes 100 63 22 93 37 85 56
Profit margin with subsidies
wheat 1.50 . . . 2.29 1.81 2.83
rye 1.44 . . . 1.94 2.02 2.03
barley 2.09 . . . 3.73 2.35 3.10
maize 1.63 . . . 2.46 2.05 2.69
rape 0.54 . . . 2.56 2.30 3.11
sunflower 1.65 . . . . 1.54 3.70
sugar beet 2.16 . . . .
potatoes 1.45 . . . .
Profit margin without subsidies
wheat 1.32 1.27 1.70 1.48 1.27 0.69 1.63
rye 1.07 . 3.63 1.71 0.74 0.43 0.61
barley 1.89 1.47 1.47 1.26 2.13 0.82 1.69
maize 1.46 2.05 . 1.46 1.29 1.27 1.42
rape 0.35 1.15 1.07 1.57 1.52 1.03 1.76
sunflower 1.46 1.35 . 2.44 . 0.61 1.73
sugar beet 1.77 1.64 2.28 2.56 2.94 2.65 3.58
potatoes 1.01 2.29 4.75 1.55 2.23 0.87 1.22
Revenue/costs
wheat 2.3 2.3 2.7 2.5 2.3 1.7 2.6
rye 2.1 . 4.6 2.7 1.7 1.4 1.6
barley 2.9 2.5 2.5 2.3 3.1 1.8 2.7
maize 2.5 3.0 . 2.5 2.3 2.3 2.4
rape 1.4 2.2 2.1 2.6 2.5 2.0 2.8
sunflower 2.5 2.3 . 3.4 . 1.6 2.7
sugar beet 2.8 2.6 3.3 3.6 3.9 3.6 4.6
potatoes 2.0 3.3 5.8 2.5 3.2 1.9 2.2
tion of the majority of the observed crops without subsi-dies in Austria would not be as profitable from the per-spective of variable costs as the production with subsidies and the profit margin for all crops except maize, rape and sugar beet would be below 1. The profit margin in the production of rye would be lower also in Germany and France. Production of wheat, rye and potatoes is most profitable in Poland, barley is most profitable in Germany, sunflower in Hungary and sugar beet and rape seed in France.
When we consider the effectiveness of the basic vari-able inputs into production (seeds, fertilisers and chemical protective), the V-4 countries gain more per 1 Euro of in-vested costs than the EU-15 countries in rye, sunflower and maize. The situation is opposite in sugar beet pro-duction. In this perspective, Slovakia is in a very good position in the production of barley.
REFERENCES
Brooks G. (2003): European arable crop profit margins. Can-terbury, Jasmine House, 150 p.
Matoková D. (2002): Analysis of competitiveness of Slovak agricultural products. Research report. Bratislava, VÚEPP, 26 p.
Tibenská H. (2001): Analysis of inputs into agricultural pro-duction and their impact on its effectiveness. Research re-port. Bratislava, VÚEPP, 52 p.
Costs and economic results of agricultural companies in Slovakia in 2001, classified according to production spheres (2002). Bratislava, VÚEPP, 63 p.; ISBN 80-88992-44-3. Costs and economic results of agricultural companies in
Slovakia in 2002, classified according to production spheres (2003). Bratislava, VÚEPP, 63 p.; ISBN 80-8058-192-4. Costs and economic results of agricultural companies in
Slovakia in 2003, classified according to production spheres (2004). Bratislava, VÚEPP, 61 p.; ISBN 80-8058-334-X.
Arrived on 22nd September 2004
Contact address:
Ing. Dagmar Matoková, Výskumný ústav ekonomiky po¾nohospodárstva a potravinárstva, Trenèianska 55, 824 80 Bratislava, Slovenská republika