The Application of High Resolution Melting in the Analysis
of Simple Sequence Repeat and Single Nucleotide
Polymorphism Markers in a Pea (
Pisum sativum
L.
) Population
Michał KNOPKIEWICZ, Magdalena GAWŁOWSKA and Wojciech ŚWIĘCICKI
Institute of Plant Genetics, Polish Academy of Sciences, Poznan, Poland
Abstract
Knopkiewicz M., Gawłowska M., Święcicki W. (2014): The application of high resolution melting in the
analysis of simple sequence repeat and single nucleotide polymorphism markers in a pea (Pisum sativum L.)
population. Czech J. Genet. Plant Breed., 50: 151–156.
The aim of this study was to verify the high resolution melting (HRM) method in the analysis of single nucleo-tide polymorphism (SNP) and simple sequence repeat (SSR) markers in pea (Pisum sativum L.). A recombinant inbred line population, Carneval × MP1401, was tested for three SNP and 103 SSR markers. HRM analysis was conducted on a LightScanner 96 instrument with LC Green dye. The melting curve shape permitted two polymorphic genotypes to be distinguished. The results were confirmed by gel electrophoresis. Three SSR markers were sequenced and analysed by the melting prediction software. The results confirmed the presence of one polymerase chain reaction (PCR) product with two melting domains. Sequence tagged site (STS) mark-ers produced specific products: Psat_EST_00189_01_1 (300 bp), Pis_GEN_18_2_1 (400 bp), Pis_GEN_7_1-2_1 (600 bp). Amplicons contained one, four and seven single nucleotide polymorphisms, respectively. Melting curve differences enabled the population genotyping except for Psat_EST_00189_01_1 where resolution was too low. Primers for Psat_EST_00189_01_1 were redesigned to obtain a shorter (100 bp) PCR product which increased the resolution. The number of SNPs and amplicon length are crucial for HRM resolution. The HRM method is fast and has a high throughput. The melting analysis of 96 samples takes less than 10 min. Agarose gel analysis confirmed the reliability of HRM, which eliminates laborious post-PCR analysis.
Keywords: genotyping; high resolution melting; molecular markers; Pisum sativum L.
DNA analysis via high resolution melting (HRM) is a relatively new technique. It is useful for genotyping, mutation scanning and sequence matching. HRM is based on the properties of fluorescent dyes which bind only to double-stranded DNA. These dyes emit strong fluorescence when they bind to DNA. When the sample is heated, DNA slowly denatures and releases the fluorescent dye, which causes the fluo-rescence to decrease. When the temperature reaches the melting point of the fragment being analysed, a rapid decrease in fluorescence is observed. HRM instruments measure the fluorescence during the entire heating time to generate a melting curve. The melting temperature of a DNA duplex depends on its length and sequence; thus, different sequences
generate different melting curves (Reed et al. 2007).
The new generation of saturation dyes (LCGreen®,
EvaGreen®) allows detection of SNP polymorphism
and small deletions or insertions. These dyes enable high saturation of double-stranded DNA, which is crucial for obtaining high resolution. The utility of the HRM technique has been confirmed by
genotyp-ing various plant species, such as Medicago sativa L.
(Han et al. 2012), Zea mays L. (Yu et al. 2011), Oryza
sativa L. (Li et al. 2011), Lupinus albus L.
(Crox-ford et al. 2008), Hordeum vulgare L. (Hofinger
The aim of this study was to assess if HRM is suit-able for single nucleotide polymorphisms (SNP) and
SSR marker analysis in pea (Pisum sativum L.). The
recombinant inbred line (RIL) population Carneval × MP1401 was tested for several SNP and SSR markers.
MATERIAL AND METHODS
Samples of the seeds of the Carneval × MP1401 population were provided by Dr B. Tar’an and Dr T. Warkentin from the University of Saskatchewan, Canada. Both parents of the population are semi-leafless and have short internodes. The plants of
88 F7 inbred lines were analysed (Tar’an et al. 2003).
Primer pairs for SNP markers were developed
in the framework of the 6th EU FP Grain Legumes
Integrated Project (GLIP). The primer information is available on the following website: http://bioweb. abc.hu/cgi-mt/pisprim/pisprim.pl. One pair of prim-ers was redesigned using the LightScanner Primer Design software (Idaho Technology, Salt Lake City, USA). The Pea Microsatellite Consortium, set up by Agrogene, France, developed primer pairs for the SSR markers. Most of the markers tested in this study
have been used for mapping (Loridon et al. 2005).
The SNP reaction was performed as follows: 0.5× LCGreen dye (Idaho Technology), 1× buffer
Go-Taq flexi (Promega, Madison, USA), 1.5mM MgCl2
(Promega), 1mM dNTP (ThermoFisher Scientific, Waltham, USA), primer 1 (1μM), primer 2 (1μM), 0.6 U GoTaq polymerase (Promega), 100 ng/μl BSA (Sigma-Aldrich, St. Louis, USA), 25 ng DNA. The touchdown PCR profile was: 16 × (95°C (3 min), 60°C (60 s), 72°C (60 s)) – the annealing temperature was reduced by 2°C every two cycles until 46°C was reached; then 19× (94°C (30 s), 45°C (60 s), 72°C (60 s)); 72°C (4 min); hold at 10°C.
The SSR reaction was performed as follows: 0.5× LCGreen dye (Idaho technology), 1× buffer GoTaq
flexi (Promega), 1.5mM MgCl2 (Promega); 0.6mM
dNTP (ThermoFisher Scientific); primer 1 (0.2μM); primer 2 (0.2μM); 0.6 U GoTaq polymerase (Promega), 25 ng DNA. PCR profile: 95°C (3 min); 35× (95°C (30s),
required TM (60 s), 72°C (60 s)); and 72°C (5 min).
HRM analysis was conducted on a LightScanner 96 instrument (Idaho Technology). Melting profiles were tested by uMELT, the online software for melting
curve predictions (Dwight et al. 2011).
Restriction enzymes able to distinguish between two genotypes were identified using the dCAPS
2.0 software (Neff et al. 2002). The digestion with
restriction enzymes was performed as follows:
0.5 U restriction enzyme – VspI, Hin1II or Cfr13I
(ThermoFisher Scientific), 1× buffer – Orange, Green or Tango, respectively (ThermoFisher Scientific), 5 μl PCR reaction mixture. Temperature profile: 37°C (1 h), 65°C (20 min).
RESULTS AND DISCUSSION
The HRM analysis requires an appropriately opti-mized PCR reaction. Specificity is more important than efficiency in such analyses. One hundred and three SSR and three STS markers were tested. Product quality was tested by agarose gel electrophoresis. Only clean amplicons were subsequently tested by HRM. Yu
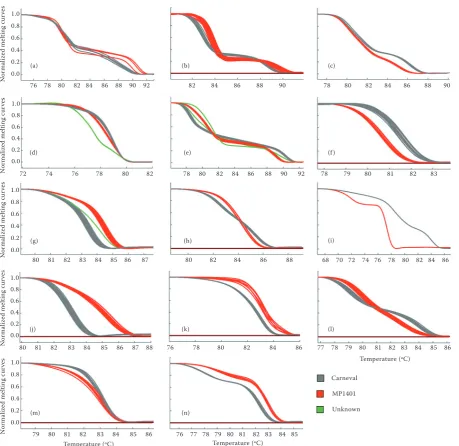
et al. (2011) used polyacrylamide gel electrophoresis to identify clean SSR markers in maize for further HRM analysis. In the present study, clean products for 65 SSR primers were obtained. Fourteen of them were polymorphic in the parental lines and were tested in the mapping population (Figure 1). The PSMPSAA72 marker was additionally tested via gel electrophoresis to confirm the HRM output. The HRM results were consistent with the agarose gel results (Figure 2).
Distefano et al. (2012) used HRM to analyse SSR
markers in Citrus. They confirmed the HRM outputs
by capillary electrophoresis. HRM identified more genotypes than capillary electrophoresis because of SNP polymorphisms within monomorphic SSR markers. We identified samples that did not match to any of the parental genotypes and were marked as unknown (Figure 1d–g). We hypothesize that these amplicons contain additional mutations. The HRM analysis of markers PSMPSAA72, PSMPSAA153, PSMPSAA170 and PSMPSAD135 resulted in melt-ing curves with two regions of rapid fluorescence decrease. These regions can be presented as melt-ing peaks in a different kind of graph. Such a shape suggests the presence of two PCR products with different melting temperatures in the sample. This observation was inconsistent with the gel electro-phoresis, which resulted in one clean band for each marker. We hypothesised that the sequences of these markers comprised two melting domains: an AT rich
domain with a lower TM and a GC rich domain with
a higher TM. Such a possibility has been described
in literature for fragments of eukaryotic translation
initiation factor 4E (Hofinger et al. 2009).
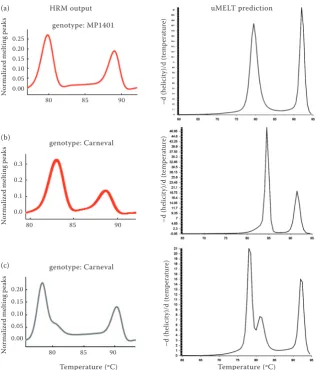
Mark-ers PSMPSAA72, PSMPSAA153 and PSMPSAD135 were sequenced to test this hypothesis. The obtained sequences were tested by uMELT for melting curve
predictions (Dwight et al. 2011). The results of the
N
or
m
al
iz
ed
m
el
tin
g
cu
rv
es
Temperature (oC)
N
or
m
al
iz
ed
m
el
tin
g
cu
rv
es
N
or
m
al
iz
ed
m
el
tin
g
cu
rv
es
N
or
m
al
iz
ed
m
el
tin
g
cu
rv
es
N
or
m
al
iz
ed
m
el
tin
g
cu
rv
es
Temperature (oC)
Temperature (oC) Carneval
MP1401 Unknown 1.0
0.8 0.6 0.4 0.2 0.0
76 78 80 82 84 86 88 90 92 82 84 86 88 90 78 80 82 84 86 88 90
78 79 80 81 82 83 78 80 82 84 86 88 90 92
72 74 76 78 80 82 (a)
80 81 82 83 84 85 86 87 88 80 81 82 83 84 85 86 87
76 78 80 82 84 86
68 70 72 74 76 78 80 82 84 86 80 82 84 86 88
(b)
(d)
(c)
(e) (f )
(g) (h) (i)
(j) (k) (l)
(m) (n)
77 78 79 80 81 82 83 84 85 86
76 77 78 79 80 81 82 83 84 85 79 80 81 82 83 84 85 86
1.0 0.8 0.6 0.4 0.2 0.0
1.0 0.8 0.6 0.4 0.2 0.0
1.0 0.8 0.6 0.4 0.2 0.0
[image:3.595.64.524.79.525.2]1.0 0.8 0.6 0.4 0.2 0.0
Figure 1. Melting curves of simple sequence repeat (SSR) markers (parental and population samples): (a) – PSMPSAA72, (b) – PSMPSAA153, (c) – SMPSAA170, (d) – PSMPSAD61, (e) – PSMPSAD135, (f) – PSMPSAB30, (g) – PSMPSAB47, (h) – PSMPSAA278, (i) – PSMPSAA238, (j) – PSMPSAA355, (k) – PSMPSAA179, (l) – PSMPSAC21, (m) – PSMPSAC27, (n) – PSMPSAD135; grey lines represent the Carneval genotype, red lines represent the MP1401 genotype and green lines represent unknown samples (samples that did not match the parental genotypes)
[image:3.595.63.388.616.758.2]which confirmed the presence of two melting domains within the analysed amplicons (Figure 3).
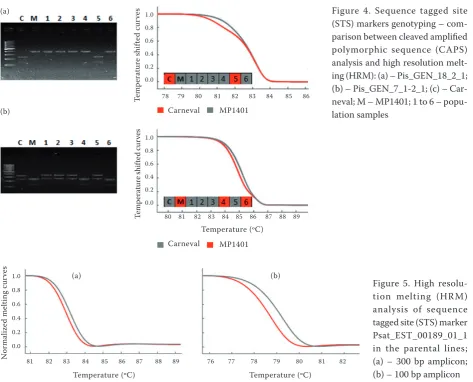
Three STS markers (Psat_EST_00189_01_1, Pis_ GEN_18_2_1, Pis_GEN_7_1-2_1) were tested in the
parental lines. They produced specific 300, 400 and 600 bp products, respectively. Sequencing of the amplicons revealed single nucleotide polymorphisms (Table 1). The STS markers were tested in the mapping
popula-Table 1. Detected single nucleotide polymorphisms within sequence tagged site markers and restriction enzymes used for digestion
Marker name Amplicon length SNP position Genotype Cutting enzyme
(bp) Carneval MP1401
Psat_EST_00189_01_1 300 103 G A Hin1II
Pis_GEN_18_2_1 400 142 A G
207 T C VspI
214 G A
Pis_GEN_7_1-2_1 600 127 A G
136 A T
146 C T
365 T C Cfr13I
466 G T
500 C G
[image:4.595.63.382.80.451.2]508 G C
Figure 3. High resolution melting (HRM) analysis of simple sequence repeat (SSR) markers (melting peaks) and melting prediction results by uMELT: (a) – PSMPSAA72, (b) – PSMPSAA153, (c) – PSMPSAD135
Nor
mali
ze
d me
lting p
eak
s
Nor
mali
ze
d me
lting p
eak
s
Nor
mali
ze
d me
lting p
eak
s
Temperature (oC) HRM output
0.25 0.20 0.15 0.10 0.05 0.00
80 85 90
80 85 90
80 85 90
(a)
(b)
(c)
0.3 0.2 0.1 0.0
0.20 0.15 0.10 0.05 0.00
genotype: MP1401
genotype: Carneval
genotype: Carneval
uMELT prediction
Temperature (oC)
–d
(h
el
ic
ity
)/
d
(t
em
pe
ra
tu
re
)
–d
(h
el
ic
ity
)/
d
(t
em
pe
ra
tu
re
)
–d
(h
el
ic
ity
)/
d
(t
em
pe
ra
tu
re
[image:4.595.65.532.569.757.2]tion via digestion with restriction enzymes. Genotypes were easily distinguishable after gel electrophoresis, except for Psat_EST_00189_01_1. The markers were then tested by the HRM method in the parental lines and in six population samples. The HRM outcome matched the electrophoresis results (Figure 4). It was impossible to genotype the Psat_EST_00189_01_1 marker based on the melting curve because of the very small difference between the two variants. Probably, the amplicon for this marker was too long (300 bp with only one SNP in comparison with 400 bp with three SNPs for Pis_GEN_18_2_1 and 600 bp with seven SNPs
for Pis_GEN_7_1-2_1). According to Hofinger et al.
(2009), a higher number of SNPs within an amplicon increases the resolution. Primers were redesigned to obtain a shorter PCR product (approximately 100 bp) (LightScanner Primer Design Software, Idaho Technol-ogy, Salt Lake City, USA ). The difference in the melt-ing curves of the parental genotypes was much more pronounced and allowed the correct genotyping of the mapping population. The analysis of SNP within the shorter amplicon resulted in better resolution (Figure 5).
CONCLUSIONS
The HRM method has many advantages. It is very fast and has a high throughput: it can be performed in less than 10 min. There is no need for time-consuming gel electrophoresis following the PCR reaction. It is
also accurate and repeatable (Han et al. 2012). HRM
is also reliable: we confirmed our results using agarose
gel electrophoresis. Distefano et al. (2012) and Li et
al. (2011) also confirmed the reliability of HRM. This
method is safer for researchers than gel techniques, because there is no need to use toxic acrylamide or mutagenic ethidium bromide, which is the most common dye used for agarose gel electrophoresis. HRM eliminates the need for amplicon sequenc-ing and the purchase of the restriction enzyme sets to visualize SNP polymorphisms. It is also possible to analyse SNPs that do not form restriction sites. SNP analysis techniques are developing very rapidly. Genotyping by next-generation sequencing (NGS) is being increasingly adopted for discovery applications
(Semagn et al. 2014). In this case SNP identification
[image:5.595.63.537.78.460.2]Figure 5. High resolu-tion melting (HRM) analysis of sequence tagged site (STS) marker Psat_EST_00189_01_1 in the parental lines; (a) – 300 bp amplicon; (b) – 100 bp amplicon Figure 4. Sequence tagged site (STS) markers genotyping – com-parison between cleaved amplified polymorphic sequence (CAPS) analysis and high resolution melt-ing (HRM): (a) – Pis_GEN_18_2_1; (b) – Pis_GEN_7_1-2_1; (c) – Car-neval; M – MP1401; 1 to 6 – popu-lation samples
Temperature (oC)
N
or
m
al
iz
ed
m
el
tin
g
cu
rv
es (a) (b)
76 77 78 79 80 81 82 81 82 83 84 85 86 87 88 89
1.0 0.8 0.6 0.4 0.2 0.0
Temperature (oC) (b)
Tem
pera
tur
e s
hif
te
d
cur
ve
s
1.0 0.8 0.6 0.4 0.2 0.0
Te
m
pe
ra
tu
re
sh
ift
ed
c
ur
ve
s
1.0 0.8 0.6 0.4 0.2 0.0
78 79 80 81 82 83 84 85 86
Carneval MP1401
80 81 82 83 84 85 86 87 88 89
Temperature (oC) (a)
requires a reference genome which is not available for
all species (including pea). Van et al. (2013) overcame
this constraint by sequencing genomes of two cultivars. New-generation sequencing is a very effective approach to identify a large number of new SNPs, but it generates huge amounts of data which need further processing. This technique is not suitable for the analysis of many samples. An alternative to NGS is Kompetitive Allele Specific PCR (KASP). This technique has a broad range of applications (quality control, QTL mapping, allele mining). KASP is a uniplex technology based on allele specific oligo extension and fluorescence resonance
energy transfer for signal generation (Semagn et al.
2014). This approach requires the knowledge of the DNA sequence to design primers for known SNP. HRM does not provide the information about sequence but it enables discovery of new polymorphisms. We suc-cessfully analysed a 600 bp amplicon containing seven SNPs; however, it was impossible to genotype a 300 bp amplicon containing one SNP. More SNPs within an amplicon increased the HRM resolution, which is
consistent with the results of Hofinger et al. (2009).
Conversion of 300 bp amplicon into 100 bp product containing one SNP increased the resolution of HRM. There are few references regarding the analysis of SSR
markers by HRM in plant species (Li et al. 2011; Yu et al.
2011; Distefano et al. 2012). In this study we confirmed
the utility of HRM for SSR markers in genotyping of a pea RIL population. We also proved the presence of the two melting domains within one amplicon for three analysed SSR markers (PSMPSAA72, PSMPSAA153 and PSMPSAD135), which was reported by Hofinger
et al. (2009) for STS markers.
References
Croxford A.E., Rogers T., Caligari P.D., Wilkinson M.J. (2008): High-resolution melt analysis to identify and map sequence-tagged site anchor points onto linkage maps: a white lupin (Lupinus albus) map as an exemplar. New Phytologist, 180: 594–607.
Distefano G., Caruso M., LA Malfa S., Gentile A., Wu S-B. (2012): High resolution melting analysis is a more sensitive and effective alternative to gel-based platforms in analysis of SSR – an example in citrus. PLoS ONE, 7: e44202. Dwight Z., Palais R., Wittwer C.T. (2011): uMELT: prediction of high-resolution melting curves and dynamic melting profiles of PCR products in a rich web applica-tion. Bioinformatics, 27: 1019–1020.
Han Y., Khu D.M., Monteros M. J. (2012): High-resolu-tion melting analysis for SNP genotyping and mapping in
tetraploid alfalfa (Medicago sativa L.). Molecular Breed-ing, 29: 489–501.
Hofinger B.J., Jing H.C., Hammond-Kosack K.E., Kanyuka K. (2009): High-resolution melting analysis of cDNA-derived PCR amplicons for rapid and cost-effective identification of novel alleles in barley. Theoretical and Applied Genetics, 119: 851–65.
Li J., Wang X., Dong R., Yang Y., Zhou J., Yu C., Cheng Y., Yan C., Chen J. (2011): Evaluation of high-resolution melting for gene mapping in rice. Plant Molecular Biology Reporter, 29: 979–985.
Lochlainn S.Ó., Amoah S., Graham N.S., Alamer K., Rios J.J., Kurup S., Stoute A., Hammond J.P., Østergaard L., King G.J., White P.J., Broadley M.R. (2011): High Resolution Melt (HRM) analysis is an efficient tool to genotype EMS mutants in complex crop genomes. Plant Methods, 7: 43.
Loridon K., MCphee K., Morin J., Dubreuil P., Pilet-Nay-el M. L., Aubert G., Rameau C., Baranger A., Coyne C., Lejeune-Henaut I., Burstin J. (2005): Microsatellite marker polymorphism and mapping in pea (Pisum sati-vum L.). Theoretical and Applied Genetics, 111: 1022–1031. Neff M.M., Turk E., Kalishman M. (2002): Web-based
primer design for single nucleotide polymorphism analy-sis. Trends in Genetics, 18: 613–615.
Reed G.H., Kent J.O., Wittwer C.T. (2007): High-res-olution DNA melting analysis for simple and efficient molecular diagnostics. Pharmacogenomics, 8: 597–608. Semagn K., Babu R., Hearne S., Olsen M. (2014) Single
nucleotide polymorphism genotyping using Kompetitive Allele Specific PCR (KASP): overview of the technol-ogy and its application in crop improvement. Molecular Breeding, 33: 1–14.
Tar’an B., Warkentin T., Somers D.J., Miranda D., Vandenberg A., Blade S., Woods S., Bing D., Xue A., DeKoeyer D., Penner G. (2003): Quantitative trait loci for lodging resistance, plant height and partial resistance to mycosphaerella blight in field pea (Pisum sativum L.). Theoretical and Applied Genetics, 107: 1482–1491. Van K., Kang Y.J., Han K.S. Lee Y.H. Gwag J.G., Moon
J.K., Lee S.H. (2013): Genome wide SNP discovery in mungbean by Illumina HiSeq. Theoretical and Applied Genetics, 126: 2017–2027.
Yu R.H., Shan X.H., Wang S., Li X.H., Jiang Y., Tan H., Li Y.D. (2011): A screening method for detecting simple sequence repeat (SSR) polymorphism of Zea mays using high resolution melting-curve analysis. African Journal of Biotechnology, 10: 16443–16447.
Received for publication June 3, 2013 Accepted after corrections April 17, 2014
Corresponding author: