ORIGINAL RESEARCH
Diffusion Tensor Tractography-Based Group
Mapping of the Pyramidal Tract in
Relapsing-Remitting Multiple Sclerosis Patients
F. Lin C. Yu T. Jiang K. Li P. Chan
BACKGROUND AND PURPOSE:Many studies have reported abnormal changes in relapsing-remitting multiple sclerosis (RRMS) by histogram and region-of-interest– based methods by using diffusion tenor imaging. However, there are few studies on specific white matter fiber tracts of RRMS. Our study sought to use diffusion tensor tractography– based group mapping to investigate the presence of abnormal diffusion in the normal-appearing pyramidal tract (PYT) of RRMS and its possible mechanism.
METHODS: A PYT probability map was first constructed from data on 20 healthy patients based on the deterministic-based tractography method. The PYT probability map was then applied to 29 RRMS patients to calculate diffusion indices of the PYT. In this study, 4 quantitative indices—fractional anisotropy (FA), directionally averaged diffusion coefficient (Dav), axial diffusion coefficient (1), and radial diffusion coefficient (23)—were used to characterize the abnormal diffusion.
RESULTS: Compared with healthy controls, RRMS patients had a significantly higherDavand23but a lower FA and a trend toward a lower1in the normal-appearing PYT. In RRMS patients, PYT lesions had a significantly higher23and a lower FA, but there were no differences forDavand1when compared with the appearing PYT. Moreover, the diffusion indices derived from the normal-appearing PYT were significantly correlated with PYT lesion volumes by using the Spearman correla-tion analysis.
CONCLUSION:Our findings confirm the presence of abnormal diffusion in the normal-appearing PYT of RRMS patients and suggest that wallerian degeneration might be its mechanism.
D
iffusion tensor imaging (DTI) is a noninvasive imaging tech-nique capable of characterizing the diffusion properties of water molecules in vivo and detecting microstructural tissue changes not visible on conventional MR imaging.1-3Diffusion tensor, a 3⫻3 matrix, is introduced to model the motion of water molecules in brain tissue. Some quantitative rotationally invari-ant indices, which include fractional anisotropy (FA) and direc-tionally averaged diffusion coefficient (Dav) derived from thedif-fusion tensor, can provide information about the magnitude and directionality of water diffusion and give clues on the microstruc-tural properties of brain tissue.4Therefore, DTI is widely used in
assessing many brain diseases, such as multiple sclerosis (MS), Alzheimer disease, and schizophrenia, and monitoring their treatments.5-9
Moreover, by tracking principal diffusion direction, the primary eigenvector of the diffusion tensor, diffusion tensor tractography can reconstruct major white matter fiber tracts, such as the corpus callosum, cingulum, and pyramidal tract (PYT).10-12Wilson et al and Lin et al used the
tractography-based method to directly reconstruct the PYT of MS patients and quantified pathology related to specific impairment.13,14
However, in MS patients, FA has been found to be extremely
low in the normal-appearing white matter (NAWM), espe-cially in the MS lesions,6,7which might result in the unreliable
and erroneous termination of tractography. Taking this prob-lem into account, some authors used the tractography-based group mapping method15,16to construct a white matter fiber
tract probability map and then applied this map to normal subjects and patients to calculate diffusion indices inside the tract. Pagani et al used this kind of method to assess abnormal diffusion in the PYT of clinically isolated syndromes sugges-tive of MS patient.17
Although many studies have reported abnormal changes in MS by histogram and region-of-interest (ROI)– based meth-ods by using DTI,6,7,18there are few studies on specific white
matter fiber tracts of MS.13,14,17Some studies have reported that diffusion tensor eigenvalues can reflect specific pathologic or structural changes.2,19,20Diffusion tensor eigenvalues
re-flect the diffusion coefficients along the major, minor, and median axes of the diffusion ellipsoid. The axial diffusion co-efficient (1) reflects the diffusivity along the direction of
max-imum diffusion. The radial diffusion coefficient (23),
gener-ated by averaging the last 2 eigenvalues due to their similarities in magnitude,4reflects the diffusivity orthogonal to the
direc-tion of maximum diffusion. Therefore, our study used the diffusion tensor tractography– based group mapping to inves-tigate the presence of abnormal diffusion in the normal-ap-pearing PYT of RRMS and its possible mechanism.
Methods
Subjects
Thirty patients with clinically definite RRMS were enrolled in this study between April 2003 and July 2005. To reduce possible influence of particular large lesion load, 29 RRMS patients were included in the Received January 19, 2006; accepted after revision April 4.
From the National Laboratory of Pattern Recognition (F.L., T.J.), Institute of Automation, Chinese Academy of Sciences, Beijing, People’s Republic of China; and the Departments of Radiology (C.Y., K.L.) and Neurology (P.C.), Xuanwu Hospital of Capital University of Medical Sciences, Beijing, People’s Republic of China.
This work was partially supported by the Natural Science Foundation of China grant nos. 30425004, 30570509, 60121302, and 30470519, the National Key Basic Research and Development Program (973) grant no. 2004CB318107, and the Beijing Natural Science Foundation grant no. 7042026.
final statistical analysis (18 women and 11 men; mean age⫽32.8⫾ 9.9 years, range⫽18.0 –55.0 years). The diagnosis of RRMS was based on the criteria proposed by Lublin and Reingold.21Their mean dis-ease duration was 4.9⫾4.8 years (range⫽1.2–20.0 years), their mean Expanded Disability Status Scale (EDSS) score22 was 2.8 ⫾ 1.5 (range⫽0.0 –5.0), and their mean pyramidal functional system (PFS) score was 2.0⫾1.3 (range⫽0.0 – 4.0). Twenty sex- and age-matched healthy subjects (14 women and 6 men; mean age⫽32.2⫾10.6 years, range⫽18.0 –58.0 years) with no history of neurologic disorders and a normal neurologic examination were selected as control partici-pants. When MR images were obtained, none of the patients was experiencing an acute relapse or being treated with corticosteroids or other drugs within 2 months. Local Ethical Committee approval and written informed consent from all the subjects were obtained before study initiation.
MR Data Acquisition
All MR imaging was performed on a 1.5T MR scanner (Sonata; Sie-mens, Erlangen, Germany). All sections were positioned to parallel a line that joins the most inferoanterior and inferoposterior parts of the corpus callosum.23The following sequences with identical axial sec-tion posisec-tion, 30 secsec-tions, 4-mm secsec-tion thickness, and 0.4-mm in-tersection gap were obtained 1) turbo spin-echo T2-weighted imag-ing (500/94/3 [TR/TE/NEX], 11 echo-train length, 256⫻224 matrix, 24⫻21-cm2FOV, in-plane resolution 0.47⫻0.47 mm from 0.94⫻ 0.94 mm after zero filling and 2) a single-shot, spin-echo, echo-planar pulse (EPI) imaging (5000/100/10, 128⫻112 matrix, and 24⫻ 21-cm2FOV, in-plane resolution 0.94⫻0.94 mm from 1.98⫻1.98 mm after zero filling). The diffusion-sensitizing gradients were applied along 6 noncollinear directions with abvalue of 1000 s/mm2, together with an acquisition without diffusion weighting (b⫽0).
Data Analysis
The data were interpolated into isotropic voxels of 0.94 mm (matrix of 256⫻256⫻136), and the diffusion tensor for each voxel was derived according to the log-linear fitting algorithm.24After diago-nalization of the diffusion tensor, 3 eigenvalues (1,2,3) and their corresponding eigenvectors were obtained. Four quantitative indices including FA,Dav,1,and23were used to characterize the water diffusion in this study. These indices can be calculated by the follow-ing formula
1) Dav⫽
1⫹2⫹3
3 ,
FA⫽
冑
共1⫺2兲2⫹共
1⫺3兲2⫹共2⫺3兲2
冑
2共12⫹22⫹32兲,23⫽
2⫹3
2
Tractography-Based Group Mapping
Tractography is less reliable in MS patients than in healthy controls because FA is abnormally low in the NAWM, especially in MS le-sions,6,7which may cause the erroneous termination of tractography. Therefore, we first constructed the PYT probability map from healthy volunteer data based on the multiple ROI deterministic tractography-based method,11and then applied this probability map to RRMS pa-tients to calculate diffusion indices inside the PYT.
The PYT is known to be located in the middle third of the cerebral peduncle and the posterior limb of the internal capsule.25-28Thus, we manually delineated 2 ROIs on the axial planes. The first ROI was drawn on the middle third of the cerebral peduncle as seeding regions for tractography. The second ROI was drawn on the posterior limb of
the internal capsule, as filtering regions to make sure that the recon-structed fibers were the PYT. All ROIs were drawn on the FA maps.
Diffusion tensor tractography was performed on DTI images em-ploying the principal diffusion direction information based deter-ministic tracking algorithm by using the 4th-order Runge-Kutta method. First, each voxel in the first ROI was divided into 16 equal spaced starting seeds for tractography to reduce the partial volume effect. Then, tractography was performed by repeatedly following in small steps (0.3 mm) along the interpolated tensor field. Tractogra-phy was terminated if it made a turn of greater than 45° between 2 successive eigenvectors or if FA value of a voxel reached below 0.2.25 The tracked fibers were filtered by the second ROI to make sure that the reconstructed tract was the PYT.
After the PYT was reconstructed, the diffusion-unweighted im-ages of DTI (b⫽0) were normalized to the standard Montreal Neu-rologic Institute (MNI) space by using an EPI template with statistical parameter mapping (SPM2; Wellcome Department of Imaging Neu-roscience, London). The same transformation parameters were then applied to normalize the tracked PYT to the MNI space. After this, a PYT mask was created by calculating the voxels through which the PYT passed. Then, these masks for all healthy subjects were averaged to obtain the PYT probability map. The value of each voxel in map could be regarded as the probability that the voxel was part of the PYT.
Diffusion Indices of the PYT
The PYT probability map was used to calculate the weighted mean of the diffusion indices inside the PYT. The diffusion indices of the PYT were calculated as follows. First, theb⫽0 image for each subject was normalized to the MNI space to obtain the transformation parame-ters. The transformation parameters were then applied to normalize the corresponding diffusion indices maps (FA,Dav,1and23), and the PYT probability map was overlaid on these maps to calculate the weighted mean of the diffusion indices inside the PYT. For RRMS patients, it is necessary to analyze the diffusion prosperities in the PYT limited to lesions and the remaining normal-appearing PYT. To this end, lesions visible in the turbo spin-echo T2-weighted images were identified and manually extracted by an experienced radiologist with MRIcro (http://www.mricro.com). The lesions were also normalized to the MNI space to obtain the lesions distribution in the MNI space. Lesions were then used as masks to calculate the diffusion indices within the lesions and normal-appearing PYT. Moreover, lesion vol-ume within the PYT for each RRMS patient was also obtained by using the PYT probability map.
Statistical Analysis
For the traced PYT, FA,Dav,1, and23were used as its characteris-tics. The group comparisons of these indices were performed with the Mann-WhitneyUtest because their distributions are non-Gauss-ian.29,30Correlations between these indices and EDSS scores or PFS scores or lesion volumes were assessed by the Spearman correlation analysis. APvalue of less than .01 was considered statistically signif-icant, and a value between .01 and .05 was considered a trend.31
Results
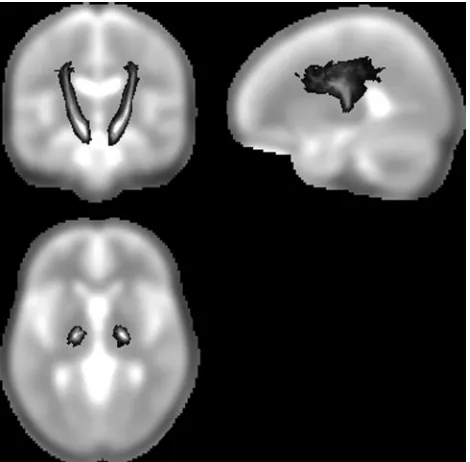
In this study, we concentrated our analysis on the portion of the PYT that includes the cerebral peduncle and the internal capsule, which are regions of high orientation coherence. Fig-ure 1 illustrates this part of PYT probability map from data on healthy controls. The gray-scale indicates the probability of a voxel being part of the PYT.
BRAIN
ORIGINAL
Compared with healthy controls, RRMS patients had a sig-nificantly higherDavand23and a lower FA, with a trend
toward lower on1in the normal-appearing PYT (P⬍.001
for Dav;P⬍.0001 for23;P⬍.0001 for FA;P⫽.019 for1;
Table). In RRMS patients, PYT lesions had a significantly higher23, a lower FA, and no difference onDavand1when
compared with normal-appearing PYT (P⫽.007 for23;P⬍
.0001 for FA;P⫽.051 for1;P⫽.247 forDav; Table).
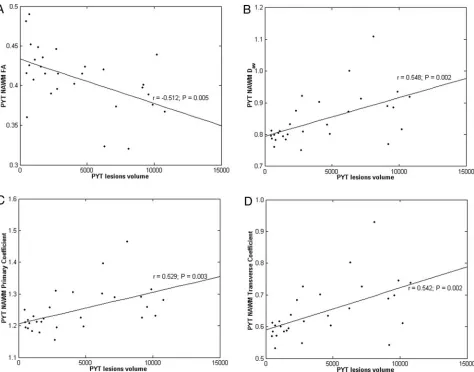
The PYT lesion volumes correlated well with the FA (r⫽
⫺0.512,P⫽.005),Dav(r⫽0.548,P⫽.002),1(r⫽0.529, P⫽.003), and23(r⫽0.542,P⫽.002) all derived from the
normal-appearing PYT (Fig 2).
Additionally, our method also required manually drawing 2 ROIs on sections. To test the reproducibility, 2 raters who were blind to the data drew these ROIs independently in 10 subjects randomly selected from the group of healthy subjects. The PYT probability map was constructed and the weighted mean of diffusion indices were calculated for the RRMS pa-tients. Then intraclass correlation coefficients for inter-rater reliability were determined. For these indices, these coeffi-cients ranged from 0.95 to 0.98.
Discussion
In this study, 4 indices derived from the diffusion tensor were used to investigate the presence of abnormal diffusion on the normal-appearing PYT of RRMS patients on the basis of a diffusion tensor tractography– based group mapping meth-od.15,16Statistical analysis revealed that overall diffusivity and
diffusion anisotropy of the normal-appearing PYT were sig-nificantly altered in RRMS patients.
In our study, we found that RRMS patients had a signifi-cantly higherDavand23and a lower FA, with a trend toward
lower on1in the normal-appearing PYT when compared
with normal controls (Table). These findings indicated that RRMS patients have abnormal diffusion in the normal-ap-pearing PYT. The underlying pathologies may be axonal loss,
decreases of axonal attenuation, increased extracellular space, and gliosis. Analysis of changes of diffusion tensor eigenvalues may provide more information about pathology.1, which
measures the diffusivity parallel to the main fiber direction, reflects the changes of restricted barriers along the direction of a fiber tract and the alterations of extracellular space.23,
which measures the diffusivity perpendicular to the main di-rection of fibers, reflects the changes of axonal membrane, myelin sheath, extracellular space, and so on.2,29Membrane disintegration and gliosis may create new diffusion barriers in the direction of a fiber tract and thus result in a decrease in diffusivity parallel to the main fiber direction and in reduced 1.29,32,33 Loss of axonal structures may lead to the less
re-stricted diffusion perpendicular to the main direction of fibers and to increased23.29,32,33In combination, these effects are
expected to lead to reduced FA and increasedDav.
The etiology of abnormal diffusion in the normal-appear-ing PYT for RRMS patients may be caused by wallerian degen-eration. Recent studies have attempted to better delineate the diffusion changes associated with wallerian degeneration.19,20
Pierpaoli et al19studied wallerian degeneration in the cortical spinal tract of patients with internal capsule lesions a year after stoke. Their results indicated reduced diffusion along the fi-bers (1) and increased diffusion transverse to the fibers (2
and3; in our study,23). Henry et al20examined the role of
directional dependence of the apparent diffusion coefficients in the evaluation of normal-appearing brain regions of RRMS patients. They found reduced anisotropy and increased appar-ent diffusion coefficiappar-ents with increased diffusion transverse to the fibers in regions with high anisotropy, such as the cor-pus callosum and internal capsule. They also attributed the pathology to wallerian degeneration.
The diffusion indices derived from the normal-appearing PYT correlated well with PYT lesion volumes (Fig 2), which fur-ther suggests that wallerian degeneration resulted in the abnor-mal diffusion in the PYT of our group of RRMS patients. Several previous studies have found some measurements of axonal atten-uation correlated with lesion volumes and used these correlations as evidence for the predominance of wallerian degenera-tion.17,34-36Pagani et al17found that the diffusion indices from
normal-appearing PYT correlated well with PYT lesion volumes in clinically isolated syndrome patients, and they concluded that these correlations reflected the presence of wallerian degenera-tion. Evangelou et al,34Ge et al,35and Oh et al36also found strong
correlations between diffusion indices and lesion volumes and concluded that they reflected wallerian degeneration.
In our study, there were no correlations between any dif-fusion indices from the PYT and either EDSS or PFS score except that FA from the normal-appearing PYT showed a trend toward correlation with PFS scores. This might be be-cause EDSS is a general scale that quantifies disability in 8 functional systems, whereas we concentrated only on the PYT for RRMS patients. Only FA from the normal-appearing PYT showed a trend toward correlation with PFS scores. This might be because of the low number of patients studied or it may also indicate that FA is more sensitive than other diffusion indices in monitoring treatment in RRMS patients.
There are several possible limitations in our study. First, due to the limitations of the streamline method for crossing fibers, espe-cially at the level of the pons, the whole PYT cannot be consis-Fig 1.The pyramidal tract (PYT) probability map. The gray-scale overlay indicates the
[image:3.585.53.288.42.273.2]tently traced for each subject. Improved tractography methods need to be developed to address this problem. Second, the poor resolution of the DTI sequences may have slightly influenced our measurements, and thus a higher resolution MR scanner may improve the reliability of diffusion measurements.
Conclusion
In this paper, diffusion tensor tractography– based group mapping was used to detect the abnormal diffusion in the normal-appearing PYT of RRMS patients. We found that RRMS patients had a significantly higherDavand23and a
lower FA, as well as a trend toward lower1in the
normal-appearing PYT when compared with normal controls, which might be caused by wallerian degeneration. In conclusion, this quantitative measurement approach of diffusion tensor trac-tography– based group mapping can detect subtle pathologic abnormalities beyond macroscopic lesions in white matter fi-ber tracts in MS; additionally, it can provide further anatomic insights into mechanisms of white matter damage and may also increase the specificity of DTI in the monitoring of spe-cific neurologic deficits in MS. This method can also be used to investigate abnormal diffusion in other white matter fiber
Group comparisons of diffusion indices in the pyramidal tract (PYT) between the lowest section of the cerebral peduncle and the uppermost section of the lateral ventricle
Controls
RRMS Patients PValues
NA PYT PYT Lesions
Controls Versus NA PYT
NA PYT Versus PYT Lesions
FA 0.46⫾0.02 0.41⫾0.04 0.34⫾0.05 ⬍.0001 ⬍.0001
Dav 0.75⫾0.02 0.85⫾0.08 0.87⫾0.09 ⬍.0001 .247
1 1.28⫾0.03 1.25⫾0.07 1.21⫾0.10 .019 .051
23 0.54⫾0.02 0.65⫾0.09 0.70⫾0.10 ⬍.0001 .007
Note:—RRMS indicates relapsing-remitting multiple sclerosis; NA, normal-appearing; FA, fractional anisotropy;Dav, directionally averaged diffusion coefficient (⫻10-3mm2/s);1, axial diffusion coefficient (⫻10-3
mm2
/s);23, radial diffusion coefficient (⫻10 -3
mm2
/s). The group mean⫾SD for the diffusion indices (Mann-WhitneyUtest) is reported in the second through fourth columns. APvalue of⬍.01 is considered statistically significant, whereas a value between .01 and 0.05 is considered to represent a trend. ThePvalues indicated that RRMS has abnormal diffusion in the normal-appearing PYT.
Fig 2.Correlation and scatter plots of diffusion indices derived from normal-appearing pyramidal tract (NA PYT) versus PYT lesion volumes. Scatter plots are shown of (A) fractional anisotropy (FA), (B) directionally averaged diffusion coefficient (Dav,⫻10
-3 mm2
/s), (C) axial diffusion coefficient (1,⫻10 -3
mm2
/s), and (D) radial diffusion coefficient (23,⫻10 -3
[image:4.585.58.532.185.557.2]tracts in a variety of neurologic conditions, including MS, stroke, cerebral tumors, dementia, and psychiatric disorders.
Acknowledgments
The authors are very grateful to the anonymous reviewers for their significant and constructive comments and suggestions, which greatly improved the article.
References
1. Basser PJ, Mattiello J, LeBihan D.MR diffusion tensor spectroscopy and imag-ing.Biophys J1994;66:259 – 67
2. LeBihan D.Looking into the functional architecture of the brain with diffu-sion MRI.Nat Rev Neurosci2003;4:469 – 80
3. LeBihan D, Mangin JF, Poupon C, et al.Diffusion tensor imaging: concepts and applications.J Magn Reson Imaging2001;13:534 – 46
4. Basser PJ, Pierpaoli C.Microstructural and physiological features of tissues elucidated by quantitative diffusion tensor MRI.J Magn Reson B1996;111: 209 –19
5. Sundgren PC, Dong Q, Gomez-Hassan D, et al.Diffusion tensor imaging of the brain: review of clinical applications.Neuroradiology2004;46:339 –50 6. Filippi M, Cercignani M, Inglese M, et al.Diffusion tensor magnetic resonance
imaging in multiple sclerosis.Neurology2001;56:304 –11
7. Griffin CM, Chard DT, Ciccarelli O, et al.Diffusion tensor imaging in early relapsing-remitting multiple sclerosis.Mult Scler2001;7:290 –7
8. Moseley M, Bammer R, Illes J.Diffusion-tensor imaging of cognitive perfor-mance.Brain Cogn2002;50:396 – 413
9. Lim KO, Helpern JA.Neuropsychiatric applications of DTI—a review.NMR Biomed2002;15:587–93
10. Basser PJ, Pajevic S, Pierpaoli C, et al.In vivo fiber tractography using DT-MRI data.Magn Reson Med2000;44:625–32
11. Conturo TE, Lori NF, Cull TS, et al.Tracking neuronal fiber pathways in the living human brain.Proc Natl Acad Sci USA1999;96:10422–27
12. Mori S, Crain BJ, Chacko VP, et al.Three-dimensional tracking of axonal projections in the brain by magnetic resonance imaging. Ann Neurol
1999;45:265– 69
13. Wilson M, Tench CR, Morgan PS, et al.Pyramidal tract mapping by diffusion tensor magnetic resonance imaging in multiple sclerosis: improving correla-tions with disability.J Neurol Neurosurg Psychiatry2003;74:203– 07 14. Lin X, Tench CR, Morgan PS, et al.‘Importance sampling’ in MS: use of
diffu-sion tensor tractography to quantify pathology related to specific impair-ment.J Neurol Sci2005;237:13–19
15. Xu D, Mori S, Solaiyappan M, et al.A framework for callosal fiber distribution analysis.Neuroimage2002;17:1131– 43
16. Ciccarelli O, Toosy AT, Parker GJ, et al.Diffusion tractography based group mapping of major white-matter pathways in the human brain.Neuroimage
2003;19:1545–55
17. Pagani E, Filippi M, Rocca MA, et al.A method for obtaining tract-specific diffusion tensor MRI measurements in the presence of disease: application to
patients with clinically isolated syndromes suggestive of multiple sclerosis.
Neuroimage2005;26:258 – 65
18. Cercignani M, Inglese M, Pagani E, et al.Mean diffusivity and fractional an-isotropy histograms of patients with multiple sclerosis.AJNR Am J Neurora-diol2001;22:952–58
19. Pierpaoli C, Barnett A, Pajevic S, et al.Water diffusion changes in wallerian degeneration and their dependence on white matter architecture.Neuroimage
2001;13:1174 – 85
20. Henry RG, Oh J, Nelson SJ, et al.Directional diffusion in relapsing-remitting multiple sclerosis: a possible in vivo signature of wallerian degeneration.J Magn Reson Imaging2003;18:420 –26
21. Lublin FD, Reingold RC.Defining the clinical course of multiple sclerosis: results of an international survey.Neurology1996;46:907–11
22. Kurtzke JF.Rating neurological impairment in multiple sclerosis: an ex-panded disability status scale (EDSS).Neurology1983;33:1444 –52 23. Miller DH, Barkhof F, Berry I, et al.Magnetic resonance imaging in monitoring
the treatment of multiple sclerosis: concerted action guidelines.J Neurol Neu-rosurg Psichiatry1991;54:683– 88
24. Basser PJ, Mattiello J, LeBihan D.Estimation of the effective self-diffusion tensor from the NMR spin echo.J Magn Reson B1994;103:247–54
25. Kunimatsu A, Aoki S, Masutani Y, Abe O, et al.The optimal trackability thresh-old of fractional anisotropy for diffusion tensor tractography of the cortico-spinal tract.Magn Reson Med Sci2004;3:11–17
26. Englander RN, Netsky MR, Adelman LS.Location of human pyramidal tract in the internal capsule: anatomic evidence.Neurology1975;25:823–26 27. Glenn OA, Henry RG, Berman JI, et al.DTI-based three-dimensional
tractog-raphy detects differences in the pyramidal tracts of infants and children with congenital hemiparesis.J Magn Reson Imaging2003;18:641– 48
28. Lee JS, Han MK, Kim SH, et al.Fiber tracking by diffusion tensor imaging in corticospinal tract stroke: topographical correlation with clinical symptoms.
Neuroimage2005;26:771–76
29. Pierpaoli C, Basser PJ.Toward a quantitative assessment of diffusion anisot-ropy.Magn Reson Med1996;36:893–906
30. Pajevic S, Basser PJ.Parametric and non-parametric statistical analysis of DT-MRI data.J Magn Reson2003;161:1–14
31. Nijeholt GJ, van Walderveen MA, Castelijns JA, et al.Brain and spinal cord abnormalities in multiple sclerosis. Correlation between MRI parameters, clinical subtypes and symptoms.Brain1998;121:687–97
32. Thomalla G, Glauche V, Koch MA, et al.Diffusion tensor imaging detects early Wallerian degeneration of the pyramidal tract after ischemic stroke. Neuro-image2004;22:1767–74
33. Kobayashi S, Hasegawa S, Maki T, et al.Retrograde degeneration of the corti-cospinal tract associated with pontine infarction.J Neurol Sci2005;236:91–93 34. Evangelou N, Konz D, Esiri MM, et al.Regional axonal loss in the corpus callosum correlates with cerebral white matter lesion volume and distribu-tion in multiple sclerosis.Brain2000;123:1845– 49
35. Ge Y, Law M, Johnson G, et al.Preferential occult injury of corpus callosum in multiple sclerosis measured by diffusion tensor imaging.J Magn Reson Imag-ing2004;20:1–7