ORIGINAL RESEARCH
MR Diffusion Tensor Imaging and Fiber Tracking
in Inflammatory Diseases of the Spinal Cord
J. Renoux D. Facon P. Fillard I. Huynh P. Lasjaunias D. Ducreux
PURPOSE:Our aim was to study the fractional anisotropy (FA) variations and the fiber tracking (FT) patterns observed in patients with myelitis.
MATERIAL AND METHODS: Fifteen patients with symptomatic myelitis and 11 healthy subjects were prospectively selected. We performed T2-weighted and diffusion tensor imaging on a 1.5T MR scanner. FA and apparent diffusion coefficient maps were computed in both healthy subjects and patients. In each patient, we performed FT to study pathologic aspects on this imaging method. FA data were analyzed by usingz-scores.
RESULTS: For the healthy subjects, averaged FA values ranged from 0.745 to 0.751. All abnormal areas seen on T2-weighted imaging had a significantly decreased FA value. In 9 patients (60%), FA maps showed decreased FA areas, whereas T2-weighted imaging findings were normal. These areas matched the neurologic deficit in 33%. Eighty percent of patients had multiple decreased FA areas. Five patients (33%) had increased FA values in normal T2-weighted areas.
CONCLUSION:We observed specific FA and FT pattern variations in patients with myelitis.
M
yelitis represents a heterogeneous group of disorders with various etiologies, such as viral or bacterial infec-tions, autoimmune disorders, and multiple sclerosis. It can result in disabling motor and sensory dysfunctions. Diagnosis depends on clinical manifestations, blood or CSF study, and MR imaging findings.1MR imaging is first required to rule out spinal cord com-pression and is a support for initial diagnosis; then it is used to assess treatment efficacy in the follow-up. When the spinal cord is involved, MR imaging shows abnormal signal intensity on T2-weighted imaging sequences. However, MR imaging findings can be normal, whereas diagnosis is established on the basis of clinical and biologic abnormalities.2Preliminary stud-ies3-4previously assessed the feasibility of MR imaging spinal cord studies by using diffusion-weighted imaging (DWI) and diffusion tensor imaging (DTI). DTI is an MR imaging tech-nique that evaluates the scalar properties of the diffusivity of extracellular water molecules within the white matter fibers5 and enables the reconstruction of 3D images of white matter tracts in the spinal cord6by using specialized fiber tracking (FT) algorithms. Fractional anisotropy (FA), a parameter de-rived from DTI computations, reflects the global anisotropy of the analyzed structure. FA values depend on the water diffu-sivity in the extracellular space along the axon fibers. Param-eters like myelination and axonal membrane thickness and changes in extra- or intracellular components can affect FA values. The closer to 1 the FA value is, the more anisotropic is this structure.
In the spinal cord, decreased FA values may be related to an increase of the extracellular space (dysmyelination, axonal loss, unpacking of white matter fibers, and so forth) as well as a decrease of the intracellular space (edema). It has been pre-viously reported that DTI with FA computation is more
sen-sitive than T2-weighted imaging in multiple sclerosis to detect white matter involvement.7 We, therefore, studied the FA variations in patients with myelitis and tried to assess FT 3D reconstructions to locate the lesions precisely.
Materials and Methods
Subjects
Fifteen patients (6 women, 9 men; ages ranging from 20 to 64 years of age; mean age, 42.9 years), referred to our institution from the neu-rology department, were prospectively selected between May 2004 and October 2004. The inclusion criterion was a clinical diagnosis of myelitis (complete patient history, biologic features like CSF and se-rum analysis, and neurologic deficit compatible with medullar in-volvement). Exclusion criteria were the following: the presence of spinal cord compression, previous spine surgery, spine radiation therapy, or contraindication to MR imaging. Myelitis etiologies were the following: multiple sclerosis (9 patients, 60%), neurosarcoidosis (3 patients, 20%), transverse myelitis (2 patients, 13%), polyradicu-loneuritis (1 patient, 7%). Five patients (33%) had acute or subacute symptoms (for⬍3 weeks). As a control group, we used the DTI data-sets of previously enrolled healthy volunteers8(8 men, 3 women; ages ranging from 20 to 67 years; mean age, 36.7 years). Our MR imaging protocol was approved by our institutional board, and all patients gave informed consent.
MR Imaging Technique, Image Analysis, and Fiber-Tracking Procedure
We used MR imaging techniques similar to those previously report-ed,8except for the DTI directions, which were 25 instead of 6. Image analysis and FT procedures remained unchanged. On the healthy vol-unteers, we tested 4bvalues (300, 500, 750, and 1000 s/mm2) to assess the feasibility of the FT reconstruction for eachbvalue. The software we used (DPTools, http://www.fmritools.org) had thresholding FA values of 0.17 and a transition angle of 45°.
Measurements
In healthy volunteers and patients, apparent diffusion coefficient (ADC) and FA measurements were made at 3 different levels (cervi-cal, C2 through C5; high thoracic, T1 through T6; and low thoracic,
Received November 18, 2005; accepted after revision January 2, 2006.
From the Department of Neuroradiology (J.R., D.F., I.H., P.L., D.D.), CHU de Biceˆtre, Le Kremlin Biceˆtre, France; and INRIA (P.F.), SophiaAntipolis, Nice, France.
Please address correspondence to: Denis Ducreux, Department of Neuroradiology, CHU de Biceˆtre, Paris XI University, 78 rue du Ge´ne´ral Leclerc, 94270 Le Kremlin Biceˆtre, France; e-mail: [email protected]
SPINE
ORIGINAL
T7 through T12) by using regions of interest (ROIs, averaged area⫽ 20 mm2; 10 voxels) on the spinal cord and the most accurate bo image and then were reported on FA maps. Special attention was paid to avoid partial CSF volume effect, magnetic susceptibility effects, and motion artifacts in ROI selection. A reference data base was created with pooled FA spinal cord measurements at different levels. The ROIs in patients and healthy volunteers were matched in size.
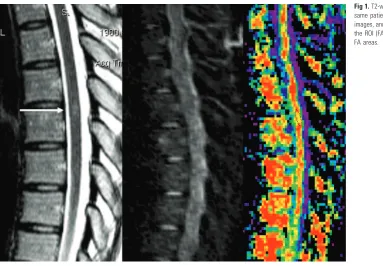
Two neuroradiologists independently assessed the presence of ab-normal hyperintense areas on T2-weighted images and performed ADC and FA measurements on the patients’ spinal cords. ADC and FA measurement variations were compared between the 2 neurora-diologists to assess interobserver variability and were repeated to as-sess intraobserver variability. Complementary ADC and FA measure-ments were made at the precise site of myelitis seen on bo images (and correlated to T2 images (Fig 1). When no abnormality was seen on these images, we set the ROI on the spinal cord level that matched the neurologic deficit. FT 3D reconstructions were coregistered on bo and then on FA parametric maps by using our dedicated software.8
Statistical Analysis
Analyses were performed by using SPSS software (SPSS, Chicago, Ill). Data of healthy volunteers and patients were described by using mean, SD, and minimal and maximal values for quantitative vari-ables. We first calculated the mean FA for cervical, high thoracic, and low thoracic spinal cord levels in all the healthy volunteers. Then we measured the FA in patients at lesion level and computedzscores by using the mean and SD values obtained in volunteers at the same level. Abnormal values were those of z ⬎1.96 (P⬍.05).
Results
The results for healthy volunteers are reported in Table 1. In healthy volunteers, normal ADC values ranged from 0.96⫻ 10⫺3mm2/s to 1.05⫻10⫺3mm2/s, and normal averaged FA values ranged from 0.745 to 0.751. The results for patients are reported in Tables 2–5. There was a statistically significant
difference between FA measurements performed at the myeli-tis site (Z-score⫽5.9) in healthy volunteers and patients.
All patients (100%) had 1 (100%) or multiple (80%) focal areas of decreased FA values (mean value, 0.59⫾0.089), but only 12 patients (80%) had abnormal T2-weighted imaging areas. In 5 of these 12 patients, clinical manifestations matched abnormal areas seen on T2-weighted imaging. Nine patients had decreased FA value areas that were normal on T2-weighted imaging but matched the clinical deficit in 3 of the 9 patients. Five patients (33%; 3 with multiple sclerosis, 1 with polyradiculoneuritis (PRN), and 1 with sarcoidosis) had in-creased FA values in normal T2-weighted areas. None of these areas matched the neurologic deficit. These areas were either adjacent to the lesions seen on FA maps or far from these lesions.
[image:2.585.55.438.39.305.2]ADC and FA measurement variations had a good intra-and interobserver (2 neuroradiologists performing ROI posi-tioning 4 times independently) reproducibility (⫾5% in both cases). ADC was increased in 1 patient with multiple sclerosis, decreased in 3 patients (1 multiple sclerosis, 1 PRN, and 1 sarcoidosis), and was normal in 1 patient with multiple scle-rosis. In 2 of these 3 patients with increased FA and decreased ADC (67%), clinical manifestations were acute. The last pa-tient had intensive immunosuppressive therapy. When in-creased and dein-creased FA areas were situated side by side, ADC was high or normal. When these areas were far from each other, ADC was low (Fig 2).
Table 1: Comparison of FA values according to medullar level in healthy volunteers
Average SD Median Minimum Maximum
Fractional anisotropy 0.748 0.027 0.743 0.700 0.800
Cervical 0.748 0.031 0.747 0.700 0.780
High dorsal 0.751 0.027 0.740 0.720 0.800
Low dorsal 0.745 0.027 0.74 0.714 0.800
[image:2.585.300.534.344.400.2]Fiber tracking performed on the spinal cord showed the main white matter tracts (posterior corticospinal tracts with nerve root visualization and posterior cordonal tracts) in all healthy volunteers and patients (Fig 3). FT showed spreading fibers in the spinal cord areas that were abnormal on the T2-weighted imaging and in the areas that were normal on the
T2-weighted imaging but had abnormal FA values (Fig 4). In 3 patients, FT also showed fiber interruption in these areas (Fig 5). We found thatbvalues above 500 yielded altered 3D FT reconstructions (with many holes in the white matter tracts) due to the high-signal-intensity attenuation. Values below 500 had too many T2 shinethrough effects and yielded aberrant white matter tracts.
Discussion
The diagnosis of myelitis is usually assessed on the basis of clinical data, and MR imaging shows the white matter tract involvement. This T2-weighted evidence is inconstant, and previous studies reported MR imaging to have a low sensitivity index for the detection of spinal cord myelopathies.2
DTI MR imaging performed in spinal cord diseases has been reported to improve the diagnostic sensitivity of chronic spinal injury.8-10To our knowledge, no one has studied the FA variations in myelitis, regardless of the fact that the FA param-eter has the advantage of a better directional evaluation of
Fig 2.ADC variation patterns and increased FA area locations. MS indicates multiple sclerosis.
Table 3: Patients’ results with estimate of fractional anisotropy
Decreased FA zScore Increased FA zScore
Mean 0.588604 5.9036 0.839383 3.3845
SD 0.08908 0.01635
Minimum 0.305652 0.813968778
[image:3.585.300.532.58.113.2]Maximum 0.689711 0.867223598
Table 4: Average fractional anisotropy (FA) values in patients in the normal and abnormal spinal cord areas
Average SD Median Minimum
FA
Healthy level 0.743 0.034 0.740 0.690
Pathologic 0.588 0.089 0.590 0.306
[image:3.585.60.287.62.619.2]Note:—FA values were abnormal whenz ⬎1.96.
Table 5: T2-weighted imaging observed in patients and volunteers
Patients Healthy Volunteers
Normal T2 signal 3 11
High T2 signal 12 0
[image:3.585.300.533.229.274.2]15 11
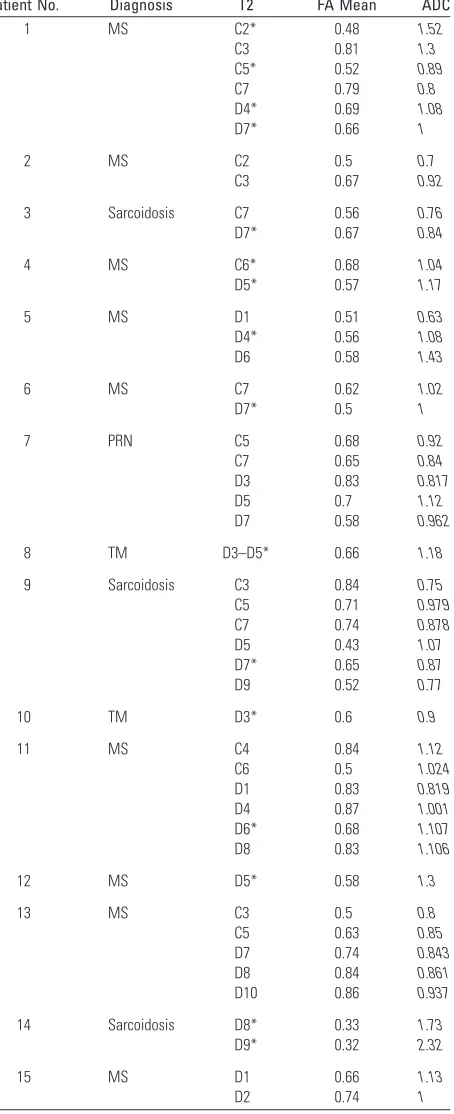
Table 2: Selected patient data
Patient No. Diagnosis T2 FA Mean ADC
1 MS C2* 0.48 1.52
C3 0.81 1.3
C5* 0.52 0.89
C7 0.79 0.8
D4* 0.69 1.08
D7* 0.66 1
2 MS C2 0.5 0.7
C3 0.67 0.92
3 Sarcoidosis C7 0.56 0.76
D7* 0.67 0.84
4 MS C6* 0.68 1.04
D5* 0.57 1.17
5 MS D1 0.51 0.63
D4* 0.56 1.08
D6 0.58 1.43
6 MS C7 0.62 1.02
D7* 0.5 1
7 PRN C5 0.68 0.92
C7 0.65 0.84
D3 0.83 0.817
D5 0.7 1.12
D7 0.58 0.962
8 TM D3–D5* 0.66 1.18
9 Sarcoidosis C3 0.84 0.75
C5 0.71 0.979 C7 0.74 0.878
D5 0.43 1.07
D7* 0.65 0.87
D9 0.52 0.77
10 TM D3* 0.6 0.9
11 MS C4 0.84 1.12
C6 0.5 1.024 D1 0.83 0.819 D4 0.87 1.001 D6* 0.68 1.107 D8 0.83 1.106
12 MS D5* 0.58 1.3
13 MS C3 0.5 0.8
C5 0.63 0.85
D7 0.74 0.843 D8 0.84 0.861 D10 0.86 0.937
14 Sarcoidosis D8* 0.33 1.73
D9* 0.32 2.32
15 MS D1 0.66 1.13
D2 0.74 1
Note:—FA indicates fractional anisotropy; ADC, apparent diffusion coefficient; MS, mul-tiple sclerosis; TM, transverse myelitis; PRN, polyradiculoneuritis.
[image:3.585.316.515.524.703.2]water diffusivity (due to its scalar information)in abnormal areas, as previously reported in brain diseases.11
In our study, we decided to investigate the use of this pa-rameter in myelitis. In the spine, surrounding bone causes susceptibility artifacts. DTI MR imaging yields voxel signal-intensity attenuation on the DWI. The higher thebvalue is, the higher is the signal intensity attenuation. Among the 4b values we tested,bvalues above 500 yielded altered 3D FT reconstructions (with many holes in the white matter tracts) because of the high-signal-intensity attenuation. Values below 500 had too many T2 shinethrough effects and yielded aber-rant white matter tracts. We, therefore, concluded thatbvalue of 500 was the most accurate for FT purposes.
Previous studies, centered only on the cervical spine in healthy volunteers,3,12reported FA values ranging from 0.52 to 0.83.4,12The FA values we found matched and supple-mented these results because we reported values from the cer-vical to the lower thoracic spine. In setting ROIs, we had to pay special attention to avoid partial volume effects due to the CSF around the spinal cord, which, when included in ROI, may have decreased the FA values. A specialized segmentation al-gorithm, which could automatically separate spinal cord from CSF, would have enabled us to perform the measurements faster and to reduce the problem of partial volume effects of the ROI method, but we unfortunately lacked such software. To avoid the CSF pitfall, we had to draw ROIs over both gray and white matter inside the cord; therefore, the values we re-ported were gray and white averaged FA values. Spinal white matter fibers have a craniocaudal orientation and thus are very anisotropic, contrary to gray matter, which is more isotropic.
FA values reflect the global anisotropy of an analyzed struc-ture. The closer to 1 the FA values, the more anisotropic is the structure; conversely, the closer to 0 the FA values, the more isotropic is the structure. When compared with values re-ported in experimental studies that found 0.92 in white matter and 0.59 in gray matter,13our results corresponded to the average of these 2 components, ROIs covering both gray and white matter.
The FA parameter has a good sensitivity of 80%8to detect abnormal areas inside the cord and is even better than conven-tional T2-weighted imaging; this finding confirms results from previous studies8and is probably due to a complete eval-uation of the water diffusivity by using scalar properties of the DTI sequence. All patients had decreased FA values, suggest-ing either local extracellular edema or a decreased number of fibers that matched an increased extracellular space or both.
Nevertheless, we observed increased FA values in 5 patients with myelitis. To our knowledge, this has never been reported, even in experimental studies, but may be due to modifications of the extracellular compartment. These data suggest either intracellular edema with inflow of the extracellular water in axon or in Schwann cells or suggest decreased extracellular space due to cellular infiltration by inflammatory cells. In our study, areas with increased FA never corresponded to the le-sions and were adjacent to them or far from them. ADC as-sessment showed an increased or normal extracellular space in 2 patients with multiple sclerosis and a decreased one in the other patients, maybe due to the wallerian degeneration,14in which a reduction of the extracellular space may be observed when the Schwann sheath gets thicker after axonal degenera-Fig 3.3D FT reconstruction of the cervical cord in a healthy subject.
[image:4.585.58.505.39.343.2]tion or when clusters of regeneration appear. A time gradient may exist in myelitis, with early decrease of extracellular space far from the lesion and normalization at the chronic phase. Larger studies focused on that point would clarify these findings.
Experimental studies15have highlighted the usefulness of FA parameters to assess response to a neuroprotective therapy. These data suggest that FA and ADC values correlated with clinical history could help distinguish old and active lesions, to decide whether treatment is necessary or to assess its efficacy. This study emphasizes some specific aspects of myelitis and may help with diagnosis: Multiplicity of the lesions (some of them are not seen on the regular T2-weighted imaging) is the main indication (we found more than 1 lesion in 80% of the patients). Patients with increased FA areas away from and next to the lesions have never been described in other studies and may correspond to a specific pattern of multiple sclerosis. We used fast spin-echo T2-weighted imaging as a reference stan-dard to assess the number and the location of spinal cord le-sions, but we should have used other imaging techniques (such as shortinversion recovery [STIR] or gradient-echo T2-weighted imaging) that are known to be more accurate in detecting lesions. It would have been interesting to correlate FA lesion-detection capabilities with STIR, for example. This may be done in a future work.
FT seems to be more than just a visualization tool of the white matter tracts inside the spine. Anatomic correlations with corticospinal and lemniscal pathways are excellent. Moreover, it can readily be used in clinical routine to view the inflammatory tracts and can help establish a positive diagnosis of spinal cord anomaly by locating the precise pathologic area. Our material allowed a qualitative study on FT, but we could not find any objective pathologic criteria. Therefore, we only reported the different aspects seen on pathologic areas.
Interrupted fibers on FT maps corresponded to FA values below 0.17 or a rupture angle of 45°, and this aspect did not mean that fibers were actually interrupted. We believed that the other aspect with spreading fibers corresponded to edema, but we did not have any objective proof. This hypothesis has to be explored by further studies.
Current research on the brain using DTI is performed with
⬎25 gradient directions.16 Adding gradient directions may
help improve the scalar sampling of water diffusivity and may correct some known pitfalls of the echo-planar imaging se-quence on 3D reconstructions.16Despite these drawbacks, the images we obtained were of sufficient quality to analyze FA variations in myelitis, and FT helped us see the precise site of involvement and make a positive diagnosis.
Conclusion
In this study, we found that FA detected spinal cord abnormal-ities in patients with myelitis better than T2-weighted imag-ing. Moreover, we found specific patterns of myelitis with DTI because it showed other pathologic areas not seen with routine imaging. This finding derived from DTI MR images may help assess the positive diagnosis. Larger studies are needed to bet-ter understand the pathophysiology of FA variations in myeli-tis. Spinal cord FT enables the visualization of the main white matter tracts in the spinal cord and shows involved areas that are otherwise invisible. It could become a useful tool to visu-alize diseases from nerve root to brain.
References
1. Spitzer C, Krings T, Block F.Inflammatory diseases of the spinal cord. Radio-loge2001;41:968 –75
2. Scotti G, Gerevini S.Diagnosis and differential diagnosis of acute transverse myelopathy: the role of neuroradiological investigations and review of the literature.Neurol Sci2001;22(suppl 2):S69 –73
3. Holder C, Muthupillai R, Mukundan S, et al.Diffusion-weighted MR imaging of the normal human spinal cord in vivo.AJNR Am J Neuroradiol2000;21: 1799 – 806
4. Cercignani M, Horsfield M, Agosta F, et al..Sensitivity-encoded diffusion tensor MR imaging of the cervical cord.AJNR Am J Neuroradiol2003;24: 1254 –56
5. Jones DK, Griffin LD, Alexander DC, et al.Spatial normalization and averaging of diffusion tensor MRI data sets.Neuroimage2002;17:592– 617
6. Wheeler-Kingshott C, Hickman S, Parker G, et al.Investigating cervical spinal cord structure using axial diffusion tensor imaging.Neuroimage2002;16:93– 102
7. Cassol E, Ranjeva JP, Berry I.Diffusion tensor imaging in multiple sclerosis: a tool for monitoring changes in normal-appearing white matter.Mult Scler 2004;10:188 –96
8. Demir A, Ries M, Moonen C, et al.Diffusion-weighted MR imaging with ap-parent diffusion coefficient and apap-parent diffusion tensor maps in cervical spondylotic myelopathy.Radiology2003;229:37– 43
9. Tsuchiya K, Katase S, Fujikawa A, et al.Diffusion-weighted MRI of the cervical spinal cord using a single-shot fast spin-echo technique: findings in normal subjects and in myelomalacia.Neuroradiology2003;45:90 –94. Epub 2003 Jan 15
10. Higano S, Zhong J, Shrier DA, et al.Diffusion anisotropy of the internal capsule and the corona radiata in association with stroke and tumors as measured by diffusion-weighted MR imaging.AJNR Am J Neuroradiol 2001;22:456 – 63
11. Ries M, Jones R, Dousset V, et al.Diffusion tensor MRI of the spinal cord.Magn Reson Med2000;44:884 –92
12. Elshafiey I, Bilgen M, He R, et al.In vivo diffusion tensor imaging of rat spinal cord at 7 T.Magn Reson Imag2002;20:243– 47
13. Facon D, Ozanne A, Fillard P, et al.MR diffusion tensor imaging and fiber tracking in spinal cord compression.AJNR Am J Neuroradiol2005;26:1587–94 14. Ciccarelli O, Werring DJ, Thompson AJ.A study of the mechanisms of normal-appearing white matter damage in multiple sclerosis using diffusion tensor imaging: evidence of Wallerian degeneration.J Neurol2003;250:287–92 15. Nevo U, Hauben E, Yoles E, et al.Diffusion anisotropy MRI for quantitative
assessment of recovery in injured rat spinal cord.Magn Reson Med2001;45: 1–9