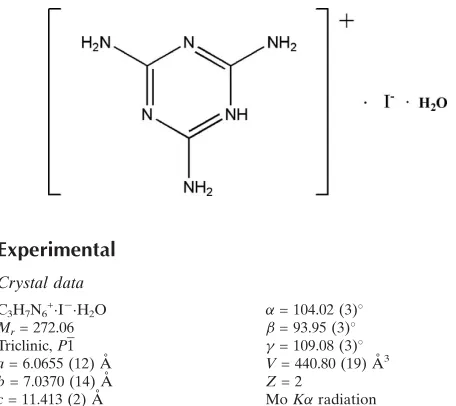
Melaminium iodide monohydrate
Min Min Zhao* and Ping Ping Shi
Ordered Matter Science Research Center, College of Chemistry and Chemical, Engineering, Southeast University, Nanjing 211189, People’s Republic of China Correspondence e-mail: [email protected]
Received 25 April 2010; accepted 14 May 2010
Key indicators: single-crystal X-ray study;T= 293 K; mean(N–C) = 0.004 A˚;
Rfactor = 0.026;wRfactor = 0.067; data-to-parameter ratio = 18.9.
In the title melaminium salt, 2,4,6-triamino-1,3,5-triazin-1-ium iodide monohydrate, C3H7N6
+
IH2O, the components are linked via N—H O, N—H N, O—H I and N—H I hydrogen bonds. All of the H atoms of the melaminium cation are involved in hydrogen bonds. The melaminium cations are interconnected by four N—H N hydrogen bonds, forming ribbons along [111]. The water molecules connected by N— H O hydrogen bonds also form part of these ribbons. The ribbons are interconnected by other hydrogen bonds (O— H I and N—H I), as well as by–interactions [centroid– centroid distance = 3.6597 (17) A˚ ].
Related literature
For similar singly protonated melaminium salts, see: Janczaket al. (2001); Athikomrattanakul et al.(2007). For ferroelectric materials, see: Fuet al.(2009); Hanget al.(2009). For impe-dance studies, see: Uthrakumaret al.(2008).
Experimental
Crystal data
C3H7N6+I
H2O
Mr= 272.06
Triclinic,P1 a= 6.0655 (12) A˚ b= 7.0370 (14) A˚ c= 11.413 (2) A˚
= 104.02 (3)
= 93.95 (3)
= 109.08 (3)
V= 440.80 (19) A˚3 Z= 2
MoKradiation
T= 293 K
Data collection
Rigaku SCXmini diffractometer Absorption correction: multi-scan
(CrystalClear; Rigaku, 2005) Tmin= 0.285,Tmax= 0.487
4551 measured reflections 2006 independent reflections 1896 reflections withI> 2(I) Rint= 0.029
Refinement
R[F2> 2(F2)] = 0.026
wR(F2) = 0.067
S= 1.11 2006 reflections 106 parameters 3 restraints
H atoms treated by a mixture of independent and constrained refinement
max= 0.47 e A˚ 3
[image:1.610.316.564.276.380.2] [image:1.610.47.275.512.715.2]min=0.61 e A˚3
Table 1
Hydrogen-bond geometry (A˚ ,).
D—H A D—H H A D A D—H A
N2—H2A O1 0.86 1.87 2.724 (4) 172 N4—H4A I1i
0.86 2.95 3.764 (3) 159 N4—H4B I1ii
0.86 3.20 3.758 (3) 125 N6—H6A I1iii
0.86 2.88 3.647 (3) 149 N6—H6B N1iv
0.86 2.15 3.009 (3) 173 O1—H1A I1v
0.83 (2) 3.13 (4) 3.760 (4) 134 (5) O1—H1A I1vi
0.83 (2) 3.39 (5) 3.778 (3) 112 (4) O1—H1B I1 0.82 (2) 3.00 (3) 3.732 (4) 150 (5) N5—H5A N3vii
0.86 2.15 3.013 (4) 177 N5—H5B I1v 0.86 2.97 3.698 (3) 143
Symmetry codes: (i)x1;y;z; (ii)xþ1;yþ1;z; (iii)xþ1;yþ1;zþ1; (iv) x;yþ1;zþ1; (v) x;y1;z; (vi) xþ2;yþ1;z; (vii) xþ1;y;zþ1.
Data collection: CrystalClear (Rigaku, 2005); cell refinement: CrystalClear; data reduction:CrystalClear; program(s) used to solve structure:SHELXS97(Sheldrick, 2008); program(s) used to refine structure: SHELXL97 (Sheldrick, 2008); molecular graphics: SHELXTL(Sheldrick, 2008); software used to prepare material for publication:PRPKAPPA(Ferguson, 1999).
The authors are grateful to the starter fund of Southeast University for financial support to purchase the diffract-ometer.
Supplementary data and figures for this paper are available from the IUCr electronic archives (Reference: FB2196).
References
Athikomrattanakul, U., Promptmas, C., Katterle, M. & Schilde, U. (2007).Acta Cryst.E63, o2154–o2156.
Ferguson, G. (1999).PRPKAPPA. University of Guelph, Canada.
Fu, D. W., Ge, J. Z., Dai, J., Ye, H. Y. & Qu, Z. R. (2009).Inorg. Chem. Commun.12, 994–997.
Hang, T., Fu, D. W., Ye, Q. & Xiong, R. G. (2009).Cryst. Growth Des.5, 2026– 2029.
Janczak, J. & Perpe´tuo, G. J. (2001).Acta Cryst.C57, 1120–1122.
Rigaku (2005).CrystalClear. Version 1.4.0. Rigaku Corporation, Tokyo, Japan. Sheldrick, G. M. (2008).Acta Cryst.A64, 112–122.
Uthrakumar, R., Vesta, C., Raj, C. J., Dinakaran, S., Dhas, R. C. & Das, S. J. (2008).Cryst. Res. Technol.43, 428–432.
Structure Reports Online
supporting information
Acta Cryst. (2010). E66, o1415 [https://doi.org/10.1107/S160053681001785X]
Melaminium iodide monohydrate
Min Min Zhao and Ping Ping Shi
S1. Comment
The melamine molecule and its organic and inorganic complexes or salts can develop supramolecular structures via
multiple hydrogen-bonding systems by self-assembly of components which contain abundant hydrogen-bonding sites
(Janczak et al., 2001; Athikomrattanakul et al., 2007). The present study is a part of systematic investigation of
ferroelectric materials (Fu et al., 2009; Hang et al., 2009) that include metal-organic coordination compounds with
organic ligands or are related to the structures with both organic and inorganic building fragments.
The compound was characterized by the X-ray powder diffraction (XRPD) at room temperature. The pattern calculated
from the single-crystal X-ray data was in a good agreement with the observed at to the peak positions but with different
peak intensities.
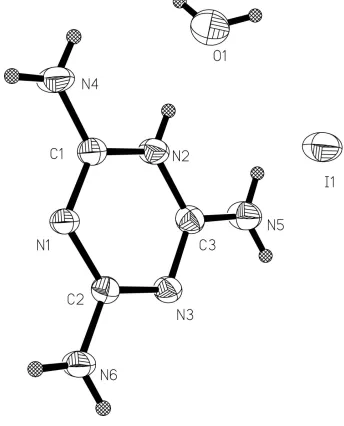
The structure is composed of the melaminium cations, iodide anions and the water molecules (Fig. 1). The melaminium
cation is protonated at only one melamine site. The six-membered melaminium ring exhibits distortions from the regular
hexagonal form. The internal C—N—C angle at the protonated N atom (119.5 (2)°) is greater than the other two C—N—
C angles of the ring (115.5 (2)°) and the internal N—C—N angles involving the unprotonated ring N atoms (126.1 (2)°)
are obviously larger than those containing protonated and unprotonated N atoms (121.4 (2)°) .
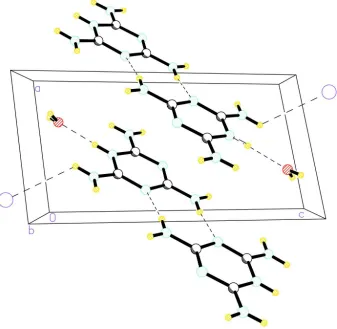
Fig. 2 shows a view down the b axis. The melaminium cations are interconnected by four N-H···N hydrogen bonds,
forming ribbons parallel to (1 1 1). The water molecules connected by N-H···O hydrogen bonds (Tab. 1) form also a part
of these ribbons. The ribbons are interconnected by other hydrogen bonds that involve I- as well as by π-electron ring - π
-electron ring interactions with the distance between the centroids of the neighbour melaminium rings (1-x,1-y,1-z) equal
to 3.6597 (17) Å. The hydrogen bonds are summarized in Tab. 1. It is of interest that water oxygens despite of being quite
close to each other are not interconnected by the hydrogen bond. The distance between the water oxygens is 2.9643 (40)
Å [Symmetry code: 1-x, 1-y, -z]. The H atom of the protonated ring N atom (H2a) is donated to the water molecule, being
involved in a strong N-H···O hydrogen bond. The other amine H atoms are involved in N—H···I and N—H···N hydrogen
bonds. I- anions that take part in the electrostatic equilibrium with the melaminium cations are also involved in O—H···I
hydrogen bonds.
S2. Experimental
Melamine (0.252 g, 0.002 mol) was dissolved in 25 ml of water at 323 K. 0.569 g of 45% (weight concentration) solution
of HI was added to the solution. (This amount corresponded to about 0.002 mol of pure HI.) The temperature was
maintained at 323 K for one hour while stirring the mixture. Then the solution was let to cool down to room temperature.
After several days, the title salt, C3H7N6+.I-.H2O, crystallized from the solution. The crystals were colourless, prismatic
All the hydrogens were discernible in the difference electron density maps. The positions of the H atoms of the melamine
cations were refined using a riding model with N—H = 0.86 Å and Uiso(H) = 1.2Ueq(N). The coordinates of the water
hydrogens have been refined under restrains 0.82 (2)Å; Uiso(H) = 1.2Ueq(O). (The constrained and the restrained values fit
well to the trial refinement with the freely refined hydrogen parameters.)
Dielectric studies (capacitance and dielectric loss measurements) were performed on powder samples which have been
pressed into tablets with conducting carbon glue deposited on their faces. The automatic impedance TongHui2828
Analyzer has been used (Uthrakumar et al., 2008). In the measured temperature range from 80 to 450 K (m.p. > 470 K),
the temperature dependence of the relative permittivity at 1 MHz varied smoothly from 3.9 to 5.2 in the title compound.
[image:3.610.132.476.236.662.2]No dielectric anomaly has been observed.
Figure 1
The title molecules with the atomic numbering scheme. The displacement ellipsoids are drawn at the 30% probability
Figure 2
A view of the structure along the b axis. The dashed lines depict the hydrogen bonds.
2,4,6-triamino-1,3,5-triazin-1-ium iodide monohydrate
Crystal data
C3H7N6+·I−·H2O Mr = 272.06
Triclinic, P1 Hall symbol: -P 1 a = 6.0655 (12) Å b = 7.0370 (14) Å c = 11.413 (2) Å α = 104.02 (3)° β = 93.95 (3)° γ = 109.08 (3)° V = 440.80 (19) Å3
Z = 2 F(000) = 260 Dx = 2.050 Mg m−3
Mo Kα radiation, λ = 0.71073 Å Cell parameters from 4510 reflections θ = 3.2–27.5°
µ = 3.59 mm−1 T = 293 K Prism, colourless 0.40 × 0.30 × 0.20 mm
Data collection
Rigaku SCXmini diffractometer
Radiation source: fine-focus sealed tube Graphite monochromator
Detector resolution: 13.6612 pixels mm-1 ω scans
Absorption correction: multi-scan (CrystalClear; Rigaku, 2005) Tmin = 0.285, Tmax = 0.487
h = −7→7 l = −14→14
Refinement
Refinement on F2
Least-squares matrix: full R[F2 > 2σ(F2)] = 0.026 wR(F2) = 0.067 S = 1.11 2006 reflections 106 parameters 3 restraints 30 constraints
Primary atom site location: structure-invariant direct methods
Secondary atom site location: difference Fourier map
Hydrogen site location: difference Fourier map H atoms treated by a mixture of independent
and constrained refinement w = 1/[σ2(F
o2) + (0.0285P)2 + 0.1083P]
where P = (Fo2 + 2Fc2)/3
(Δ/σ)max = 0.008
Δρmax = 0.47 e Å−3
Δρmin = −0.61 e Å−3
Special details
Geometry. All esds (except the esd in the dihedral angle between two l.s. planes) are estimated using the full covariance
matrix. The cell esds are taken into account individually in the estimation of esds in distances, angles and torsion angles; correlations between esds in cell parameters are only used when they are defined by crystal symmetry. An approximate (isotropic) treatment of cell esds is used for estimating esds involving l.s. planes.
Refinement. Refinement of F2 against ALL reflections. The weighted R-factor wR and goodness of fit S are based on F2,
conventional R-factors R are based on F, with F set to zero for negative F2. The threshold expression of F2 > σ(F2) is used
only for calculating R-factors(gt) etc. and is not relevant to the choice of reflections for refinement. R-factors based on F2
are statistically about twice as large as those based on F, and R- factors based on ALL data will be even larger.
Fractional atomic coordinates and isotropic or equivalent isotropic displacement parameters (Å2)
x y z Uiso*/Ueq
N1 0.1770 (4) 0.3970 (4) 0.3846 (2) 0.0392 (5)
N2 0.4296 (4) 0.2565 (4) 0.2773 (2) 0.0433 (5)
H2A 0.5039 0.2463 0.2159 0.052*
N3 0.3428 (4) 0.1720 (4) 0.4600 (2) 0.0402 (5)
N4 0.2758 (6) 0.4725 (5) 0.2059 (3) 0.0567 (7)
H4A 0.1912 0.5504 0.2121 0.068*
H4B 0.3504 0.4576 0.1449 0.068*
N6 0.1007 (5) 0.3160 (4) 0.5631 (2) 0.0510 (6)
H6A 0.1161 0.2533 0.6175 0.061*
H6B 0.0144 0.3925 0.5713 0.061*
O1 0.6721 (6) 0.1912 (5) 0.0884 (3) 0.0817 (9)
H1A 0.707 (10) 0.091 (5) 0.051 (5) 0.123*
H1B 0.731 (10) 0.301 (5) 0.070 (5) 0.123*
C1 0.2911 (5) 0.3752 (4) 0.2904 (3) 0.0401 (6)
C2 0.2097 (5) 0.2947 (4) 0.4671 (2) 0.0375 (5)
C3 0.4499 (5) 0.1533 (4) 0.3622 (3) 0.0414 (6)
I1 0.89281 (4) 0.76920 (3) 0.134131 (16) 0.05182 (10)
N5 0.5833 (5) 0.0365 (5) 0.3468 (3) 0.0562 (7)
H5A 0.6010 −0.0276 0.4000 0.067*
Atomic displacement parameters (Å2)
U11 U22 U33 U12 U13 U23
N1 0.0500 (13) 0.0449 (12) 0.0330 (11) 0.0251 (10) 0.0130 (10) 0.0164 (10) N2 0.0505 (13) 0.0533 (13) 0.0369 (12) 0.0275 (11) 0.0152 (10) 0.0170 (11) N3 0.0489 (12) 0.0450 (12) 0.0339 (12) 0.0243 (10) 0.0076 (10) 0.0133 (10) N4 0.0751 (18) 0.0785 (19) 0.0448 (15) 0.0473 (16) 0.0294 (14) 0.0350 (14) N6 0.0732 (17) 0.0630 (16) 0.0401 (13) 0.0427 (14) 0.0239 (12) 0.0264 (12)
O1 0.093 (2) 0.086 (2) 0.080 (2) 0.0379 (18) 0.0513 (17) 0.0311 (18)
C1 0.0445 (14) 0.0427 (14) 0.0369 (14) 0.0182 (12) 0.0088 (11) 0.0136 (11) C2 0.0415 (13) 0.0382 (13) 0.0330 (13) 0.0148 (11) 0.0054 (11) 0.0095 (11) C3 0.0424 (14) 0.0453 (14) 0.0375 (14) 0.0186 (12) 0.0035 (11) 0.0099 (12) I1 0.06273 (16) 0.06633 (16) 0.03972 (14) 0.03312 (12) 0.01791 (10) 0.02193 (11) N5 0.0674 (17) 0.0751 (18) 0.0485 (16) 0.0474 (15) 0.0192 (13) 0.0240 (14)
Geometric parameters (Å, º)
N1—C1 1.322 (3) N4—H4B 0.8600
N1—C2 1.357 (3) N6—C2 1.321 (4)
N2—C1 1.357 (3) N6—H6A 0.8600
N2—C3 1.366 (4) N6—H6B 0.8600
N2—H2A 0.8600 O1—H1A 0.831 (18)
N3—C3 1.330 (4) O1—H1B 0.822 (18)
N3—C2 1.354 (3) C3—N5 1.321 (4)
N4—C1 1.325 (4) N5—H5A 0.8600
N4—H4A 0.8600 N5—H5B 0.8600
C1—N1—C2 115.6 (2) N1—C1—N4 120.5 (3)
C1—N2—C3 119.5 (2) N1—C1—N2 121.9 (2)
C1—N2—H2A 120.3 N4—C1—N2 117.6 (3)
C3—N2—H2A 120.3 N6—C2—N3 117.0 (2)
C3—N3—C2 115.5 (2) N6—C2—N1 117.0 (2)
C1—N4—H4A 120.0 N3—C2—N1 126.1 (2)
C1—N4—H4B 120.0 N5—C3—N3 120.1 (3)
H4A—N4—H4B 120.0 N5—C3—N2 118.5 (3)
C2—N6—H6A 120.0 N3—C3—N2 121.4 (2)
C2—N6—H6B 120.0 C3—N5—H5A 120.0
H6A—N6—H6B 120.0 C3—N5—H5B 120.0
H1A—O1—H1B 115 (3) H5A—N5—H5B 120.0
Hydrogen-bond geometry (Å, º)
D—H···A D—H H···A D···A D—H···A
N2—H2A···O1 0.86 1.87 2.724 (4) 172
N4—H4A···I1i 0.86 2.95 3.764 (3) 159
N4—H4B···I1ii 0.86 3.20 3.758 (3) 125
N6—H6A···I1iii 0.86 2.88 3.647 (3) 149
O1—H1A···I1vi 0.83 (2) 3.39 (5) 3.778 (3) 112 (4)
O1—H1B···I1 0.82 (2) 3.00 (3) 3.732 (4) 150 (5)
N5—H5A···N3vii 0.86 2.15 3.013 (4) 177
N5—H5B···I1v 0.86 2.97 3.698 (3) 143