Dietary patterns obtained through principal components analysis:
1
the effect of input variable quantification
2
Andrew D.A.C. Smith1
3
Pauline M. Emmett1 4
P. K. Newby2,3,4 5
Kate Northstone1 6
1 School of Social and Community Medicine, University of Bristol,
7
Oakfield House, Oakfield Grove, Clifton, Bristol BS8 2BN, UK 8
2 Department of Pediatrics and Program in Graduate Medical Nutrition Sciences, Boston
9
University School of Medicine, 88 East Newton Street, Vose Hall 308, Boston, MA 02188, 10
USA 11
3 Department of Epidemiology, Boston University School of Public Health,
12
88 East Newton Street, Vose Hall 308, Boston, MA 02188, USA 13
4 Program in Gastronomy, Culinary Arts, and Wine Studies, Metropolitan College at Boston
14
University, Boston, MA 02215 USA 15
Corresponding author: Kate Northstone
School of Social and Community Medicine, University of Bristol Oakfield House, Oakfield Grove, Clifton, Bristol BS8 2BN UK Tel: +44 117 3310040
Fax: +44 117 3310080
Email: [email protected]
Running title: Dietary patterns: input quantification 16
Key words
Abstract 1
Principal components analysis (PCA) is a popular method for deriving dietary patterns. A 2
number of decisions must be made throughout the analytic process, including how to quantify 3
the input variables of the PCA. This study aims to compare the effect of using different input 4
variables on the patterns extracted using PCA on three-day diet diary data collected from 5
7,473 children, aged 10 years, in the Avon Longitudinal Study of Parents and Children 6
(ALSPAC). Four options were examined: weight consumed of each food group (g/d), energy 7
adjusted weight, percent contribution to energy of each food group, and binary intake 8
(consumed / not consumed). Four separate PCAs were performed, one for each intake 9
measurement. Three or four dietary patterns were obtained from each analysis, with at least 10
one component that described ‘more healthy’ and ‘less healthy’ diets, and one component 11
that described a diet with high consumption of meat, potatoes and vegetables. There were no 12
obvious differences between the patterns derived using percentage energy as a measurement, 13
or adjusting weight for total energy intake, compared to those derived using gram weights. 14
Using binary input variables yielded a component that loaded positively on reduced-fat, 15
reduced-sugar foods. Our results suggest that food intakes quantified by gram weights or as 16
binary variables both resulted in meaningful dietary patterns, and each method has distinct 17
advantages: weight takes into account the amount of each food consumed and binary intake 18
appears to describe general food preferences, which are potentially easier to modify and 19
useful in public health settings. 20
Introduction 1
The use of dietary patterns to explore the effects of diet on a variety of health outcomes is 2
now well established as a method that complements examining individual foods and 3
nutrients. Dietary patterns allow the assessment of the whole diet, accounting for the fact that 4
foods/nutrients are consumed in combination and are therefore highly correlated. Principal 5
components analysis (PCA), a form of factor analysis, is a popular method for deriving 6
dietary patterns. It makes use of the correlations between food intakes to identify underlying 7
patterns in the data. There are several subjective decisions that must be made when using 8
PCA. A particularly important one, which is often overlooked, is how to quantify the input 9
variables. Depending on the source of dietary data a number of different variables could be 10
considered. For example, data from diet diaries can be quantified continuously as gram 11
weights or percent energy from food groups or dichotomously (i.e., whether each food group 12
was consumed or not). 13
The input variables used in PCA vary across studies(1) and include frequency of consumption, 14
gram weights, energy-adjusted weight, daily percent energy contribution, and binary 15
variables. Many studies based on diet diaries use weight of foods consumed as the input 16
variable(2-5). Energy adjustment using the residual method(6) is often applied in studies based
17
on diet diaries and diet recalls(7-9) as well as studies based on FFQ data(10-12). Percent energy 18
is another potential input variable(13) and a few studies(14-15) have dichotomized intakes into 19
binary variables. Most studies select one strategy, for dietary patterns analyses, but seldom 20
justify the decision and only a few studies have made comparisons between the different 21
input variables but with no formal conclusions (14, 16, 17) . There are no studies to our
22
knowledge that have compared all four strategies and no studies have made comparisons in 23
In order to facilitate comparisons across studies, it is vital that researchers are as informed as 1
possible about the decisions that they need to make and use the best evidence available. 2
Therefore, the aim of the current study is to derive dietary patterns using PCA using four 3
different input variables – weight (g/d), energy-adjusted weight, percent energy contribution, 4
and binary (consume or not consume) – and compare the interpretability of the patterns 5
among children participating in the Avon Longitudinal Study of Parents and Children. 6
Methods 1
Participants 2
The Avon Longitudinal Study of Parents and Children (ALSPAC) is an ongoing longitudinal 3
cohort study designed to investigate determinants of development, health and disease during 4
and after childhood. Eligible participants were pregnant women resident in the former Avon 5
Health Authority, in South West England, due to deliver between 1 April 1991 and 31 6
December 1992. Further details are given elsewhere(18) and can be found on the website
7
www.bris.ac.uk/alspac. The study includes children from the core ALSPAC sample, 8
consisting of 14,541 pregnancies, and an additional 542 eligible pregnancies not in the core 9
sample, invited to participate at a later date. This study was conducted according to the 10
guidelines laid down in the Declaration of Helsinki and all procedures involving human 11
subjects/patients were approved by the ALSPAC Law and Ethics Committee and the Local 12
Research Ethics Committees. Written informed consent was obtained from all 13
subjects/patients. 14
Dietary assessment 15
The study children were invited to attend a clinic when they were 10 years old, and a diet 16
diary was sent with their confirmation to be completed prior to their visit. Children and their 17
care-givers recorded, in household measures, all food and drink consumed by the child over 18
two (not necessarily consecutive) weekdays and one weekend day. During clinic attendance 19
the children were interviewed to ensure the quality of the diary (e.g., clarifying portion size or 20
omitted details on the types of food and drinks consumed). If the child did not bring a diary to 21
the clinic, the fieldworker conducted a 24-hour recall to record all food and drink consumed 22
were entered into the DIDO (Diet In Data Out) computer program(20), which,generated the 1
weight and energy contribution of every food consumed by each child. For the purposes of 2
this study the average daily intake of food weight and energy were used. 3
Each food consumed was initially allocated to one of 95 food groups that were based on those 4
used in FFQ that had previously been administered to the ALSPAC cohort(21). Sugar-free 5
confectionery, alcohol, herbs and spices were removed from the analysis, as very few 6
children consumed these foods and thus they did not contribute meaningfully to any dietary 7
patterns. The remaining food items were combined into 62 groups, based on similarities 8
between foods (for example nuts, peanuts and peanut butter were combined), to reduce the 9
number of input variables and prevent infrequently consumed foods from diluting the dietary 10
patterns. The appendix describes the food groups in detail. 11
Statistical methods 12
Dietary patterns were derived using PCA. Principal components are linear combinations of 13
the input variables and explain as much of the variation in the data as possible. Each 14
component describes a dietary pattern and the linear combination allows the calculation of a 15
component score for each child, the higher the score the more likely this pattern is present in 16
an individual’s diet. The patterns described by each component may be interpreted by its 17
factor loadings, which are the correlations between the component and each input variable. 18
Large positive or negative factor loadings indicate the foods that are important in that 19
component; loadings with magnitude of at least 0.2 were considered when describing dietary 20
patterns. Scree plots(22) and the interpretability of each component, were also used to 21
determine the appropriate number of components to select. Varimax rotation(23) was
22
the different dietary patterns obtained using each of the input variables, therefore the patterns 1
were given alphanumeric labels rather than descriptive names to aid reporting. 2
Four separate analyses were carried out, using four different input variables. The first used 3
the weight (g/d) of each food consumed. The variables were standardized prior to entry into 4
the PCA to prevent components being dominated by the foods that are consumed in the 5
highest quantities, such as water. The second analysis adjusted the mean weight for total 6
energy intake, using the residuals method(6). Specifically, the PCA input variables were the
7
standardized residuals from a linear regression of mean weight on mean daily energy intake. 8
Regression was only performed on non-zero values, and both weight and energy were log-9
transformed before regression and transformed back before standardization. The third 10
analysis used the percent contribution of each food to the daily energy intake as input 11
variables. These percent energy input variables were also standardized prior to entry into the 12
PCA to prevent components being dominated by the foods that provide the highest percent 13
energy. In the fourth analysis the input variables were dichotomized into binary variables 14
(consumed or not consumed), as food intake variables were highly skewed and many children 15
did not consume some of the food groups. PCA was performed directly on their covariance 16
matrix for this fourth method (as opposed to the correlation matrix for the previous three 17
methods), as standardization is not appropriate for binary variables. For each of the four 18
PCA, scores were calculated for each subject for each pattern derived by summing the 19
products of each standardized input variable and their corresponding coefficient in the 20
component (or dichotomized in the case of binary variables). 21
Agreement between the derived patterns was assessed in two ways. Agreement between 22
component scores was assessed by calculating Pearson’s sample correlation coefficients. 23
coefficients in order to assess the difference between the coefficients assigned to individual 1
foods by each component. 2
Results 1
Of the 11,868 children eligible to attend the clinic, a total of 7,557 (63.7%) attended and 2
7,473 of these (98.9%) provided dietary information. Of these 5,769 (77.2%) provided 3 days 3
of dietary records. Girls, white children, children with older, more educated, non-smoking 4
mothers, and children from homes that were owned or mortgaged were more likely to provide 5
data (all p < 0.001; data not shown). 6
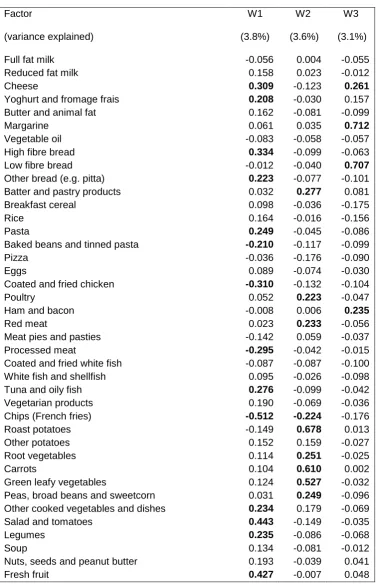
When gram weights were used as input variables, three principal components were retained 7
and explained 10.4% of the variation in the sample. Factor loadings are shown in Table 1. 8
The first component (W1) had high positive loadings on non-white bread, fruit and 9
vegetables, cooked pasta, tuna and oily fish, cheese, yoghurt, high energy density sauce (e.g. 10
mayonnaise), fruit juice, and water. There were high negative loadings on processed meat, 11
coated poultry, tinned pasta/baked beans, chips (French fries), crisps (potato chips), and 12
carbonated sweet drinks (non-diet soda). The second component (W2) had high positive 13
loadings on meat, roast potatoes, batter/pastry products, vegetables, puddings and low energy 14
density sauce (e.g. gravy, ketchup), and a high negative loading on chips. The third 15
component (W3) had high positive loadings on white bread, margarine, cheese, cold meats, 16
salty flavourings, crisps, biscuits (cookies), and diet squash/cordial. 17
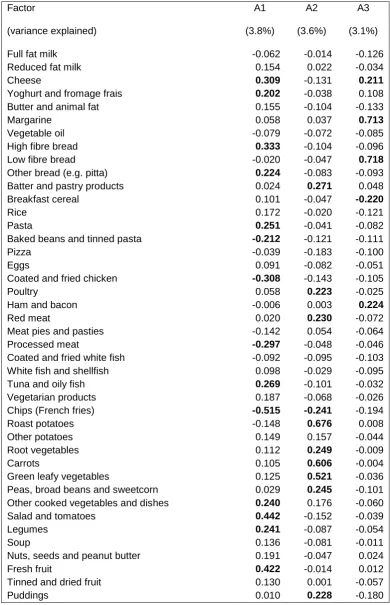
As can be seen in Table 2, energy adjustment did not have a discernible effect on the dietary 18
patterns when compared with those using unadjusted weights: the factor loadings were almost 19
identical, differing by no more than 0.084. 20
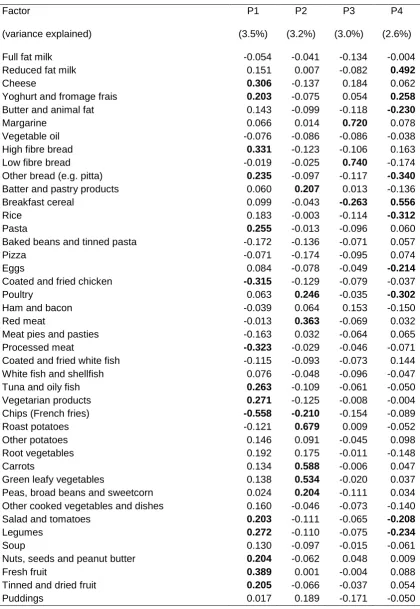
Four components were obtained when percent energy contribution was used as the input 21
variable, explaining 12.3% of the variation in the sample. Factor loadings are shown in Table 22
that loaded highly on component s W1, W2 and W3, with the exception that water loaded 1
highly on W1 but not P1, vegetarian products, legumes and nuts loaded highly on P1 but not 2
W1, and diet squash/cordial loaded highly on W3 but not P3. The fourth component (P4) had 3
high positive loadings on reduced fat milk, yoghurt, breakfast cereal and biscuits, and high 4
negative loadings on rice, other breads (e.g. pitta), poultry, eggs, butter, salad, legumes and 5
carbonated sweet drinks. 6
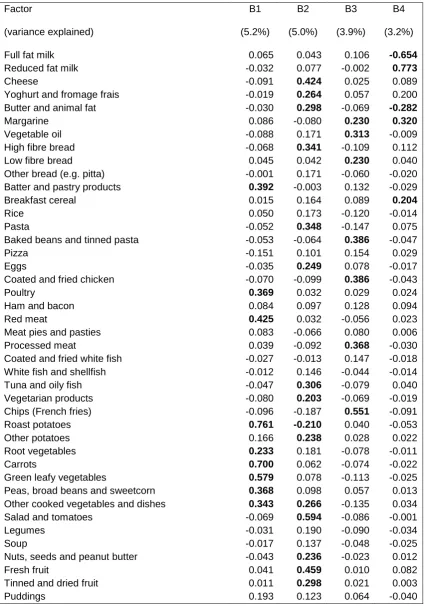
When PCA was performed on binary variables, four components were obtained, explaining 7
17.3% of the variation in the sample. Table 4 shows factor loadings for these four 8
components. The first component (B1) had high loadings on meat, roast potatoes, 9
batter/pastry products, vegetables, and low energy density sauces. The second component 10
(B2) had high positive loadings on non-white bread, fruit, nuts, salad, vegetarian foods and 11
vegetable dishes, potatoes, pasta, tuna and oily fish, cheese, yoghurt, eggs, butter, high 12
energy density sauce, sweet spreads (e.g. jam), dairy puddings, cakes, chocolate, fruit juice, 13
regular squash/cordial, and water. There were high negative loadings on diet squash/cordial, 14
and roast potatoes. The third component (B3) had high loadings on processed meat, coated 15
poultry, tinned pasta/baked beans, white bread, margarine, vegetable oil, chips, crisps, 16
chocolate, sweets (candy), sweet spreads (jams), sugar, cakes, dairy puddings, biscuits, 17
carbonated sweet drinks, and diet squash/cordial. The fourth component (B4) had high 18
positive loadings on reduced fat milk, margarine, diet carbonated drinks, and diet 19
squash/cordial. It also had high negative loadings on their alternatives: full fat milk, butter, 20
carbonated sweet drinks, and regular squash/cordial. It also had a high positive loading on 21
breakfast cereals. 22
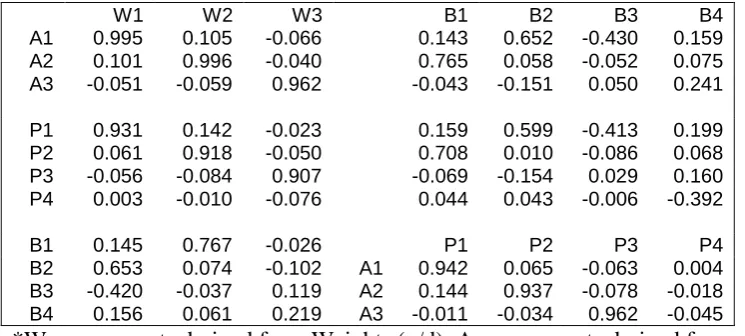
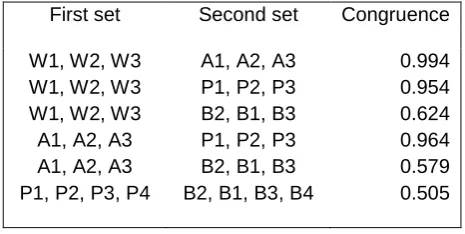
Table 5 shows the correlations between the component scores, and Table 6 shows congruence 23
adjusted weight input variables are very similar, as assessed by correlations between 1
component scores and the congruence coefficient between these components. The first three 2
components from the analysis with percent energy input variables were also similar to those 3
generated from gram weights: the correlations between P1, P2, P3, and W1, W2, W3 were at 4
least 0.907. The components generated by binary input variables share partial similarities 5
with the other components. In terms of component scores, B1 was positively correlated with 6
W2, B2 with W1 and B3 was negatively correlated with W1. 7
Discussion 1
This study of dietary diary data from ten-year-old children compared dietary patterns derived 2
from PCA using four strategies for quantifying input variables. When continuous variables 3
were used (gram weights, energy adjusted weight and percent energy contribution), the first 4
three components extracted had similar loadings and described similar dietary patterns: one 5
contrasting ‘more healthy’ foods with ‘less healthy’ foods, one with high loadings on meat, 6
potatoes and vegetables, and one with high loadings on lunch and snack foods. The fourth 7
component, present only when intake was measured as percent energy, was difficult to 8
interpret. When binary variables were used, the four components extracted described slightly 9
different dietary patterns: the component with high loadings on meat, potatoes and vegetables 10
was still present, but the component with positive loadings on `more healthy’ foods and 11
negative loadings on ‘less healthy’ foods was replaced by two components: one with high 12
loadings on the ‘more healthy’ foods and the other with high loadings on the ‘less healthy’ 13
foods. The fourth component had positive loadings for reduced-fat, reduced-sugar foods and 14
negative loadings on their alternatives. 15
There are strong similarities between patterns in the presence and absence of energy 16
adjustment, the main differences being in the relative loadings of high- and low-fibre bread, 17
and full- and low-fat milk. In a comparison of energy-adjusted and unadjusted analyses of 18
data from FFQ administered to the ALSPAC mothers(16), five components appear in the 19
unadjusted analysis but four components suffice under energy adjustment; the missing 20
component described a `processed’ dietary pattern. A study (17) comparing gram weights and 21
percent energy as input variables, in PCA of FFQ data from Irish adults, concludes that gram 22
In our study, the patterns obtained when gram weights were used as the input variables were 1
the most interpretable. Weight is a clear, quantitative way to measure food consumption and 2
can be easily linked to portion sizes. A drawback of using gram weights (unadjusted and 3
adjusted for energy) and percent energy was that they potentially led to skewed input 4
variables, with many zeroes for foods that weren’t frequently consumed. This resulted in 5
component scores with skewed distributions. Adjusting the weight for energy intake did not 6
alter the dietary patterns, agreeing with research in adults(14). These results suggest that 7
energy-adjusting the input variables does not offer any specific benefit when determining 8
dietary patterns, using PCA, from diet diaries administered to children. It may be more 9
appropriate to perform energy adjustment later in the analytic process as this allows for more 10
accurate assessment of the effect of energy itself. A similar conclusion was reached when 11
obtaining dietary patterns using PCA in the ALSPAC mothers, although this was based on 12
FFQ data(16). 13
In agreement with other research [in adults](17), using percent energy as an input variable led 14
to patterns that were harder to interpret than those derived from gram weights. In this study, 15
the percent energy strategy led to components in which water did not load highly, as it does 16
not contribute to energy intake. This could be considered an inherent limitation of this 17
approach, given non-energy containing foods (e.g., water, coffee, tea, and diet soda) often 18
contribute meaningfully to dietary patterns. This is shown in the current study, in which water 19
loaded highly on the components obtained when gram weights were used as the input 20
variable strategy, whether energy-adjusted and unadjusted. These results indicate that 21
variation in water intake is an important part of childhood diet and is missed when using the 22
percent energy method. Percent energy is an attractive concept as it considers one’s overall 23
groups, which provide relatively small contributions to total energy intake when considered 1
on their own (i.e., in contrast to considering, say, the macronutrient composition of the diet). 2
Few studies have used binary input variables to derived dietary patterns using PCA. Using 3
this method overcame the issues of skewness and the sometimes large numbers of non-4
consumers of food groups and led to interpretable dietary patterns. A study of data from an 5
FFQ administered to adults in four European cohorts(14) showed no effect of dichotomization 6
of input variables on dietary patterns. However, in our study the patterns were different from 7
those obtained from continuous variables, Binary (consumed/not consumed) variables are 8
easy to understand and conceptually represent choices and/or preferences of food rather than 9
quantities consumed. This was evident in component B4, which seemed to differentiate 10
between individuals who chose reduced fat, reduced sugar foods, and those who chose the 11
regular (full fat, full sugar) options for those foods. Food choices are potentially easier to 12
modify, but it must be recognized that people consume food in different quantities and 13
dichotomizing food intakes does not capture the complexity of eating behaviour. 14
The findings of this study are strengthened by the large sample size. However, the sample is 15
biased towards higher socioeconomic status. As well, this study has not assessed the effect of 16
different input variables on a specific diet-disease association, As the patterns obtained with 17
different strategies were similar, the effect of input variables on a given diet-disease 18
association may be similar, although this is an important next step to further this literature 19
and needs to be examined. Another input variable that could be considered is the number of 20
servings per day, which is commonly used in studies that assess diet using an FFQ. However, 21
as this study made use of diet diaries, considered a gold standard method of self-reported 22
dietary assessment, we elected not to consider this semi-quantitative approach commonly 23
In conclusion, this study is the first to comprehensively compare different input variables 1
used in dietary pattern analysis obtained using PCA. Our results indicate that there appears to 2
be no benefit associated with energy adjustment, given results were similar to those when 3
unadjusted. We also showed that patterns based on percent energy did not capture meaningful 4
dietary intakes, completely missing some items consumed such as water, and were also 5
harder to interpret. Thus, while the final choice of input variable treatment may depend on the 6
purpose of a particular analysis the use of food weights and binary variables appeared to be 7
the best approaches to quantify input variables in this study among children. More research is 8
needed to see whether input variable treatment impacts diet-disease associations, as 9
understanding the role of diet on health outcomes is the ultimate objective of nutritional 10
epidemiologic studies. However, for the purposes of describing the underlying patterns of 11
diet in a population we would recommend using weights of foods; binary input variables 12
would be a complementary approach to this in which specific dietary choices can be 13
identified. 14
Acknowledgements 1
We are extremely grateful to all the families who took part in this study, the midwives for 2
their help in recruiting them, and the whole ALSPAC team, which includes interviewers, 3
computer and laboratory technicians, clerical workers, research scientists, volunteers, 4
managers, receptionists and nurses. The UK Medical Research Council, the Wellcome Trust, 5
and the University of Bristol provide core support for ALSPAC. This work was supported by 6
the World Cancer Research Fund grant number 2009/23. KN and PE designed the study; AS 7
performed the statistical analysis; KN had primary responsibility for final content. All authors 8
contributed to writing the manuscript and approved the final version. The authors declare no 9
conflict of interest. 10
References 1
1. Newby PK & Tucker KL (2004) Empirically derived eating patterns using factor or cluster analysis: a review. Nutr Rev 62, 177–203.
2. Cucó G, Fernández-Ballart J, Sala J et al. (2006) Dietary patterns and associated lifestyles in preconception, pregnancy and postpartum. Eur J Clin Nutr 60, 364–371.
3. Hamer M, McNaughton SA, Bates CJ et al. (2010) Dietary patterns, assessed from a weighed food record, and survival among elderly participants from the United Kingdom.
Eur J Clin Nutr 64, 853–861.
4. Mikkilä V, Räsänen L, Raitakari OT et al. (2005) Consistent dietary patterns identified from childhood to adulthood: The Cardiovascular Risk in Young Finns Study. Br J Nutr
93, 923–931.
5. Yannakoulia M, Yiannakouris N, Melistas L et al. (2008) A dietary pattern characterized by high consumption of whole-grain cereals and low-fat dairy products and low
consumption of refined cereals is positively associated with plasma adiponectin levels in healthy women. Metabolism 57, 824–830.
6. Willett WC, Howe GR & Kushi LH (1997) Adjustment for total energy intake in epidemiologic studies. Am J Clin Nutr 65, Suppl. 1220S–12288S.
8. McNaughton SA, Mishra GD, Bramwell G et al. (2005) Comparability of dietary patterns assessed by multiple dietary assessment methods: results from the 1946 British Birth Cohort. Eur J Clin Nutr 59, 341–352.
9. Okubo H, Murakami K, Sasaki S et al. (2010) Relative validity of dietary patterns derived from a self-administered diet history questionnaire using factor analysis among Japanese adults. Public Health Nutr 13, 1080–1089.
10.Bamia C, Orfanos P, Ferrari P, et al. (2005) Dietary patterns among older Europeans: the EPIC-Elderly study. Br J Nutr 94, 100–113.
11.Martínez-Ortiz JA, Fung TT, Baylin A et al. (2005) Dietary patterns and risk of nonfatal acute myocardial infarction in Costa Rican adults. Eur J Clin Nutr 60, 770–777.
12.Velie EM, Schairer C, Flood A et al. (2005) Empirically derived dietary patterns and risk of postmenopausal breast cancer in a large prospective cohort study. Am J Clin Nutr 82, 1308–1319.
13.Newby PK, Muller D, Hallfrisch J et al. (2004) Food patterns measured by factor analysis and anthropometric changes in adults. Am J Clin Nutr 80, 504–513.
14.Balder HF, Virtanen M, Brants HAM et al. (2003) Common and Country-Specific Dietary Patterns in Four European Cohort Studies. J Nutr 133, 4246–4251.
15. Guinot C, Latreille J, Malvy D et al. Use of multiple correspondence analysis and cluster analysis to study dietary behaviour: Food consumption questionnaire in the SU.VI.MAX. cohort. Eur J Epidemiol 17, 505–516.
17.Hearty AP & Gibney MJ (2009) Comparison of cluster and principal components analysis techniques to derive dietary patterns in Irish adults. Br J Nutr 101, 598–608.
18.Golding J, Pembrey M, Jones R et al. (2001) ALSPAC – The Avon Longitudinal Study of Parent and Children. I. Study methodology. Paediatr Perinat Epidemiol 15, 74–87.
19.Cribb VL, Jones LR, Rogers IS et al. (2011) Is maternal education level associated with diet in 10-year-old children? Public Health Nutr 14, 2037-2048.
20.Price GM, Paul AA, Key FB et al. (1995) Measurement of diet in a large national survey: comparison of computerised and manual coding of records in household measures. J Hum Nutr Diet 8, 417–428.
21.Northstone K, Emmett P & the ALSPAC Study Team (2005) Multivariate analysis of diet in children at four and seven years of age and associations with socio-demographic characteristics. Eur J Clin Nutr 59, 751–760.
22.Cattell RB (1966) The scree test for the number of factors. Multivariate Behav Res 1, 245–276.
23.Kline P (1994) An Easy Guide to Factor Analysis. London: Routledge.
Table 1: Factor loadings from PCA of diet diary data on 7473 children aged 10 years, where input variables are weights (g/d). Factor loadings with magnitude greater than 0.2 are shown in bold. Factor (variance explained) W1 (3.8%) W2 (3.6%) W3 (3.1%)
Full fat milk Reduced fat milk Cheese
Yoghurt and fromage frais Butter and animal fat Margarine
Vegetable oil High fibre bread Low fibre bread Other bread (e.g. pitta) Batter and pastry products Breakfast cereal
Rice Pasta
Baked beans and tinned pasta Pizza
Eggs
Coated and fried chicken Poultry
Ham and bacon Red meat
Meat pies and pasties Processed meat
Coated and fried white fish White fish and shellfish Tuna and oily fish Vegetarian products Chips (French fries) Roast potatoes Other potatoes Root vegetables Carrots
Green leafy vegetables
Peas, broad beans and sweetcorn Other cooked vegetables and dishes Salad and tomatoes
Legumes Soup
Tinned and dried fruit Puddings
Dairy puddings Cakes
Chocolate Sweets (candy) Sugar
Sweet spreads (e.g. jam) Biscuits (cookies)
Crackers and crispbreads Crisps (potato chips)
Low energy density sauce (e.g. gravy, ketchup) High energy density sauce (e.g. mayonnaise) Salty flavouring (e.g. yeast extract)
Water and flavoured water Carbonated sweet drinks (soda) Carbonated diet drinks (diet soda) Regular squash and cordial Diet squash and cordial Fruit juice
Flavoured milk drinks Tea and coffee
0.143 0.012 -0.098 0.095 -0.133 -0.149 -0.093 0.105 -0.116 0.145
-0.207
0.014
0.302
0.110
0.304 -0.246 -0.226
0.046 -0.184
0.263
-0.034 -0.034
0.007
0.240 0.218
0.041 -0.023 -0.012 0.053 0.042 0.040 -0.038 -0.035
0.599
-0.138 -0.035 -0.016 -0.076 0.050 -0.065 0.083 -0.055 -0.003 0.093
-0.026 -0.169 -0.180 -0.053 0.015 0.028 -0.008 0.174
0.245
0.106
0.333
-0.008 -0.010
0.345
-0.128 -0.090 0.079 0.002
0.289
Table 2: Factor loadings from PCA of diet diary data on 7473 children aged 10 years, where input variables are weights (g/d) adjusted for total energy intake using the residual method. Factor loadings with magnitude greater than 0.2 are shown in bold.
Factor (variance explained) A1 (3.8%) A2 (3.6%) A3 (3.1%)
Full fat milk Reduced fat milk Cheese
Yoghurt and fromage frais Butter and animal fat Margarine
Vegetable oil High fibre bread Low fibre bread Other bread (e.g. pitta) Batter and pastry products Breakfast cereal
Rice Pasta
Baked beans and tinned pasta Pizza
Eggs
Coated and fried chicken Poultry
Ham and bacon Red meat
Meat pies and pasties Processed meat
Coated and fried white fish White fish and shellfish Tuna and oily fish Vegetarian products Chips (French fries) Roast potatoes Other potatoes Root vegetables Carrots
Green leafy vegetables
Peas, broad beans and sweetcorn Other cooked vegetables and dishes Salad and tomatoes
Legumes Soup
Nuts, seeds and peanut butter Fresh fruit
Dairy puddings Cakes
Chocolate Sweets (candy) Sugar
Sweet spreads (e.g. jam) Biscuits (cookies)
Crackers and crispbreads Crisps (potato chips)
Low energy density sauce (e.g. gravy, ketchup) High energy density sauce (e.g. mayonnaise) Salty flavouring (e.g. yeast extract)
Water and flavoured water Carbonated sweet drinks (soda) Carbonated diet drinks (diet soda) Regular squash and cordial Diet squash and cordial Fruit juice
Flavoured milk drinks Tea and coffee
-0.099 0.093 -0.142 -0.155 -0.096 0.098 -0.130 0.138
-0.217
0.017
0.304
0.106
0.307 -0.255 -0.223
0.038 -0.193
0.266
-0.035 -0.037
0.198 0.030 -0.040 -0.022 0.044 0.026 0.023 -0.042 -0.048
0.597
-0.150 -0.027 -0.019 -0.095 0.055 -0.083 0.091 -0.079 -0.011 0.089
-0.264
-0.129 -0.052 -0.016 -0.083 0.132 0.177 0.079
0.295
-0.016 -0.012
0.353
-0.109 -0.132 0.080 -0.023
0.262
Table 3: Factor loadings from PCA of diet diary data on 7473 children aged 10 years, where input variables are percent contribution of each food to total energy intake. Factor loadings with magnitude greater than 0.2 are shown in bold.
Factor (variance explained) P1 (3.5%) P2 (3.2%) P3 (3.0%) P4 (2.6%)
Full fat milk Reduced fat milk Cheese
Yoghurt and fromage frais Butter and animal fat Margarine
Vegetable oil High fibre bread Low fibre bread Other bread (e.g. pitta) Batter and pastry products Breakfast cereal
Rice Pasta
Baked beans and tinned pasta Pizza
Eggs
Coated and fried chicken Poultry
Ham and bacon Red meat
Meat pies and pasties Processed meat
Coated and fried white fish White fish and shellfish Tuna and oily fish Vegetarian products Chips (French fries) Roast potatoes Other potatoes Root vegetables Carrots
Green leafy vegetables
Peas, broad beans and sweetcorn Other cooked vegetables and dishes Salad and tomatoes
Legumes Soup
Nuts, seeds and peanut butter Fresh fruit
Dairy puddings Cakes
Chocolate Sweets (candy) Sugar
Sweet spreads (e.g. jam) Biscuits (cookies)
Crackers and crispbreads Crisps (potato chips)
Low energy density sauce (e.g. gravy, ketchup) High energy density sauce (e.g. mayonnaise) Salty flavouring (e.g. yeast extract)
Water and flavoured water Carbonated sweet drinks (soda) Carbonated diet drinks (diet soda) Regular squash and cordial Diet squash and cordial Fruit juice
Flavoured milk drinks Tea and coffee
Table 4: Factor loadings from PCA of diet diary data on 7473 children aged 10 years, where intakes are expressed as binary (consumed/not consumed) variables. Factor loadings with magnitude greater than 0.2 are shown in bold.
Factor (variance explained) B1 (5.2%) B2 (5.0%) B3 (3.9%) B4 (3.2%)
Full fat milk Reduced fat milk Cheese
Yoghurt and fromage frais Butter and animal fat Margarine
Vegetable oil High fibre bread Low fibre bread Other bread (e.g. pitta) Batter and pastry products Breakfast cereal
Rice Pasta
Baked beans and tinned pasta Pizza
Eggs
Coated and fried chicken Poultry
Ham and bacon Red meat
Meat pies and pasties Processed meat
Coated and fried white fish White fish and shellfish Tuna and oily fish Vegetarian products Chips (French fries) Roast potatoes Other potatoes Root vegetables Carrots
Green leafy vegetables
Peas, broad beans and sweetcorn Other cooked vegetables and dishes Salad and tomatoes
Legumes Soup
Nuts, seeds and peanut butter Fresh fruit
Dairy puddings Cakes
Chocolate Sweets (candy) Sugar
Sweet spreads (e.g. jam) Biscuits (cookies)
Crackers and crispbreads Crisps (potato chips)
Low energy density sauce (e.g. gravy, ketchup) High energy density sauce (e.g. mayonnaise) Salty flavouring (e.g. yeast extract)
Water and flavoured water Carbonated sweet drinks (soda) Carbonated diet drinks (diet soda) Regular squash and cordial Diet squash and cordial Fruit juice
Flavoured milk drinks Tea and coffee
Table 5: Correlations between component scores obtained from different input variables*.
W1 W2 W3 B1 B2 B3 B4
A1 0.995 0.105 -0.066 0.143 0.652 -0.430 0.159
A2 0.101 0.996 -0.040 0.765 0.058 -0.052 0.075
A3 -0.051 -0.059 0.962 -0.043 -0.151 0.050 0.241
P1 0.931 0.142 -0.023 0.159 0.599 -0.413 0.199
P2 0.061 0.918 -0.050 0.708 0.010 -0.086 0.068
P3 -0.056 -0.084 0.907 -0.069 -0.154 0.029 0.160
P4 0.003 -0.010 -0.076 0.044 0.043 -0.006 -0.392
B1 0.145 0.767 -0.026 P1 P2 P3 P4
B2 0.653 0.074 -0.102 A1 0.942 0.065 -0.063 0.004
B3 -0.420 -0.037 0.119 A2 0.144 0.937 -0.078 -0.018
B4 0.156 0.061 0.219 A3 -0.011 -0.034 0.962 -0.045
Table 6: Congruence coefficients between components obtained from different input variables.*
First set Second set Congruence
W1, W2, W3 W1, W2, W3 W1, W2, W3 A1, A2, A3 A1, A2, A3 P1, P2, P3, P4
A1, A2, A3 P1, P2, P3 B2, B1, B3 P1, P2, P3 B2, B1, B3 B2, B1, B3, B4
0.994 0.954 0.624 0.964 0.579 0.505
Appendix: food groups and their components 1
2
Full fat milk Reduced fat milk Cheese
Yoghurt and fromage frais Butter and animal fat Margarine
Vegetable oil
High fibre bread Low fibre bread Other bread
Batter and pastry products
Breakfast cereal Rice
Pasta
Baked beans and tinned pasta
Pizza Eggs
Coated and fried chicken Poultry
Ham and bacon Red meat
Meat pies and pasties Processed meat
Coated and fried white fish White fish and shellfish
Tuna and oily fish
Vegetarian products Chips (French fries) Roast potatoes Other potatoes Root vegetables Carrots
Green leafy vegetables
Peas, broad beans and sweetcorn Other cooked vegetables and dishes
Salad and tomatoes Legumes
Soup
Nuts, seeds and peanut butter Fresh fruit
Tinned and dried fruit
Full fat cow’s, sheep’s or goat’s milk Skimmed or semi-skimmed cow’s milk Hard, soft, cream or cottage cheese Plain or fruit yoghurt, fromage frais Butter, dripping, ghee, lard, suet Hard or soft margarine or spread
Canola/rapeseed, coconut, cod liver, corn, olive, peanut, safflower, sesame, soya or sunflower oil
White bread, hamburger buns , bagels Brown, wholemeal, granary or rye bread
Pitta or naan bread, ciabatta, chapattis, papadums, tortillas Breadcrumbs, brioche, croissants, pancakes, pastry, scones, stuffing, Yorkshire pudding
Bran, corn, rice or oat-based cereal or sweetened cereal Brown, white, risotto or pilau rice
Pasta, spaghetti, macaroni, lasagna, noodles, couscous Baked beans, canned spaghetti or ravioli, macaroni cheese, pasta salad, gnocchi, cannelloni, pot snacks
Pizza, lunchbox snacks
Hen’s, duck’s or quail’s eggs, quiche, omelette, Scotch eggs Chicken or turkey burgers, fingers, Kiev, nuggets or in crumbs Chicken, turkey, duck, rabbit, grouse, pheasant
Ham, gammon, bacon
Beef, lamb, pork, veal, venison, haggis, liver, kidney Beef, chicken or pork pie, sausage rolls
Sausages, burgers, luncheon meat
Cod, haddock, plaice, skate all in batter or breadcrumbs Cod, coley, haddock, hake, halibut, monkfish, plaice, sea bass, snapper, sole, clams, crab, cockles, mussels, scallops, scampi, squid, prawns
Tuna, anchovies, herring, kipper, mackerel, pilchards, salmon, sardines, swordfish, trout
Vegetable or bean burgers/sausages, Quorn, soya Chips, fried potatoes, potato waffles or croquettes Old potatoes, roasted in fat
New and old potatoes, boiled or baked
Artichoke, beetroot, garlic, onion, parsnip, swede, turnip, yam Carrots
Broccoli, Brussels sprouts, cabbage, kale, spinach, Peas, broad beans, sweetcorn, mange-tout
Asparagus, cauliflower, celery, courgette, green or French beans, leek, marrow, peppers, pumpkin, squash, vegetable flans or pastries, cauliflower cheese
Raw vegetables, tomatoes Beans, lentils
Soup
Nuts, peanuts, seeds, peanut butter Citrus or other fruit
Puddings
Dairy puddings
Cakes Chocolate Sweets (candy) Sugar
Sweet spreads Biscuits (cookies)
Crackers and crispbreads Crisps (potato chips) Low energy density sauce High energy density sauce Salty flavouring
Water and flavoured water Carbonated sweet drinks (soda) Carbonated diet drinks (diet soda) Regular squash and cordial Diet squash and cordial Fruit juice
Flavoured milk drinks Tea and coffee
Cheesecake, Christmas pudding, crumble, flan, fruit pie, jelly, Pavlova, sponge, trifle
Blancmange, bread and butter pudding, cream, custard, ice cream, mousse, rice pudding
Buns, cakes, pastries Chocolate confectionary Sugar confectionary Sugar, icing
Jam, honey, chocolate spread, lemon curd, marmalade Biscuits, fully-coated chocolate biscuits
Crackers, oatcakes, water biscuits, cheese biscuits, rice cakes Potato crisps, corn snacks, pretzels
Bread/ cheese/ tomato sauces, gravy, mustard, vinegar. Energy density below 2kcal/g
Mayonnaise, salad cream, chutney. Energy density above 2kcal/g
Yeast extract, stock cubes, table salt Water, flavoured water
Cola, lemonade, ginger ale, tonic water, energy drinks Diet cola, lemonade or energy drinks
Fruit squash or cordial1
Low sugar fruit squash or cordial1
Fruit juice Flavoured milk
Tea, coffee2, herbal tea
Foods not included3 Sugar-free sweets/ jelly/ mints/ chewing gum, artificial
sweetener, black treacle, instant dessert powder, diabetic jam/ chocolate
Alcoholic drinks Herbs, spices