Experiments with Two New Boosting Algorithms
Xiaowei Sun1, Hongbo Zhou2
1
Software College, Shenyang Normal University, Shenyang, China
2
Liaoning SG Automotive Group Co., Ltd., Shenyang, China E-mail: junyaomail@163.com, [email protected] Received April 2, 2010; revised May 5, 2010; accepted June 8, 2010
Abstract
Boosting is an effective classifier combination method, which can improve classification performance of an unstable learning algorithm. But it dose not make much more improvement of a stable learning algorithm. In this paper, multiple TAN classifiers are combined by a combination method called Boosting-MultiTAN that is compared with the Boosting-BAN classifier which is boosting based on BAN combination. We describe experiments that carried out to assess how well the two algorithms perform on real learning problems. Fi- nally, experimental results show that the Boosting-BAN has higher classification accuracy on most data sets, but Boosting-MultiTAN has good effect on others. These results argue that boosting algorithm deserve more attention in machine learning and data mining communities.
Keywords:Boosting, Combination Method, TAN, BAN, Bayesian Network Classifier
1. Introduction
Classification is a fundamental task in fault diagnosis, pattern recognition and forecasting. In general, a classi-fier is a function that chooses a class label (from a group of predefined labels) for instance described by a set of features (attributes). Learning accurate classifiers from pre-classified data is a very active research topic in ma- chine learning and data mining. In the past two decades, many classifiers have been developed, such as decision trees based classifiers and neural network based classifi- ers.
Boosting [1-4] is a general method for improving the performance of any “weak” learning algorithm. In theory, boosting can be used to significantly reduce the error of any “weak” learning algorithm that consistently gener- ates classifiers which need only be a little bit better than random guessing. Despite the potential benefits of boost- ing promised by the theoretical results, the true practi- cal value of boosting can only be assessed by testing the method on “real” learning problems. In this paper, we present such experimental assessment of two new boost- ing algorithms.
The first provably effective boosting algorithms were presented by Schapire [5] and Freund [3]. Boosting works by repeatedly running a given weak learning algo- rithm on various distributions over the training data, and
then combining the classifiers produced by the weak learner into a single composite classifier. More recently, we described and analyzed AdaBoost, and we argued that this new boosting algorithm has certain properties which make it more practical and easier to implement than its predecessors.
TAN [6] and BAN [7] are augmented Bayesian net- work classifiers provided by Friedman and Cheng J. In these papers, we treat the classification node as the first node in the ordering. The order of other nodes is arbi- trary; we simply use the order they appear in the dataset. Therefore, we only need to use the CLB1 algorithm, which has the time complexity of O (N2) on the mutual information test (N is the number of attributes in the dataset) and linear on the number of cases. The effi- ciency is achieved by directly extending the Chow-Liu tree construction algorithm [8] to a three-phase BN learning algorithm: drafting, which is essentially the Chow-Liu algorithm, thickening, which adds edges to the draft, and thinning, which verifies the necessity of each edge.
MultiTAN classifier and Boosting-BAN classifier. Sec-tion 4 presents and analyzes the experimental results. These results argue that boosting algorithm deserve more attention in machine learning and data mining communi-ties.
2. Learning Bayesian Network Classifiers
Learning Bayesian network classifiers involves two steps: structure learning and parameter (conditional probability tables) learning. We will focus on structure learning methods for different Bayesian network classifiers in the subsections below.
2.1. Tree Augmented Naive-Bayes (TAN)
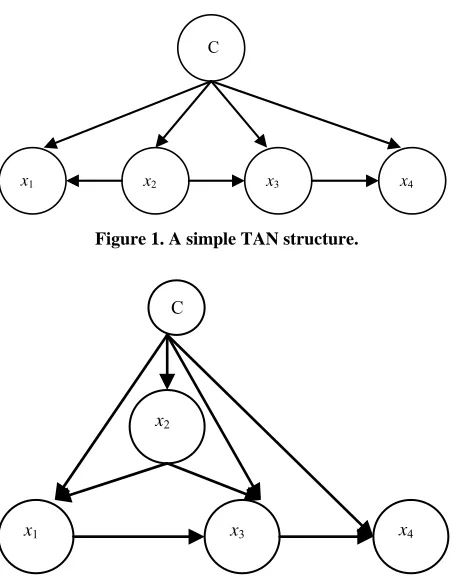
Letting X = {x1, …, xn, c}represent the node set (where c is the classification node) of the data. The algorithm for learning TAN classifier first learns a tree structure over V\{c}, using mutual information tests. It then adds a link from the classification node to each feature node in the manner as we construct a Naive-Bayes (i.e., the classify- cation node is a parent of all other nodes.) A simple TAN structure is shown in Figure 1 (Note that features x1, x2,
x3, x4 form a tree).
The learning procedure can be described as follows. 1) Take the training set and X\{c} as input.
2) Call the modified Chow-Liu algorithm. (The origin- nal algorithm is modified by replacing every mutual in- formation test I(xi, xj) with a conditional mutual infor- mation test I(xi, xj|{c})).
3) Add c as a parent of every xiwhere 1≤ i ≤ n. 4) Learn the parameters and output the TAN.
This algorithm, which is modified from the Chow-Liu algorithm, requires O(N2) numbers of conditional mu- tual information tests. This algorithm is essentially the first phase of the BAN-learning algorithm. TAN classi- fier is stable that can not be combined with a quite strong learning algorithm by boosting.
2.2. BN Augmented Naive-Bayes (BAN)
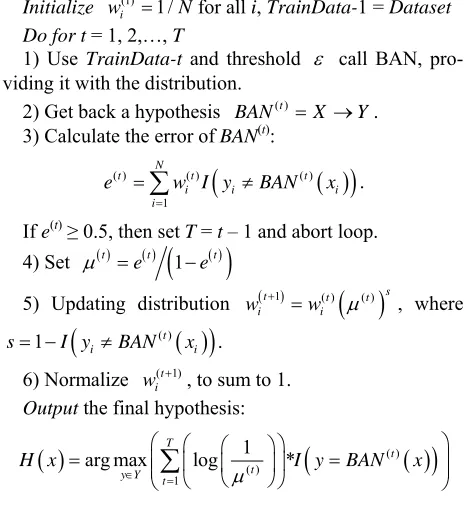
BAN classifier has been studied in several papers. The basic idea of this algorithm is just like the TAN learner of Subsection 2.1, but the unrestricted BN-learning algo- rithm instead of a tree-learning algorithm (see Figure 2).
Letting X = {x1, …, xn, c} represent the feature set (where c is the classification node) of the data, the learn- ing procedure based on mutual information test can be described as follows.
1) Take the training set and X\{c} (along with the or- dering) as input.
2) Call the modified CBL1 algorithm. (The original algorithm is modified in the following way: replace every
C
[image:2.595.310.536.72.366.2]x1 x2 x3 x4
Figure 1.A simple TAN structure.
x1
x2
x3 x4
C
Figure 2.A simple BAN structure.
mutual information test I(xi, xj) with a conditional mutual information test I(xi, xj|{c}); replace every conditional mutual information test I(xi, xj|Z) with I(xi, xj|Z + {c}), where ZX\{c}.
3) Add c as a parent of every xiwhere 1≤ i ≤ n. 4) Learn the parameters and output the BAN.
Like the TAN-learning algorithm, this algorithm dose not require additional mutual information tests, and so it requires O(n2N) (where n is the number of node attrib- utes; N is the number of training examples) mutual in- formation tests. The longest time spent in the algorithm is to calculate mutual information. In BAN structure, the second step in the three-phase is used to sort mutual information. The is a given small positive threshold, it is not fixed, and can be changed in many times. By setting different thresholds can construct many BAN classifiers. BAN classifier is unstable that can be com- bined with a quite strong learning algorithm by boosting.
3. Two New Boosting Algorithms
3.1. Boosting-MultiTAN Algorithm
value , we choose the edge to the BN structure to form TAN. Start-edge and are two important parameters in GTAN. Different Start-edges can construct different TANs. GTAN classifier is unstable that can be combined with a quite strong learning algorithm by boosting.
The Boosting-MultiTAN algorithm may be character- ized by the way in which the hypothesis weights wi are selected, and by the example weight update step.
Boosting-MultiTAN (Dataset, T):
Input: sequence of N example Dataset = {(x1, y1),…,
(xN, yN)} with labels yi ∈ Y = {1,…, k},integer T speci-fying number of iterations.
Initialize wi(1)1/N for all i, TrainData-1 = Dataset Start-edge = 1; t = 1; l = 1
While ((t ≤ T) and (l ≤ 2T))
1) Use TrainData-t and start-edge call GTAN, pro-viding it with the distribution.
2) Get back a hypothesis ( )t
TAN X Y . 3) Calculate the error of TAN(t):
( ) ( ) ( )
1
N
t t t
i i i
i
e w I y TAN x
.If e(t) ≥ 0.5, then set T = t – 1 and abort loop. 4) Set t t
1 t
e e
.
5) Updating distribution ( 1)t ( )t
( )t si i
w w , where
( )
1 t
i i
s I y TAN x .
6) Normalize ( 1)t i
w ,to sum to 1.
7) t = t + 1, l = l + 1, start-edge = start-edge + n/2T. 8) end While
Output the final hypothesis:
( )
( ) 1
1
arg max T log * t
t y Y
t
H x I y TAN x
3.2. Boosting-BAN Algorithm
Boosting-BAN works by fitting a base learner to the training data using a vector or matrix of weights. These are then updated by increasing the relative weight as- signed to examples that are misclassified at the current round. This forces the learner to focus on the examples that it finds harder to classify. After T iterations the out- put hypotheses are combined using a series of probabilis- tic estimates based on their training accuracy.
The Boosting-BAN algorithm may be characterized by the way in which the hypothesis weights wiare selected, and by the example weight update step.
Boosting-BAN (Dataset, T):
Input: sequence of N example Dataset = {(x1, y1),…,
(xN, yN)} with labels yi ∈ Y ={1, …, k},integer T speci- fying number of iterations.
Initialize wi(1) 1/Nfor all i, TrainData-1 = Dataset Do fort = 1, 2,…, T
1) Use TrainData-t and threshold call BAN, pro- viding it with the distribution.
2) Get back a hypothesis BAN( )t X Y
. 3) Calculate the error of BAN(t):
( ) ( ) ( )
1
N
t t t
i i i
i
e w I y BAN x
.If e(t)≥ 0.5, then set T = t –1 and abort loop. 4) Set t t
1 t
e e
5) Updating distribution t 1 ( )t
( )t si i
w w , where
( )
1 t
i i
s I y BAN x .
6) Normalize ( 1)t i
w , to sum to 1. Output the final hypothesis:
( )
( ) 1
1
arg max T log * t
t
y Y t
H x I y BAN x
4. The Experimental Results
We conducted our experiments on a collection of ma- chine learning datasets available from the UCI [10]. A summary of some of the properties of these datasets is given in Table 1. Some datasets are provided with a test set. For these, we reran each algorithm 20 times (since some of the algorithms are randomized), and averaged the results. For datasets with no provided test set, we used 10-fold cross validation, and averaged the results over 10 runs (for a total of 100 runs of each algorithm on each dataset).
In our experiments, we set the number of rounds of boosting to be T = 100.
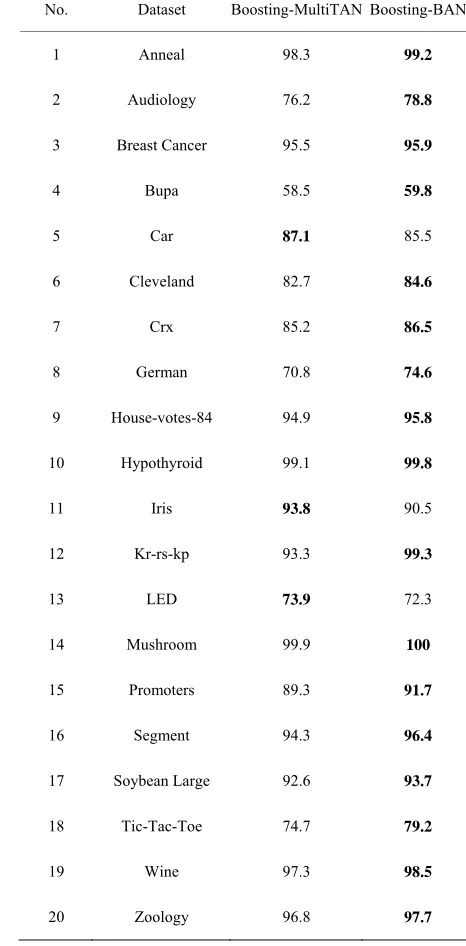
The results of our experiments are shown in Table 2. The figures indicate test correct rate averaged over mul- tiple runs of each algorithm. The bold in the table show that the classification is superior than another one obvi- ously. From Table 2 in the 20 datasets, Boosting-BAN did significantly and uniformly better than Boosting- MultiTAN.
[image:3.595.307.540.84.347.2]Table 1. Dataset used in the experiments.
No. Dataset Instances Classes Attributes Missing values
1 Anneal 898 6 38 √
2 Audiology 226 24 69 √
3 Breast Cancer 699 2 9 ×
4 Bupa 345 2 6 ×
5 Car 1728 4 6 ×
6 Cleveland 303 2 13 ×
7 Crx 653 2 15 √
8 German 1000 2 20 ×
9 House-votes- 84 435 2 16 √
10 Hypothyroid 3163 2 25 √
11 Iris 150 3 4 ×
12 Kr-rs-kp 3169 2 36 ×
13 LED 1000 10 7 ×
14 Mushroom 8124 2 22 √
15 Promoters 106 2 57 ×
16 Segment 2310 7 19 ×
17 Soybean Large 683 19 35 √
18 Tic-Tac-Toe 958 2 9 ×
19 Wine 178 3 13 ×
20 Zoology 101 7 16 ×
5. Conclusions
[image:4.595.300.533.102.575.2]GTAN and BAN classifiers are unstable, by setting dif-ferent parameters, we can form a number of difdif-ferent TAN and BAN classifiers. In this paper, multiple TAN classifiers are combined by a combination method called Boosting-MultiTAN that is compared with the Boosting- BAN classifier which is boosting based on BAN combi-nation. Finally, experimental results show that the Boos- ting-BAN has higher classification accuracy on most data sets.
Table 2. Experimental results.
No. Dataset Boosting-MultiTAN Boosting-BAN
1 Anneal 98.3 99.2
2 Audiology 76.2 78.8
3 Breast Cancer 95.5 95.9
4 Bupa 58.5 59.8
5 Car 87.1 85.5
6 Cleveland 82.7 84.6
7 Crx 85.2 86.5
8 German 70.8 74.6
9 House-votes-84 94.9 95.8
10 Hypothyroid 99.1 99.8
11 Iris 93.8 90.5
12 Kr-rs-kp 93.3 99.3
13 LED 73.9 72.3
14 Mushroom 99.9 100
15 Promoters 89.3 91.7
16 Segment 94.3 96.4
17 Soybean Large 92.6 93.7
18 Tic-Tac-Toe 74.7 79.2
19 Wine 97.3 98.5
20 Zoology 96.8 97.7
When implementing Boosting classifiers, we were able to calculate the value of c directly given our prior knowledge. Of course, in a real situation we would be very unlikely to know the level of class noise in advance. It remains to be seen how difficult it would prove to es- timate c in practice.
6. References
pean Conference (EuroCOLT’95), Barcelona, 13-15 March 1995, pp. 23-37.
[2] R. E. Schapire, Y. Freund, Y. Bartlett, et al., “Boosting the Margin: A New Explanation for the Effectiveness of Voting Methods,” In: D. H. Fisher, Ed., Proceedings of the 14th International Conference on Machine Learning, Morgan Kaufmann Publishers, San Francisco, 1997, pp. 322-330.
[3] Y. Freund, “Boosting a Weak Learning Algorithm by Majority,” Information and Computation, Vol. 121, No. 2, 1995, pp. 256-285.
[4] J. R. Quinlan, “Bagging, Boosting, and C4.5,” In: R. Ben- Eliyahu, Ed., Proceedings of the 13th National Confer-ence on Artificial IntelligConfer-ence, Portland, 4-8 August 1996, pp. 725-730.
[5] R. E. Schapire, “The Strength of Weak Learnability,” Machine Learning, Vol. 5, No. 2, 1990, pp. 197-227. [6] N. Friedman, D. Geiger and M. Goldszmidt, “Bayesian
Network Classifiers,” Machine Learning, Vol. 29, No. 2-3, 1997, pp. 131-163.
[7] J. Cheng and R. Greiner, “Comparing Bayesian Network
Classifiers,” In: K. B. Laskey and H. Prade, Ed., Pro-ceedings of the 15th Conference on Uncertainty in Artifi-cial Intelligence, Morgan Kaufmann Publishers, San Fran- cisco, 15 October 1999, pp. 101-108.
[8] J. Cheng, D. A. Bell and W. Liu, “An Algorithm for Bayes-ian Belief Network Construction from Data,” In: Pro-ceedings of Conference on Artificial Intelligence and Sta-tistics, Lauderdale, January 1997, pp. 83-90.
[9] H. B. Shi, H. K. Huang and Z. H. Wang, “Boosting- Based TAN Combination Classifier,” Journal of Com-puter Research and Development,Vol. 41, No. 2, 2004, pp. 340-345.
[10] UCI Machine Learning Repository. http://www.ics.uci. edu/~mlearn/ML.Repository.html
[11] Y. Freund and R. E. Schapire, “Experiments with a New Boosting Algorithm,” In: L. Saitta, Ed., Proceedings of the 13th International Conference on Machine Learning, Bari, 3-6 July 1996, pp. 148-156.