Advance Access publication 2016 September 14
The disappearing act: a dusty wind eclipsing RW Aur
I. Bozhinova,
1‹A. Scholz,
1‹G. Costigan,
2O. Lux,
3C. J. Davis,
4T. Ray,
5N. F. Boardman,
1K. L. Hay,
1T. Hewlett,
1G. Hodos´an
1and B. Morton
11SUPA, School of Physics and Astronomy, University of St Andrews, North Haugh, St Andrews KY16 9SS, UK 2Leiden Observatory, University of Leiden, PB 9513, NL-2300 RA Leiden, the Netherlands
3Astrophysical Institute and University Observatory, Schillerg¨asschen 2-3, D-07745 Jena, Germany
4Liverpool John Moores University, Astrophysics Research Institute, Liverpool Science Park, IC2 Building 146 Brownlow Hill, Liverpool L3 5RF, UK 5Dublin Institute for Advanced Studies, 31 Fitzwilliam Place, Dublin 2, Ireland
Accepted 2016 September 13. Received 2016 September 12; in original form 2016 June 30
A B S T R A C T
RW Aur is a young binary star that experienced a deep dimming in 2010–2011 in component A and a second even deeper dimming from summer 2014 to summer 2016. We present new unresolved multiband photometry during the 2014–2016 eclipse, new emission line spectroscopy before and during the dimming, archive infrared photometry between 2014 and 2015, as well as an overview of literature data. Spectral observations were carried out with the Fibre-fed RObotic Dual-beam Optical Spectrograph on the Liverpool Telescope. Photometric monitoring was done with the Las Cumbres Observatory Global Telescope Network and James Gregory Telescope. Our photometry shows that RW Aur dropped in brightness toR=12.5 in 2016 March. In addition to the long-term dimming trend, RW Aur is variable on time-scales as short as hours. The short-term variation is most likely due to an unstable accretion flow. This, combined with the presence of accretion-related emission lines in the spectra suggest that accretion flows in the binary system are at least partially visible during the eclipse. The equivalent width of [OI] increases by a factor of 10 in 2014, coinciding with the dimming event, confirming previous reports. The blueshifted part of the Hαprofile is suppressed during the eclipse. In combination with the increase in mid-infrared brightness during the eclipse reported in the literature and seen inWISEarchival data, and constraints on the geometry of the disc around RW Aur A we arrive at the conclusion that the obscuring screen is part of a wind emanating from the inner disc.
Key words: eclipses – stars: pre-main-sequence – stars: variables: T Tauri, Herbig Ae/Be.
1 I N T R O D U C T I O N
Classical T Tauri stars (TTS) are pre-main-sequence objects with strong irregular variability, first noted in a study of highly variable stars by Joy (1945). In that same work, RW Aur is identified as a T Tau type star with a spectrum rich in emission lines. Today, it is known that RW Aur is a visual binary with a separation of 1.4 arcsec between the primary and secondary components. The spectrum of the primary shows strong signatures of accretion and winds (e.g. Petrov et al.2001; Alencar et al.2005). The secondary, RW Aur B, is a late K-type TTS (Ghez, Neugebauer & Matthews 1993; Ghez, White & Simon1997; White & Hillenbrand2004) with little or no evidence of ongoing accretion. There are indications for the existence of more stellar/substellar companions in the system. The multiplicity study of T Tau stars by Ghez et al. (1993) reveals a possible tertiary component (RW Aur C) orbiting RW Aur B, with
E-mail:inb@st-andrews.ac.uk(IB);as110@st-anderws.ac.uk(AS)
a separation of 0.12 arcsec between the B and C stars. Furthermore, spectroscopic studies by Gahm et al. (1999) and Petrov et al. (2001) reveal periodic variations in the radial velocity of a number of lines in RW Aur A. The authors explore the possibility of a brown dwarf sized companion (RW Aur D) in close orbit around the primary as the cause for the observed spectroscopic variations.
Cabrit et al. (2006) examined CO maps of RW Aur from inter-ferometry. They estimated the size of the circumstellar disc around RW Aur A to be unusually small (40–57 au) and found evidence for a 600 au long structure of material trailing from the primary star. The disc size was calculated for a disc inclination between 45◦ and 60◦. Both the size of the disc and the ‘arm’ were suggested as evidence for the tidal disruption of the circumstellar disc from a recent interaction with the secondary RW Aur B. This tidal inter-action hypothesis is further backed up by recent hydrodynamical simulations of the RW Aur disc by Dai et al. (2015).
In 2010, RW Aur underwent a long-lasting dimming event, that had never been observed before. The star dropped by∼2 mag in the optical and remained in that state for several months. Rodriguez et al.
2016 The Authors
at University of St Andrews on December 5, 2016
http://mnras.oxfordjournals.org/
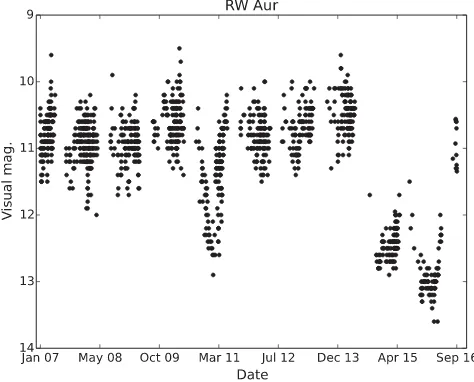
Figure 1. American Association of Variable Star Observers (AAVSO) vi-sual light curve for RW Aur between 2007 and 2016. The 2010 and 2014 dimmings are clearly visible.
(2013) presented a photometric investigation of this event, looking at KELT and American Association of Variable Star Observers (AAVSO) data. They conclude that the most likely explanation of this event is obscuration by material located ∼180 au from RW Aur A. It is noted that the estimated occulting body lies far beyond the outer edge of the disc, but is still within the size of the tidally disrupted arm and therefore likely a part of it.
In 2014, RW Aur entered a second long-lasting, even deeper (∼3 mag; Antipin et al.2015) minimum. Fig.1shows an AAVSO visual light curve of RW Aur up until 2016 August, including both dimming events. As can be seen in this light curve, there are clear signs that the star has recovered to its out-of-eclipse brightness in 2016 August, indicating the end of the second eclipse. Our own pho-tometry on August 25 and 26 confirms this, withR-band magnitudes of 10.7 and 10.6 (Scholz et al.2016).
Petrov et al. (2015) performed a spectroscopic analysis of emis-sion lines associated with accretion, wind and jets in and out of the 2014 minimum. They found enhancement in the equivalent widths (EWs) of [OI] and [SII] (forbidden lines associated with jets), but no increase in the fluxes. Additionally, an increase in the strength of the resonant lines CaIIand NaIwas reported. Furthermore, they found no change in the emission of Hαand HeI, lines associated with accretion activity. The authors concluded that the obscuring body only covers the star and inner regions of the system, while the outer parts of the wind and jets remained unaffected. This effect was attributed to dust grains being lifted up into the line of sight through interactions with the winds. In addition, Shenavrin, Petrov & Grankin (2015) report results of infrared photometry in JHKML in the period 2010–2015. They find a drop in JHK brightness cor-responding to the 2014 dimming event, but a simultaneous increase in brightness in M and L. The excess IR emission is attributed to hot dust of about 1000 K, located around the inner disc rim, 0.1–0.2 au away from the star. It is further speculated that the hot dust could then be lifted up into the wind, supporting the scenario presented in Petrov et al. (2015).
The dusty wind idea is in contrast to the tidal arm dimming sce-nario (Rodriguez et al. 2013,2016) where an occultation by the tidal arm is expected to at least partially obscure the inner disc and possibly cover the excess IR emission. Rodriguez et al. (2016) also report a smaller dimming in 2012–2013 and argue that the
kinematics of this event fit the values derived from their analysis of the 2010 eclipse. Their analysis of the 2014 dimming using the same method is hampered by the fact that the ingress for the eclipse happened during the seasonal observing gap and its duration is not constrained yet. The tidal arm dimming scenario is potentially supported by the hydrodynamical simulations by Dai et al. (2015). Their simulations suggest the presence of material in a bridge be-tween RW Aur A and B, with several particles also crossing the line of sight to the system.
Finally, Takami et al. (2016) present a spectroscopic study of the system between 2010 October and 2015 January and argue that neither the tidal arm nor dusty wind scenario alone can account for the complex variability seen in the lines in and out of the eclipses. The authors further explore time-variable mass accretion as an al-ternative explanation to the observed dim and bright states of the system within the 2010–2015 time frame.
In this study, we present photometric and spectroscopic observa-tions of RW Aur taken just before and during the 2014 dimming. We explore the photometric variability in several optical and infrared bands along with EW and profile analysis of the Hα, HeIand [OI] lines to provide further evidence to the above scenarios.
2 O B S E RVAT I O N S A N D DATA R E D U C T I O N
2.1 LCOGT
A portion of the photometric data presented in this work was taken with the Las Cumbres Observatory Global Telescope Network (LCOGT; Brown et al.2013) as part of programmes STA2014B-002 and STA2015A-002. This set spans the period 2014 December 26– 2016 January 11. All images were taken with SBIG cameras on 1-metre telescopes. The detectors have a size of 4K×4K pixels, 9µm pixel size, field of view of 15.8×15.8 arcmin and resolution of 0.464 arcsec pix−1. Each epoch consist of a set of images of 10 s and 100 s exposure time in four bandpasses (Sloanu, g, randi; Fukugita et al.1996). In some cases, where observations have been interrupted and resumed, we have multiple images per epoch. The main science frames are the 100 s exposures, the shorter exposures were taken in the event of saturation of objects in the field, but have not been used in the current work. Table1summarizes the epochs and exposures for each filter. The raw images have been reduced with the LCOGT data reduction pipeline.1
2.2 JGT
As a complement to the LCOGT observations, we have also moni-tored RW Aur with the 0.94-metre James Gregory Telescope (JGT) at the University of St Andrews Observatory. The JGT has an An-dor CCD detector, 1K×1K pixels, 13µm pixel size, resolution of∼1.0 arcsec pix−1and a field of view of about 15 arcmin×15 ar-cmin. At each epoch, we continuously monitored the target for a period of at least 1 h in the CousinRband in order to explore its short time-scale behaviour. The exposure time is 30–60 s, depend-ing on conditions. The JGT data set (summarized in Table2) was taken between 2015 March and 2016 March. Standard reduction including bias subtraction and flat-fielding was performed.
1http://lcogt.net/observatory/data/pipeline/
at University of St Andrews on December 5, 2016
http://mnras.oxfordjournals.org/
Table 1. Summary of epochs and number of 100 s exposures per epoch in each filter from the LCOGT data set.
MJD Date u g r i
(3543 Å) (4770 Å) (6231 Å) (7625 Å)
57017 2014-12-26 0 3 3 3
57020 2014-12-29 1 2 2 2
57038 2015-01-16 1 1 1 1
57041 2015-01-19 1 1 1 2
57043 2015-01-21 1 1 1 1
57046 2015-01-24 1 1 1 1
57049 2015-01-27 1 2 2 2
57051 2015-01-29 1 3 2 2
57056 2015-02-03 1 1 1 1
57058 2015-02-05 1 1 1 1
57062 2015-02-09 0 2 2 2
57077 2015-02-04 1 1 1 1
57088 2015-03-07 1 1 1 1
57092 2015-03-11 1 1 1 2
57097 2015-03-16 1 0 1 1
57104 2015-03-23 1 1 1 1
57109 2015-03-28 0 1 1 1
57258 2015-08-24 1 1 1 1
57260 2015-08-26 1 1 1 1
57262 2015-08-28 1 1 1 1
57264 2015-08-30 1 1 1 1
57266 2015-09-01 1 1 1 1
57268 2015-09-03 1 1 1 1
57270 2015-09-05 1 1 1 1
57278 2015-09-13 1 1 1 1
57280 2015-09-15 1 1 1 1
57292 2015-09-27 1 1 1 1
57294 2015-09-29 1 1 1 1
57315 2015-10-20 1 1 1 1
57321 2015-10-26 1 1 1 1
57323 2015-10-28 2 2 2 1
57352 2015-11-26 1 1 1 1
57360 2015-12-04 1 1 1 1
57365 2015-12-09 1 1 1 1
57367 2015-12-11 1 1 1 1
57372 2015-12-16 1 1 1 1
57375 2015-12-19 1 1 1 1
57377 2015-12-21 1 1 1 1
57380 2015-12-24 1 1 1 1
57382 2015-12-26 1 1 1 1
57395 2016-01-08 1 1 1 1
57398 2016-01-11 1 1 1 1
Table 2. Summary of photometric observations with the JGT. This table lists date, number of images, exposure time and average Cousin R-band magnitude of RW Aur for each night.
MJD Date No images texp. (s) R(mag)
57092 2015-03-11 270 60 11.89
57099 2015-03-18 160 60 12.21
57104 2015-03-23 110 60 11.99
57110 2015-03-29 130 60 12.08
57337 2015-11-11 240 30 12.71
57367 2015-12-11 210 60 12.47
57368 2015-12-12 270 30 12.53
57401 2016-01-14 250 60 12.54
57428 2016-02-10 320 60 12.65
57429 2016-02-11 240 60 12.61
57454 2016-03-07 240 30 12.41
[image:3.595.308.548.102.315.2]57478 2016-03-31 110 60 12.43
Table 3. Summary of spectral observation epochs and mean EW measure-ments for the Hα, [OI] and HeIemission Line. All EWs are in Å. Epochs in which the target was not centred in the IFU, i.e. not completely covered, are indicated in the last column.
MJD Date Hα [OI] HeI IFU coverage
56330 2013-02-07 83.88 0.54 1.01 Partial
56363 2013-03-12 88.07 0.54 0.37 Complete
56500 2013-07-27 77.94 0.7 0.42 Complete
56524 2013-08-20 74.87 0.62 1.09 Complete
56544 2013-09-09 55.39 0.37 0.6 Complete
56565 2013-09-30 35.53 0.36 0.49 Complete 56586 2013-10-21 60.79 0.55 0.64 Complete 56611 2013-11-15 78.96 0.49 0.64 Complete 56644 2013-12-18 42.68 0.69 1.11 Complete
56671 2014-01-14 51.9 0.61 0.65 Complete
56724 2014-03-08 52.21 0.48 0.35 Complete 56740 2014-03-24 45.39 0.55 0.43 Complete
56752 2014-04-05 69.7 0.54 1.13 Complete
56910 2014-09-10 21.29 1.9 0.5 Partial
57028 2015-01-06 17.97 2.61 0.4 Partial
57034 2015-01-12 16.05 4.63 0.14 Complete
57039 2015-01-17 32.25 4.96 0.32 Partial
57049 2015-01-27 26.59 5.75 0.18 Partial
57079 2015-02-26 23.81 3.64 0.72 Partial
2.3 Spectral observations
Spectral observations were performed with FRODOSpec (Fibre-fed RObotic Dual-beam Optical Spectrograph), a robotic integral field spectrograph on the Liverpool Telescope (Steele et al.2004). Data covers 19 nights between 2013 February and 2015 February with three spectra taken each night (Table3). Both blue (3900–5100Å) and red arm (5900–8000 Å) observations were completed. Due to the very low S/N, the blue arm spectra were not considered in the following work. The resolution of the red arm in high-resolution mode is∼5300. The integral field covers 9.84 arcsec×9.84 arcsec, with 12 lenslets each with diameter of 0.82 arcsec on-sky. The exposure time is 300 s for all spectra.
Due to the robotic nature of the telescope, in some of the obser-vations the source is either not within the integral field unit (IFU) or is not centred within the IFU. The main result appears to be an increase in the noise within the spectrum. We only considered the cases where the point spread function (PSF) peak lies within the IFU. In the majority of cases, the full PSF lies completely within the IFU. In some cases (see Table3), the peak of the PSF lies on the edge of the detector (as noted by the spread in the PSF across the IFU edge), and so we are missing flux from one of the wings of the PSF. We tested for differences in the measured EW in these epochs and no significant difference was seen.
We reduce the data using the FRODOSpec pipeline (Barnsley, Smith & Steele2012). The pipeline first performs basic CCD pro-cessing, including bias subtraction, overscan trimming and CCD flat-fielding. A continuum lamp is used to find the fibre positions and find a polynomial trace for each. Flux is extracted for each fibre in the target frame, continuum and arc lamp frames. Wavelength calibration is then performed for each spectrum and transmission correction, using the continuum lamp. The spectra are rebinned in order to determine a single wavelength solution for the entire data cube. Finally, sky extraction is done by combining the signal from sky only fibres. The spectra are not flux calibrated. We also do not resolve RW Aur A and B.
at University of St Andrews on December 5, 2016
http://mnras.oxfordjournals.org/
[image:3.595.46.285.589.732.2]Figure 2. RW Aur light curves from LCOGT data. Blue circles –uband (3543 Å), green stars –gband (4770 Å), red triangles –rband (6231 Å), black squares –iband (7625 Å). The light curves are shifted by an arbitrary constant for clarity. All light curves show a similar shape.
3 DATA A N A LY S I S
3.1 Photometry
For the LCOGT and JGT images, we perform aperture photometry using the standard photometricIRAFpackagedaophot.2We measure RW Aur along with 10–15 well exposed, unsaturated comparison stars. The aperture is set to 2.5 times the full width at half-maximum of the PSF. We construct differential light curves by calculating a reference light curve from well-exposed comparison stars and subtracting that from the RW Aur raw light curve. This ensures systematic effects such as variable weather conditions are removed from the final data. The reference curves were inspected for any outlying points and a few epochs were removed (due to proximity of the Moon).
The light curves derived from the LCOGT data are presented in Fig. 2. Photometric accuracy (defined as the lower envelope of the RMS of the reference stars) is of the order of a few per cent, with RW Aur being a clear, highly variable outlier. The RW Aur curves in the four bands have similar shapes and amplitudes (between 0.7 and 2.1 mag, Table4). The amplitudes are calculated as the max–min difference with an uncertainty of about 0.02 mag. A visual inspection shows a very good correlation between the shape of the light curves in therandibands, but the correlation becomes weaker towards the bluer wavelengths. The brightness of RW Aur has continued to decline throughout the 2015–2016 winter observing season in all filters. The similarity in the shapes of the light curves in the separate bands before and after the 2015 observing gap suggests the continued drop in flux is caused by the same source as the initial eclipse in 2014.
Standard aperture photometry was applied to the JGT images using∼6 reference stars. TheRband was shifted to standard using the USNO-B1.0 mag for three reference stars (Monet et al.2003). The error is∼0.01 mag. The differential light curves are presented in Fig.3. The light curves show a significant irregular variability (up to 0.2 mag) on time-scales of hours.
2http://iraf.noao.edu/docs/photom.html
Table 4. Amplitudes (A) and reddening slopes for the ob-served data and interstellar extinction. The error for the observed amplitudes is 0.02 mag. The observed slopes correspond to the best (linear regression) fit to the photo-metric data. We use the extinction law by Cardelli, Clayton & Mathis (1989) to calculate extinction amplitudes and red-dening slopes. In this table, we present the amplitudes and slopes calculated forRV =3.1 andAV =0.9, which are the parameter values producing the best fit to the observed
r-band amplitude.
Bands Obs.A Exct.A
u 2.05 1.49
g 1.22 1.12
r 0.81 0.81
i 0.70 0.61
Colour Obs. slope Exct. slope
u–g 1.82 4.08
g–r 2.8 3.68
r–i 3.89 4.02
3.2 Mid-IRWISEarchival data
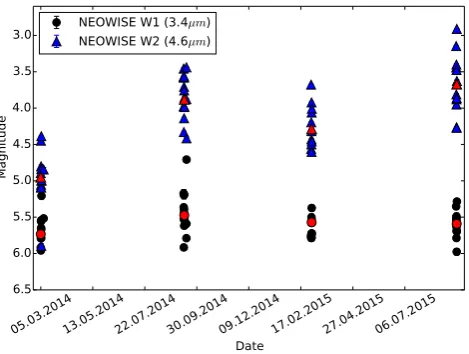
In Fig.4, we present archive post-cryoWISE(NEOWISE; Mainzer et al.2011,2014) observations of RW Aur between 2014 and 2015. This data set consists of four blocks of observations, each consisting of several measurements over the course of 1–2 consecutive nights. The first block has been taken prior to the start of the 2014 dimming, while the remaining three blocks are in the faint state. The red data points represent the average value of the measurements of a given block. The star shows clear variability on time-scales of hours and days in all blocks. After the dimming, the average magnitude inW1 andW2 increases by 0.14–0.26 and 0.66–1.28 mag, respectively. The photometric error is∼0.03 mag inW1 and∼0.01 mag inW2. The changes in the average values in the WISEbands after the eclipse are comparable to theM-andL-band brightenings reported by Shenavrin et al. (2015), therefore solidifying the evidence for the mid-IR excess emission increase coinciding with the dimming in the optical.
3.3 Spectral analysis
The FRODOSpec spectra show clear emission lines typically asso-ciated with accretion (Hα(6563 Å) and He I (6678 Å)) and outflow ([OI] (6300 Å)). We present profile time series for the Hαand [OI] lines in Figs5and6. We measure EWs for these three lines. There are three measurements for each consecutive night. We normalize all spectra within the same spectral range to minimize any variabil-ity from changing weather conditions. The IFU positioning does not seem to have an effect on EWs. The results are presented in Figs7and8, and Table3. The errors in the plots are taken to be the spread in measurements over one night (three observations). We observe a drop in Hαand increase in the [OI] during the dimming event. The HeIshows no significant change. The HαEW drops from 80–90 Å in the bright state down to∼20 Å in the dim state. However, we note the HαEW begins to decrease prior to the 2014 eclipse (Fig.7) and it is therefore possible the change in HαEW is not solely related to the dimming event, as the line is known to be intrinsically variable (Petrov et al.2001; Alencar et al.2005). The [OI] EW increases from 0.5 to 5 Å, i.e. by a factor of 10.
We also show time series of the Hαand [OI] profiles in Figs5 and6. In each case, the date is given beside the mean profile for that
at University of St Andrews on December 5, 2016
http://mnras.oxfordjournals.org/
[image:4.595.329.523.162.274.2]Figure 3. RW Aur JGT light curves,Rband. Significant irregular variability (up to 0.2 mag) on time-scales of hours can be seen throughout the entire observing season.
night. The characteristic broad, double-peaked profile of the Hαline can clearly be seen in both the bright and dim state. However, during the dimming the entire profile is suppressed and the blueshifted peak appears significantly weaker than the redshifted peak. We measure the HαEW forv<0 km s−1 andv>0 km s−1in order to quantify
the difference between the change in the blue and redshifted peaks after the dimming. The line EW decreases by a factor of∼7 after the eclipse forv<0 km s−1and by a factor of∼3 forv>0 km s−1. The difference in the two factors suggests that the blueshifted peak suppression is indeed significant. In contrast to the Hαline, the [OI]
at University of St Andrews on December 5, 2016
http://mnras.oxfordjournals.org/
Figure 3 –continued
profile becomes more prominent during the dimming, showing a broad and asymmetric emission.
4 D I S C U S S I O N
We present new spectroscopic and photometric observations of RW Aur during the dimming in 2014–2016. In addition, we review the previous and new observational constraints for the system.
4.1 Photometric variations
The dimming event that started in 2014 is continuing through our observing period. The system has become even fainter in the optical during the 2015–2016 winter observing season (see Figs1and2). In addition to the long-term dimming trend, we clearly see irregular short time-scale variations in the JGT (Fig.3) and LCOGT (Fig.2) data. These variations could be related to small-scale changes in
at University of St Andrews on December 5, 2016
http://mnras.oxfordjournals.org/
Figure 4. NEOWISE observations of RW Aur before and after the 2014 dimming. The red data points represent the average magnitude of RW Aur for each observational block. The system becomes brighter in both bands during the 2014 eclipse (see Section 3.2).
extinction along the line of sight. However, the irregular components in the morphology of the JGT light curves better resemble burst-like events. Such morphology is typically associated with changes in an unstable accretion flow for T Tau stars (see Herbst et al. 1994; Cody et al.2014for an overview of the different types of photometric variability displayed by T Tau stars). Being able to see such short time-scale irregular variations in RW Aur implies that the accretion flow in the system remains at least partially visible during the dimming.
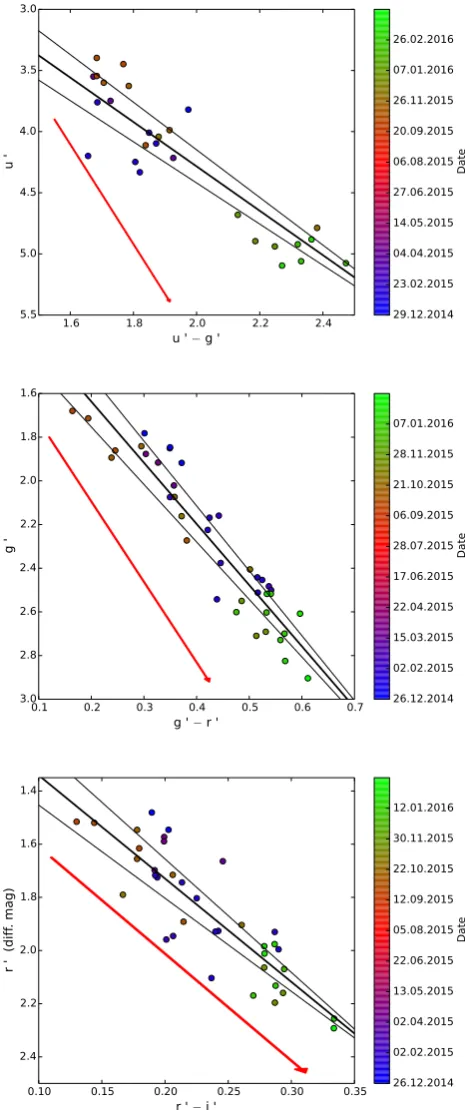
In addition to the overall drop in photometric flux in the optical, colour–magnitude diagrams of our LCOGT data (Fig.9) reveal a significant long-term reddening trend since the start of the eclipse. We compare the observed reddening with models for interstellar ex-tinction by Cardelli et al. (1989). Extinction fails to fit the observed colours simultaneously. In particular, the model underpredicts the observedu-band amplitude and is unable to reproduce theu–g red-dening slope. We therefore conclude that the long-term redred-dening trend is not consistent with interstellar-like extinction.
We also attempt to explain the reddening with a simple hotspot model, where the star and spots are approximated by black bodies and the spot temperature and filling factor are varied in order to fit the observed light-curve amplitudes (e.g. Bouvier et al.1995; Scholz et al.2009).
We find a number of parameter values that produce amplitudes and reddening slopes similar to the observed ones, especially in the red portion of the spectrum. However, hotspots have one major prob-lem with explaining the observed long-term reddening. Hotspots form at the stellar surface as a result from accreting material near-free-falling on to the star and creating shocks. As the star rotates the spots come in and out of view, resulting in a photometric variably on time-scales comparable with the stellar rotational period (typically several days for T Tau stars). This is in contrast to the long-term dimming of RW Aur which has lasted for months. While accretion may still play a role for the short time-scale variability of RW Aur, hotspots cannot be the cause for the observed long-term reddening, where the system has continuously been getting redder for months. An alternative explanation for the observed long-term reddening arises from the fact that our photometry does not resolve RW Aur A and B. Antipin et al. (2015) present resolved photometry of the system. Their measurements (after the start of the dimming) show an
R-band magnitude of 13.08 and 11.97 for the A and B components, respectively. Our JGT photometry yields R∼12 mag suggesting that the red part of the spectrum in our observations is most likely dominated by the B component. We can therefore interpret the observed long-term reddening as the A component becoming faint enough that the B component becomes the dominant source of flux, making the entire system appear redder while simultaneously getting dimmer as we lose flux from RW Aur A.
4.2 Spectral signatures
Spectroscopy provides more information about accretion and out-flow in young stellar systems. In the classical magnetospheric ac-cretion scenario the innermost region of the circumstellar disc is threaded by stellar magnetic field lines. Material is channelled from the disc on to the star-forming accretion columns at near-free-fall velocities, with a shock forming at the surface of the star. The shock and accretion columns generate Hαemission. The accretion-related Hα emission lines are typically broad with EWs of over 10 Å. Other emission lines related to CTTS accretion include permitted lines of HeI, OIand CaII. For a review of accretion signatures, we refer the reader to Mohanty, Jayawardhana & Basri (2005) and references therein. In addition to accretion indicators, CTTS often shows outflow-related forbidden line emission such as [OI] lines (Appenzeller, Oestreicher & Jankovics1984; Hartigan, Edwards & Ghandour1995).
Our spectra show that the EW of the [O I] (6300 Å) line increases by a factor of 10 after the eclipse (Figs6and7). The observed EW increase is in agreement with measurements by Petrov et al. (2015) and Takami et al. (2016). Petrov et al. (2015) attribute the change in the forbidden line’s EW to a drop in the photospheric continuum, as reported by the resolved photometry of RW Aur A by Antipin et al. (2015). Petrov et al. (2015) further imply that the obscuring body must be blocking the inner parts of the system while the outflow remains visible.
The HeI(6678 Å) and Hαemission lines remain clearly visible in our spectra after RW Aur enters the eclipse. This again indicates that at least part of the accretion flow is still visible. The HeIEW remains constant (Fig. 8), implying the He-emitting regions are obscured in the same way as the photosphere.
The HαEW decreases after the eclipse (Fig.7). Our EW mea-surements show lower values for the line during the dimming compared to the values reported by both Petrov et al. (2015) and Takami et al. (2016). We attribute this to the fact that our spec-troscopy does not resolve the A and B components, hence we get an additional flux in the continuum from RW Aur B, resulting in a lower EW value.
The Hαline profiles show a suppressed blueshifted peak after the start of the dimming (Fig.5). This can also be seen in the Hαprofiles from Takami et al. (2016) from both the 2010 and 2014 dimmings. This blueshifted absorption can be interpreted as the presence of an absorbing material moving towards the observer’s line of sight, i.e. an outflow.
4.3 Origin of the eclipse
In Section 1, we introduce two possible explanations for the long dimming event observed in RW Aur. The obscuring screen could either be a tidal arm in the outer disc, as suggested by Rodriguez et al. (2013,2016), or a wind emanating in the inner disc, suggested by Petrov et al. (2015). Our observations provide new evidence to support the occultation by a wind.
at University of St Andrews on December 5, 2016
http://mnras.oxfordjournals.org/
Figure 5. Full time series of all Hαprofiles. The top panel shows the observations before the dimming event and the bottom panel shows the spectra taken after the start of the eclipse. The red lines indicate the mean profile for that night’s observation. The red shading indicates the spread between the individual three spectra for that night.
[image:8.595.47.281.58.524.2]In particular, we show that the blueshifted portion of the Hα line is suppressed since the beginning of the eclipse, indicating the presence of outflowing and thus blueshifted gas with velocities of 100–200 km s−1in the occulting screen. This scenario is further supported by the increase in the mid-IR fluxes of the system in eclipse, reported by Shenavrin et al. (2015) and visible in archive NEOWISE data in theW2 band (Fig.4). Shenavrin et al. (2015) fit a blackbody to the spectral energy distribution of RW Aur in its faint state and find that the excess IR emission is plausibly explained by the presence of hot dust with temperature around 1000 K along the line of sight.
Figure 6. Partial time series of the [OI] profiles. The red lines indicate the mean profile for that night’s observation. While the red shading indicates the spread between the individual three spectra for that night.
Figure 7. Mean EW versus date for Hα(blue dots) and [OI] (green trian-gles). Here the mean EW is taken from the three observations each night. The error bars represent the differences between the three observations that night. We see an increase in the [OI] by a factor of 10 after the dimming. We also observe a drop in the HαEW.
Thus, the occulting body is outflowing and contains hot dust, which fits with a scenario where a wind emanating from the inner disc eclipses the star RW Aur A. These two facts together are also inconsistent with the tidal arm scenario, in which the occulting material would not be expected to move rapidly along the line of sight and the dust in the screen would be cold. If the eclipse indeed arises in a wind, the long duration of the current event would imply that the outflowing screen stretches azimuthally over a large portion
at University of St Andrews on December 5, 2016
http://mnras.oxfordjournals.org/
[image:8.595.312.543.401.575.2]Figure 8. Mean EW versus date for HeI. Here the mean EW is taken from the three observations each night. The error bars represent the differences between the three observations that night. No significant change in the HeI EW is observed.
of the inner disc. We note that the recent resolved X-ray detection of RW Aur shows a slight soft X-ray extension of RW Aur A along the blueshifted jet axis close to the star (Skinner & G¨udel 2014) – this could be related to the obscuring screen discussed here. Furthermore, Schneider et al. (2015) present resolved X-ray and NIR observations of the system in eclipse and provide further evidence for the presence of an obscuring screen with hot material located close to the star.
In addition, there is also a geometrical argument in favour of a blocking screen located above the inner disc. The CO map modelling from Cabrit et al. (2006) found an inclination between 45◦and 60◦ for the large-scale disc. The inclination of the jet to the line of sight is measured to be 46±3◦(L´opez-Mart´ın, Cabrit & Dougados 2003). These values indicate that the large-scale disc is far from edge-on, which makes it difficult to lift material in the outer disc into the line of sight. In fact, the hydrodynamical simulations of the tidal arm scenario by Dai et al. (2015) give a best-fitting value of 64◦for the inclination, and thus does not match the constraints from observations.
On the other hand, the modelling ofK-band Keck interferometric observations tracing the continuum and gas in the inner region of the disc results in an inclination angle of 75◦(Eisner, Hillenbrand & Stone2014, table 6) for an emitting region within a fraction of 1 au. This is a significantly higher inclination and closer to edge-on than for the outer disc. We note that some of the Keck interferometer data for RW Aur A was taken during the first eclipse in 2010/2011. The discrepancy in the inclinations between inner and outer disc may be evidence for a large-scale warp in the disc, possibly caused by interaction with the companion RW Aur B. Thus, RW Aur B may have an effect on the disc, but it is unlikely to be the direct cause of the feature that eclipses RW Aur A.
Adopting the value from the inner disc for the disc inclination, the material in the occulting screen needs to be vertically displaced from the disc mid-plane by at least 0.26 times the distance from the central object. This value is comparable to the maximum vertical extent of the inner disc found in the so-called ‘dippers’, TTS with periodic eclipses caused by disc warps caused by accretion channelled by a magnetic field tilted with respect to the rotational axis (Bouvier et al.1999; McGinnis et al.2015). RW Aur is not known to be a dipper, perhaps because the tilt of its magnetic field is not sufficient.
Figure 9. Colour–magnitude diagrams constructed from all LCOGT obser-vations. The epochs of observations are colour coded. The black solid line indicates the best linear fit to the data with thinner lines indicating the error in the slope estimation. The red arrow is the interstellar extinction slope for
RV=3.1 andAV=0.9, where theAVvalue is selected such that the resulting extinction in therband best matches the observed amplitude in ther-band light curve.
at University of St Andrews on December 5, 2016
http://mnras.oxfordjournals.org/
[image:9.595.312.545.60.616.2]Based on the high value for the inner disc inclination, however, it is conceivable that a magnetically driven disc wind can lift material into the line of sight.
The jet of RW Aur A has been extensively studied with high-resolution imaging. It is one of the densest among the TTS in-vestigated in detail, but the mass outflow rate seems to be stable within an order of magnitude along the jet axis and in both lobes at 10−9–10−8M
yr−1(Melnikov et al.2009). However, in the past there have been clear indications for strong variability in the forbid-den lines caused by the wind as well as in the blueshifted portion of Hα(Alencar et al.2005).
In the standard scenario of magnetospheric accretion, the wind is thought to be coupled to the accretion, thus, we would expect that a change in the outflow rate or geometry, as indicated by our interpretation of the RW Aur dimming, is preceded by strong vari-ability in the accretion flow. As far as we are aware, there is no evidence for a recent accretion burst in RW Aur. Its accretion rate is relatively high (10−7–10−6M
yr−1) compared with other CTTS with similar mass, but seems to be relatively stable (e.g. Costigan et al.2014). Thus, changes in the wind characteristics might not always be coupled to changes in the accretion properties. One pos-sible trigger for a wind outburst could be an interaction between the disc and the putative stellar or substellar spectroscopic companion to RW Aur A (Gahm et al.1999; Petrov et al.2001). However, it is unclear how such an interaction can produce the sudden onset of wind activity multiple times over the course of the last∼7 yr, with no precedents observed in the previous∼50 yr. Another alternative may be that the fly-by of RW Aur B has caused an instability in the disc of RW Aur A, although modelling this scenario is beyond the scope of this study.
We encourage further multiband photometric and spectroscopic monitoring of accretion and outflow signatures of RW Aur to further test and solidify our understanding of the system.
AC K N OW L E D G E M E N T S
We acknowledge with thanks the variable star observations from the AAVSO International Database contributed by observers worldwide and used in this research. This publication also makes use of data products from NEOWISE, which is a project of the Jet Propul-sion Laboratory/California Institute of Technology, funded by the Planetary Science Division of the National Aeronautics and Space Administration. The Liverpool Telescope is operated on the island of La Palma by Liverpool John Moores University in the Spanish Observatorio del Roque de los Muchachos of the Instituto de As-trofisica de Canarias with financial support from the UK Science and Technology Facilities Council. This work makes use of observations from the LCOGT network, taken under programmes STA2014B-002 and STA2015A-STA2014B-002. The authors acknowledge support from the Science and Technology Facilities Council through grants no. ST/K502339/1 and ST/M001296/1, and the Science Foundation Ireland through grant no. 10/RFP/AST2780.
R E F E R E N C E S
Alencar S. H. P., Basri G., Hartmann L., Calvet N., 2005, A&A, 440, 595 Antipin S. et al., 2015, Inf. Bull. Var. Stars, 6126, 1
Appenzeller I., Oestreicher R., Jankovics I., 1984, A&A, 141, 108 Barnsley R. M., Smith R. J., Steele I. A., 2012, Astron. Nachr., 333, 101 Bouvier J., Covino E., Kovo O., Martin E. L., Matthews J. M., Terranegra
L., Beck S. C., 1995, A&A, 299, 89 Bouvier J. et al., 1999, A&A, 349, 619 Brown T. M. et al., 2013, PASP, 125, 1031
Cabrit S., Pety J., Pesenti N., Dougados C., 2006, A&A, 452, 897 Cardelli J. A., Clayton G. C., Mathis J. S., 1989, ApJ, 345, 245 Cody A. M. et al., 2014, AJ, 147, 82
Costigan G., Vink J. S., Scholz A., Ray T., Testi L., 2014, MNRAS, 440, 3444
Dai F., Facchini S., Clarke C. J., Haworth T. J., 2015, MNRAS, 449, 1996 Eisner J. A., Hillenbrand L. A., Stone J. M., 2014, MNRAS, 443, 1916 Fukugita M., Ichikawa T., Gunn J. E., Doi M., Shimasaku K., Schneider
D. P., 1996, AJ, 111, 1748
Gahm G. F., Petrov P. P., Duemmler R., Gameiro J. F., Lago M. T. V. T., 1999, A&A, 352, L95
Ghez A. M., Neugebauer G., Matthews K., 1993, AJ, 106, 2005 Ghez A. M., White R. J., Simon M., 1997, ApJ, 490, 353 Hartigan P., Edwards S., Ghandour L., 1995, ApJ, 452, 736
Herbst W., Herbst D. K., Grossman E. J., Weinstein D., 1994, AJ, 108, 1906 Joy A. H., 1945, ApJ, 102, 168
L´opez-Mart´ın L., Cabrit S., Dougados C., 2003, A&A, 405, L1 McGinnis P. T. et al., 2015, A&A, 577, A11
Mainzer A. et al., 2011, ApJ, 731, 53 Mainzer A. et al., 2014, ApJ, 792, 30
Melnikov S. Y., Eisl¨offel J., Bacciotti F., Woitas J., Ray T. P., 2009, A&A, 506, 763
Mohanty S., Jayawardhana R., Basri G., 2005, ApJ, 626, 498 Monet D. G. et al., 2003, AJ, 125, 984
Petrov P. P., Gahm G. F., Gameiro J. F., Duemmler R., Ilyin I. V., Laakkonen T., Lago M. T. V. T., Tuominen I., 2001, A&A, 369, 993
Petrov P. P., Gahm G. F., Djupvik A. A., Babina E. V., Artemenko S. A., Grankin K. N., 2015, A&A, 577, A73
Rodriguez J. E., Pepper J., Stassun K. G., Siverd R. J., Cargile P., Beatty T. G., Gaudi B. S., 2013, AJ, 146, 112
Rodriguez J. E. et al., 2016, AJ, 151, 29 Schneider P. C. et al., 2015, A&A, 584, L9
Scholz A., Xu X., Jayawardhana R., Wood K., Eisl¨offel J., Quinn C., 2009, MNRAS, 398, 873
Scholz A., Bozhinova I., Lux O., Pannicke A., Mugrauer M., 2016, Astron. Telegram, 9428
Shenavrin V. I., Petrov P. P., Grankin K. N., 2015, Inf. Bull. Var. Stars, 6143, 1
Skinner S. L., G¨udel M., 2014, ApJ, 788, 101
Steele I. A. et al., 2004, in Oschmann J. M., Jr, ed., Proc. SPIEConf. Ser. Vol. 5489, Ground-based Telescopes. SPIE, Bellingham, p. 679 Takami M. et al., 2016, ApJ, 820, 139
White R. J., Hillenbrand L. A., 2004, ApJ, 616, 998
This paper has been typeset from a TEX/LATEX file prepared by the author.
at University of St Andrews on December 5, 2016
http://mnras.oxfordjournals.org/