Simulation of a Four-Car Elevator Operation Using MATLAB
Saw Soon King & Omrane Bouketir School of Electrical and Electronic Engineering
University of Nottingham, Malaysia Campus Jalan Broga 43500 Semenyih Selangor, MALAYSIA Tel: 60-3-8924-8159 E-mail: [email protected]
Abstract
The design and simulation of a four-cars-elevator controller in a nine storey building is described in this paper. The design and simulation were accomplished using MATLABTM fuzzy logic toolbox. The logic of the controller of a multi-car elevator has to be designed in such a way that the average waiting time is minimized while keeping the energy consumption of the system optimum. This is a multi-criteria optimization problem in stochastic environment and is best approached through Artificial Intelligent techniques. The work here focuses mainly on extracting the rules to minimize factors (i.e. waiting time, travelled distance and riding time) in order to minimize the energy consumed by the system. In this paper a detailed algorithm is presented to achieve the multiple objectives of minimizing the waiting time and the distance travelled simultaneously. This was accomplished by distributing different weightage to different quantities and then minimizing a combined cost. A simulator has been built with interactive GUI in Matlab to evaluate the efficacy of the algorithm.
Keywords:Elevator, Fuzzy Logic, Membership Function, Optimization, Simulator
1. Introduction
Elevators are often a requirement in new buildings with multiple floors throughout the world. In high rise buildings, there is a need for intelligent elevator control system in order to obtain optimum performance.
Usually a high rise building contains more than one elevator to increase the optimization of the elevator performance. When a few hall requests are registered, the elevator controller will decide which of the elevator will serve which of the incoming hall requests. Therefore the controller plays an important role in determining the time for which the passengers have to wait before the elevator arrives (waiting time). The waiting times of the passenger for an elevator to arrive or to serve their request are often heard as complaints by the passengers. Consequently the controller will reduce the waiting time of the passenger. However, in the process of reducing the waiting time, other quantities like the time spent by the people in the elevator (riding time) and the total distance travelled by the elevator increases, which is also unwanted. Therefore an intelligent elevator control system is required to solve this problem of optimization of multiple objectives. The multiple objectives in the current controller design are minimization of waiting time and distance travelled simultaneously.
However, an optimum solution to this problem is not known yet (Crites and Barto, 1998), or perhaps not possible due to its stochastic nature. In (Crites and Barto, 1998) Reinforcement Learning (RL) algorithms have been demonstrated to be powerful heuristic methods for addressing large-scale control problems and have been applied to elevator group control. A team of RL agents, each of which is responsible for controlling one elevator car was used. The team receives a global reward signal which appears noisy to each agent due to the effects of the actions of the other agents, the random nature of the arrivals and the incomplete observation of the state. The results demonstrated the power of multi-agent RL on a very large scale stochastic dynamic optimization problem of practical utility. Other works in this area based on fuzzy logic can be found in (Tan et al., 1997), (Kim et al., 1998), (Marja-Liasa, 1998), (Wang et al., 1999), (Koehler & Ottiger, 2002) and (Tanuj, 2004).
In this paper a detailed algorithm is presented to achieve the multiple objectives of minimizing the waiting time and the distance travelled simultaneously. This was accomplished by distributing different weightage to different quantities and then minimizing a combined cost. A simulator has been built with interactive GUI in Matlab to evaluate the effectiveness of the algorithm.
2. Elevator Configuration
optimum number of elevators. Most of the features are easy to understand. Thus, some basic features of the elevators have been adopted as follows:
• The building has 9 floors (1-9), 4 elevators which are independent of each other operationally but controlled by a common supervisory group controller based on fuzzy logic.
• The elevator travels in a fixed constant speed which is 1.5 meters per second. The inter-floor distance between each floor is selected to be 3 meters, so the elevator will only take 2 seconds to move from one floor to another. For each stops, the elevator will take 6 seconds to allow passengers to board or to alight the car.
3. Traffic Generation
The traffic generation for the hall requests is produced and generated in such a way that it mimics real life situations. It is well known that the real world stochastic processes like arrival of users for a service follow a Poisson distribution. For this case, the stochastic process is the arrival of passengers for the elevator services.
The probability that there are exactly x occurrences that take place during a fixed amount of time-interval is given by:
! ) , ( x e x P x
λ
λ
= −λ (1).The traffic generation for this elevator system is divided into 5 different modes:
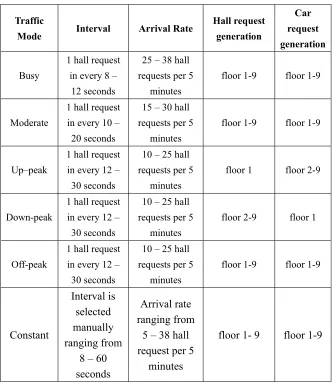
1. busy mode, 2. moderate mode, 3. up-peak mode, 4. down-peak mode, and 5.off-peak mode. The traffic for each mode is created using the random integer generator (“randint”) in MATLAB. In up-peak mode, all the hall requests are registered at the ground floor while in down-peak mode, all the car request’s destination is to the ground floor. On the other hand, for other traffic modes, their hall requests are generated randomly from the ground floor to the highest floor. Table 1 describes specifications of the 5 different modes and their respective arrival rates.
3.1 Input and Output Parameters
In order to achieve good performance, the elevator fuzzy logic controller uses 3 parameters as the control input and one parameter for output. These parameters represent the criteria or objective to be optimized in this elevator system. The input variables for the elevator system are:
Waiting time: is the total time that the passenger has to wait before an elevator serves his/her request.
Travelling distance: is the total distance travelled by an elevator before reaching a request from present state. Minimizing the distance means minimizing the energy consumed by the system.
Loading: is the number of passengers in an elevator. This is to have an idea about the load of each elevator so the controller can decide which car may serve a request.
Whereas the output variable is:
Priority:Output of the fuzzy logic controller, where the elevator (among the four) with the highest value of priority will be assigned.
3.2 Estimation of the Range for Input Variables
The range of the inputs for the elevator system have been estimated and found to be:
• Maximum waiting time is when the request is from the 9th floor and there is a request in every floor.
The expected waiting time is expressed in terms of number of floors and number of stops since the constant speed of the elevator is 1.5 meter per second which is in agreement to existing systems (Tanuj, 2004) while the height of each floor is 3 meter (inter-floor distance = 3 meters). Therefore the elevator takes only two second to travel from one floor to another. For each elevator stops, it takes approximately 6 seconds to unload or to load passengers. So the expression for calculating the waiting time is:
ewt=6*ns+ 2*nf; where: ewt: expected waiting time ns: number of stops
nf: number of floors between car position and the request.
• Maximum distance required to be travelled if from the ground floor to the ninth floor is 21 meters.
ed=3*nf where:
nf: number of floors between car position and the request.
4. Membership Functions and Fuzzy Sets
The membership function that is used for each quantity for the input variables is triangle function. For each quantity, a total of five membership functions were used. As for the output variable 3 triangle membership functions and 2 trapezoids function are used. Figure 1shows the membership function for waiting time input
There are 4 different types of fuzzy rule sets constructed with each to minimize a respective parameter. One of the fuzzy rules set minimizes waiting time, other set minimizes the distance travelled by the elevators, third set minimizes the loading and the last set minimizes all of them simultaneously. A sample of the first set is given in the passage below.
There are only 5 rules used and all of the rules have the same weightage which is one.
In the last set there are altogether 15 IF/THEN rules. All rules are described in one dimensional space for each input and output as shown below:
The number appearing at the end of each rule indicates the rule’s weight. Every rule has a weight which ranges from 0 to 1. Rules with higher weight will have a higher priority. The input waiting time is of the highest priority since the rule weight for it is 1.0 which is higher as compared to the other input variables. Based on the rules above, the fuzzy logic-based elevator will optimize the minimization of waiting time before considering the other quantities.
The rules above try to minimize all objectives simultaneously with the input variable of waiting time given the highest priority followed by loading and distance according to the different weightage assigned to them.
The fuzzy output which is priority indicates the suitability of a particular elevator to be assigned to a particular hall request. Depending on the fuzzy inputs and the rule bases, the output fuzzy set, ‘priority’ is computed using Mamdani inference scheme.
5. Rules Implementation in MATALB
5.1 Traffic Generation
5.3 Moving Status Assignment
Definitions of some variables used in the source code are as follows:
car assignment; it is an array of dimension 1 x 4. At the start, all the 4 values are set to zero since there is no hall request being registered. Once a hall request is assigned to an elevator, for instance if elevator 1 is being assigned to a hall request, car_assignment(1,1) will be set to 1 which means the first row and the first column of the array car_assignment will be set to 1.
car position (move_car_position); it is also an array of dimension 1 x 4 and its value is only from 1 to 9 which represents the floors in the building. In the example below, elevator 1 is located at 1st floor, elevator 2 is positioned at the 4th floor, elevator 3 is situated at the 7th floor and lastly elevator 4 is placed at the 9th floor.
hall_request; represents the hall requests that are active or registered. Similar to the car position, the values varies from 1-9. The array’s column size is determined by the number of hall requests served by a particular elevator. If there are 3 hall requests assigned to an elevator, then the array size would be 3 x 4. Example below shows that the 3 hall requests for elevator 1 are at the 2nd floor, 4th floor and 7th floor.
direction_of_hall_request; this variable represents the direction of the hall requests that are registered or active. Similar to the hall request, it has the same array size as the hall request. An up button is represented by ‘1’ while a down button is represented by ‘2’. In the example below a 3 hall requests with the desire of moving upwards are
status; also of dimension 1 x 4 and it represents the status of each elevator and it could be either 0, 1 or -1 for each elevator corresponding to idle, up and down respectively. Value below shows that elevator 1 is moving up, elevator 2 moving down while elevator 3 and 4 are idle.
loading; represents the number of people inside an elevator and it has an array size of 1 x 4. The maximum capacity of an elevator is 23 persons (1500Kg). The loading value below shows that there are currently 20, 4 and 13 people in elevator 1, 2 and 3 respectively
moving_status; it is of dimension 1 x 4 and it represents whether there are hall request or car request that are still active for a particular elevator. If there are still hall request that have not been served and the request are above the car position, then it will be 1. Similarly if the request is below the car position then it will be -1. If an elevator has served all of its requests, then it will be 0. Example below shows that elevator 1 and 4 has served all of its requests while elevators 2 and 3 still have active requests below and above them respectively
Carcall; it represents the car requests that are active or registered and it has an array size of 4 x 9. Each row represents each elevator and each column represents each floor in the building where the first row represents elevator 1 and so on. The numbers shown below represent the active car requests and their corresponding floors.
Unloading; It represents the number of people that is supposed to leave the elevator at a specific floor. It has the same dimension as Carall which is 4 x 9. Similar to CARCALL, each row represents each elevator and each column represents the number of people leaving the elevator at a specific floor where the first row represents elevator 1 and the first column represents the first floor and so on. The numbers shown in figure 3.21 below represents the number of people leaving the elevator at the corresponding floors.
6. Results and Discussions
from 5 to 38 hall requests per 5 minutes using four different fuzzy set rules with each trying to minimize theirs respective parameters.
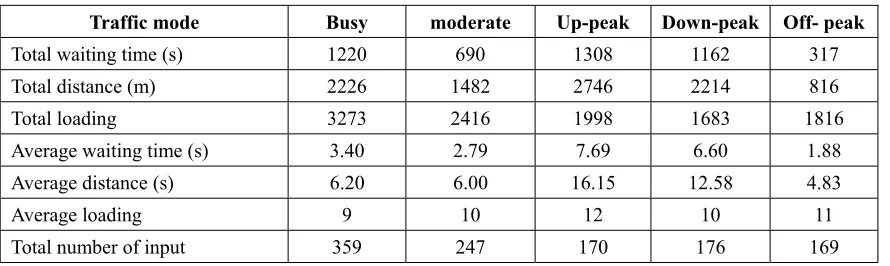
Each simulation case was run for a simulated time of 1 hour for each traffic pattern. The averages obtained are based on the number of hall requests registered within the 1 hour simulation time. The traffic patterns are busy, moderate, up-peak, down-peak, off-peak and constant whereby their specification were defined in Table 1. The results are shown in Tables 2, 3, 4 and 5. Graphical representations of the obtained results are shown in figures 2, and 3.
From the results shown in the tables and the figures, it can be seen that the waiting time is minimum when the waiting time minimization logic is used. Similarly, distance travelled is minimum when the distance minimization logic is chosen for all five traffic patterns. Minimization of distance travelled is basically means minimization of energy consumption. The least the elevator travel, the least the energy is needed to move the elevators. As for the minimization for loading, it has the highest value of averages for both the waiting time and distance travelled in all traffic modes because it only concentrates of minimizing the number of passengers in the elevator instead of the waiting time or distance which is the main concern in this system. Another important conclusion; is that the logic that minimizes all parameters simultaneously (optimum) produces good result because its averages stays close to the minimum value of the logic that minimizes the concerned quantities.
The average value for both waiting time and distance travelled decreases as the traffic reduces from busy to moderate and finally to off-peak. This is due to the reduction of arrival rate for each traffic whereby busy has the highest arrival rates followed by moderate and lastly off-peak.
7. Conclusion
A fuzzy logic-based controller of a four-car elevator was presented in this paper. A description of the configuration of the elevator including its design features, its inputs and outputs parameters were given. A set of fuzzy rules was drawn based on practical considerations; mainly minimization of waiting time and energy consumption. The simulation and execution of these rules using MATLAB showed the effectiveness of the controller in minimizing the waiting time compared to the works in the literature. However a hardware implementation is be accomplished in order to ascertain the simulation results.
References
Crites, R. & Barto, A. (1998). Elevator group control using multiple reinforcement learning agents. Machine Learning: 33, 235-262.
Kim, C. Kyoung, A., Kwang, H.L., and Kim, J.o. (1998). Design and Implementation of a Fuzzy Elevator Group Control System. IEEE Transactions on Systems.Man and Cybernetics, Part A: Systems and Humans: 28, 277-287. Koehler, J. & Ottiger, D. (2002). An AI-based approach to destination control in elevators. AI Magazine: 23(3), 59-79. Marja-Liisa, S. M. (1997). Elevator Group Control with Artificial Intelligence”, KONE Corporation, Helsinki University of Technology, Systems Analysis, Laboratory, Research Reports, A67, October 1997.
Tan K.K. Marzuki K., & Rubiyah Y. (1997). Intelligent Elevator Control By Ordinal Structure Fuzzy Logic Algorithm: Proc. of ICARCV 97, Singapore.
Tanuj A. (2004). Intelligent Control of Group of Elevators. Dual Degree Report, Indian Institute of Technology Bombay, Mumbai, India.
Table 1. Modes of Traffic Generation
Traffic
Mode Interval Arrival Rate
Hall request generation Car request generation Busy
1 hall request in every 8 –
12 seconds
25 – 38 hall requests per 5
minutes
floor 1-9 floor 1-9
Moderate
1 hall request in every 10 – 20 seconds
15 – 30 hall requests per 5
minutes
floor 1-9 floor 1-9
Up–peak
1 hall request in every 12 – 30 seconds
10 – 25 hall requests per 5
minutes
floor 1 floor 2-9
Down-peak
1 hall request in every 12 – 30 seconds
10 – 25 hall requests per 5
minutes
floor 2-9 floor 1
Off-peak
1 hall request in every 12 – 30 seconds
10 – 25 hall requests per 5
minutes
floor 1-9 floor 1-9
Constant
Interval is selected manually ranging from
8 – 60 seconds
Arrival rate ranging from
5 – 38 hall request per 5
minutes
floor 1- 9 floor 1-9
Table 2. Averages for minimizes waiting time only for 5 traffic mode
Traffic mode Busy moderate Up-peak Down-peak Off- peak
Total waiting time (s) 1128 574 1232 1034 301
Total distance (m) 2259 1426 2864 2109 886
Total loading 3493 2300 1727 1594 1725
Average waiting time (s) 3.14 2.32 7.29 6.30 1.75
Average distance (s) 6.29 5.77 16.95 12.86 5.15
Average loading 10 9 10 10 10
[image:8.595.90.534.502.635.2]Table 3. Averages for minimizes distance only for 5 traffic mode
Traffic mode Busy moderate Up-peak Down-peak Off- peak
Total waiting time (s) 1364 706 1440 1044 353
Total distance (m) 2172 1385 2660 2019 807
Total loading 3104 2383 1941 1533 1650
Average waiting time (s) 3.80 2.86 8.37 6.29 2.02
Average distance (s) 6.05 5.61 15.47 12.16 4.61
Average loading 9 10 11 9 9
[image:9.595.65.505.286.418.2]Total number of input 359 247 172 166 175
Table 4. Averages minimizes loading only for 5 traffic mode
Traffic mode Busy moderate Up-peak Down-peak Off- peak
Total waiting time (s) 2340 1396 1336 1144 832
Total distance (m) 3978 2562 3057 2175 1656
Total loading 3473 2420 1856 1708 1841
Average waiting time (s) 6.41 5.92 7.68 6.69 4.89
Average distance (s) 10.90 10.86 17.57 12.72 9.74
Average loading 10 10 11 10 11
Total number of input 365 236 174 171 170
Table 5. Averages for minimizing all parameters simultaneously for 5 traffic mode
Traffic mode Busy moderate Up-peak Down-peak Off- peak
Total waiting time (s) 1220 690 1308 1162 317
Total distance (m) 2226 1482 2746 2214 816
Total loading 3273 2416 1998 1683 1816
Average waiting time (s) 3.40 2.79 7.69 6.60 1.88
Average distance (s) 6.20 6.00 16.15 12.58 4.83
Average loading 9 10 12 10 11
[image:9.595.64.509.475.608.2]Figure 1. membership function for waiting time input
Average Waiting Time (s) vs Arrival Time (hall request per 5 minutes)
0.0 1.0 2.0 3.0 4.0 5.0 6.0 7.0 8.0 9.0
5 10 15 21 25 30 38
Arrival Time (hall request per 5 minutes)
[image:10.595.151.474.282.482.2]A ver ag e W a it in g T im e ( s ) Optimum Min, Wait Min. Distance Min. Loading
Figure 2. Averages for waiting time at various constant arrival rates
Average Distance (m) vs Arrival Rate (hall request per 5 minutes)
0.0 2.0 4.0 6.0 8.0 10.0 12.0
5 10 15 21 25 30 38
Arrival Rate (hall request per 5 minutes)
A v e rage D ist ance (m ) Optimum Min. Wait Min. Distance Min. Loading
[image:10.595.173.451.523.696.2]